Release 11g (11.1.1)
Part Number E20837-01
Contents
Previous
Next
| Oracle Fusion Middleware Administrator's Guide for Oracle Business Intelligence Publisher (Oracle Fusion Applications Edition) Release 11g (11.1.1) Part Number E20837-01 | Contents | Previous | Next |
This chapter covers the following topics:
The architecture of the 11g BI Publisher Scheduler uses Java Messaging Service (JMS) queue technology. This architecture enables you to add multiple BI Publisher servers to a cluster and then dedicate each server to a particular function: report generation, document generation, or specific delivery channels. This increases the flexibility to scale up report processing servers for high volume scheduled jobs.
Topics in this chapter include:
The architecture of the BI Publisher Scheduler uses JMS queues and topics to provide a highly scalable, highly performing and robust report scheduling and delivery system.
Oracle Fusion Applications uses Enterprise Scheduler Services as the scheduling engine. All other implementations use the Quartz scheduling engine.
The following diagram displays the scheduler architecture:
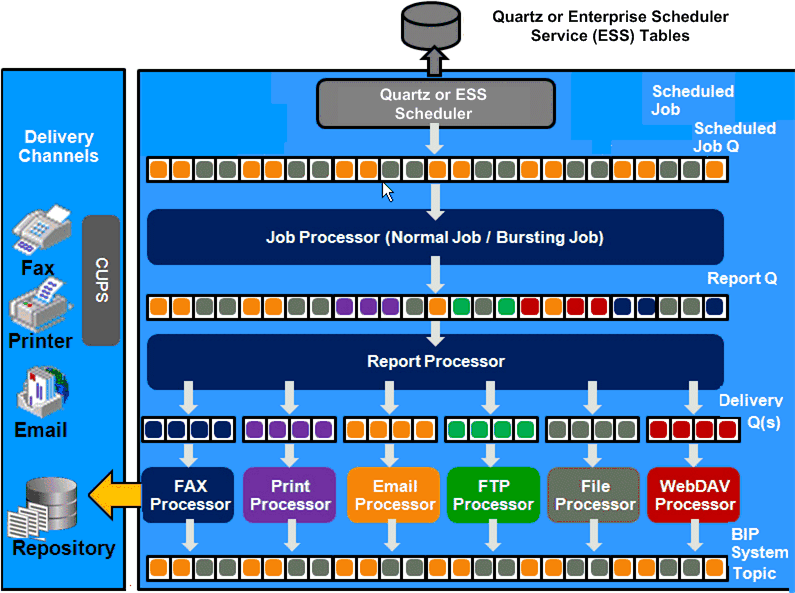
Following describes the tasks performed by the scheduler when a job is submitted:
Submit Job
Stores job information and triggers in Quartz or Enterprise Scheduler Services tables
Job Processor
When Quartz or Enterprise Scheduler Services trigger is fired, puts job information in Scheduler job queue
Bursting Engine / Batch Job Process
Bursting Engine Listener
Takes the scheduled job information from the queue
Extracts data from data source
Splits data as per bursting split by definition
Stores data temporarily in temp folder
Puts report metadata into Report Queue
Batch Job Process
Takes the scheduled job information from the queue
Extracts data from data source
Stores data temporarily in temp folder
Puts report metadata into Report Queue
FO Report Processor
Listens to Report Queue
Generates report based on metadata
Stores report in shared TEMP directory
Puts report delivery information in Delivery Queue
Delivery (E-mail, File, FTP) Processors
Listen to Delivery queue
Call delivery API to deliver to different channels
BI Publisher (BIP) System Topic
The BIP System Topic publishes the runtime status and health of the scheduling engine. The topic publishes the status of all instances, the thread status of messages in the JMS queues, the status of all scheduler configurations such as database configuration, JNDI configuration of JMS queues and so on.
BI Publisher clustering support enables you to add server instances on demand to handle processing and delivery load. In a clustered implementation, the report repository and the scheduler database are shared across the multiple instances; also, the JMS queues for scheduling and JMS topic for publishing diagnostic information are shared across the server by registering JMS queues and topics via JNDI services.
Each managed server instance points to the same report repository. In each managed server instance all the processes (Job Processor, Report Processor, Email Processor, FTP Processor, Fax Processor, File Processor, Print Processor, and WebDav Processor) are configured. Therefore the moment a server instance pointing to the same repository is deployed, it is added to the cluster and all the processors in this instance are ready to run.
You can select the process that you want to enable on any server instance, thereby utilizing the resources optimally. Moreover, if there is a demand to increase job throughput, you can add more instances for report processing. Similarly, if e-mail delivery is the most preferred delivery channel, more instances can be added to manage e-mail delivery.
For more information about clustering and high availability, see the Oracle Fusion Middleware High Availability Guide 11g Release 1 (11.1.1). Oracle Fusion Applications customers see the Oracle Fusion Applications Enterprise Deployment Guide.
BI Publisher provides a failover mechanism so that no report fails to deliver due to server unavailability. Achieve this by balancing each process of the scheduler using two or more nodes in a cluster thereby ensuring that a failure of any node will be backed up by the second node. For example, by enabling the Job Processor in two nodes, in the event of failure of one node, the second node will be able to process the job queue.
Important: If a node goes down, the other nodes will continue to service the queue. However, if a report job is in one of the following stages of execution: data retrieval, data formatting, or report delivery, the job will be marked as failed, and must be manually resubmitted.
Following are topics to consider before setting up the scheduler:
By default, the BI Platform installer configures the WebLogic JNDI connection URL. JDBC is not recommended for production use. JDBC should only be used for low volume local testing.
When you install BI Publisher, the scheduler is automatically configured to use WebLogic JMS. To use configure BI Publisher to use ActiveMQ instead, see Configuring BI Publisher for ActiveMQ.
After you install BI Publisher using the BI Platform Installer and start up the servers, the BI Publisher scheduler will be running and the following is configured:
The scheduler schema is installed to the database by the Repository Creation Utility as a pre-install step.
JMS is configured in your server for BI Publisher.
The WebLogic JNDI URL is configured.
Default threads per processor is set to 5.
See the Oracle Fusion Middleware Installation Guide for Oracle Business Intelligence for more information on configurations performed by the Oracle BI Platform Installer.
You can see this configuration in the Scheduler Configuration page: From the Administration page, under System Maintenance, click Scheduler Configuration. The following screenshot shows the Database Connection and JMS Configuration regions of the Scheduler Configuration page:
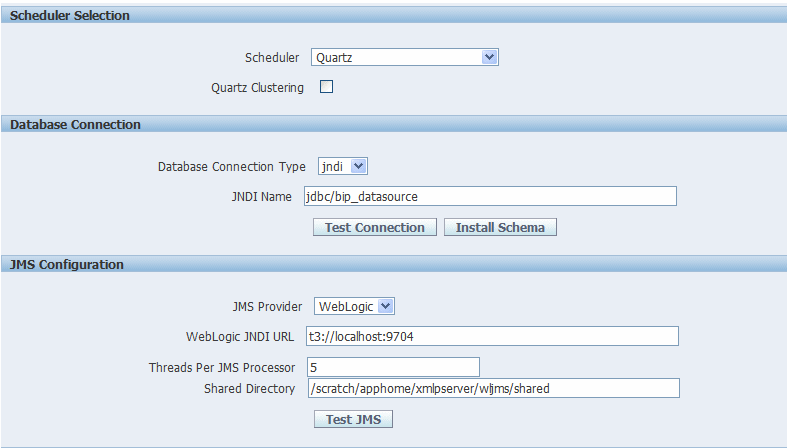
The Shared Directory is used to temporarily store data and files used by the scheduler while jobs are executing. After a job completes, the temporary data for the job is deleted. If the BI Publisher scheduler is configured to run on different nodes or machines, you must define this directory. The directory is used to exchange data and document information among all the BI Publisher nodes and therefore must be accessible by all BI Publisher nodes.
The size of the directory depends on the total size of the job data, output documents, and the number of concurrent jobs. The directory should be big enough to hold all the XML data and documents for all the parallel running jobs. If BI Publisher runs on different machines while this directory is not configured, the scheduler may fail.
If BI Publisher runs on a single machine, the directory setup is optional. BI Publisher will use the application server’s temporary directory to store this data.
For each cluster instance that you have configured, a processor configuration table will display. Use the tables to enable and disable processors and specify threads for each processor.
The default number of threads for each processor is set by the Threads per JMS Processor property under JMS Configuration (shown above). Edit the threads for a specific processor in the Cluster Instances region by updating the Number Threads setting. Note that processors that use the default setting will show no entry in the table. Enter a Number Threads value only to set a thread count for a particular processor to differ from the default.
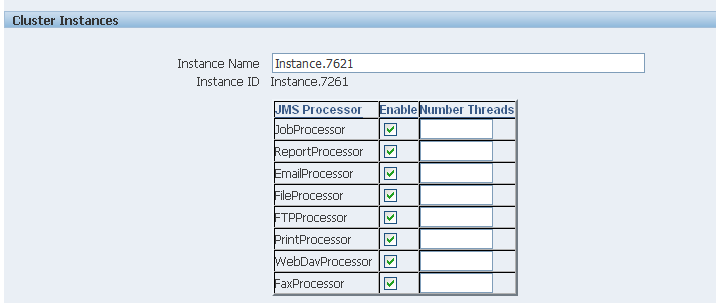
The optimum number of threads per processor will depend on the requirements of your system. You can use the Scheduler Diagnostics page to help in assessing load in your system. See Scheduler Diagnostics.
To add managed servers to your system, see Adding Managed Servers.
Add managed servers in the Oracle WebLogic Administration Console and then configure the cluster instances in the BI Publisher Administration page.
For detailed information on using the Oracle WebLogic Administration Console see Oracle WebLogic Server Administration Console Help system. For additional information about Fusion Middleware Control and how to use it, see Oracle Fusion Middleware Administrator's Guide.
Access the Oracle WebLogic Administration Console using one of the following methods:
Click Lock & Edit.
Under Domain Structure, expand Environment and click Servers.
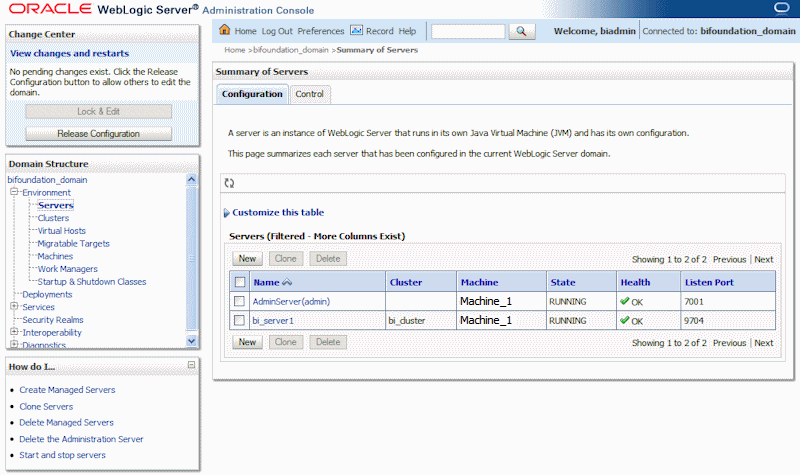
On the Servers table, click New.
On the Create a New Server: Server Properties page:
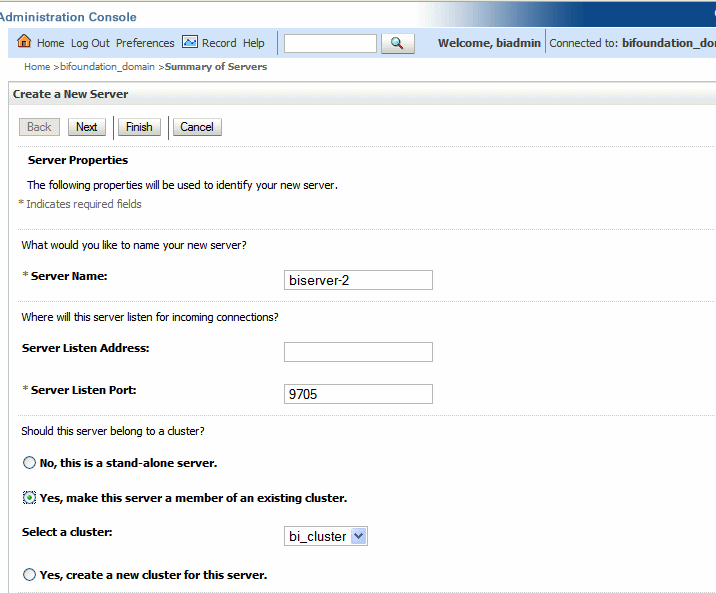
Enter the name of the server in the Name field.
In Listen Port, enter the port number from which you want to access the server instance.
Select Yes, make this server a member of an existing cluster.
Select the bi_cluster from the list.
Click Next.
Review the configuration options you have chosen.
Click Finish.
The new server displays in the Servers table.
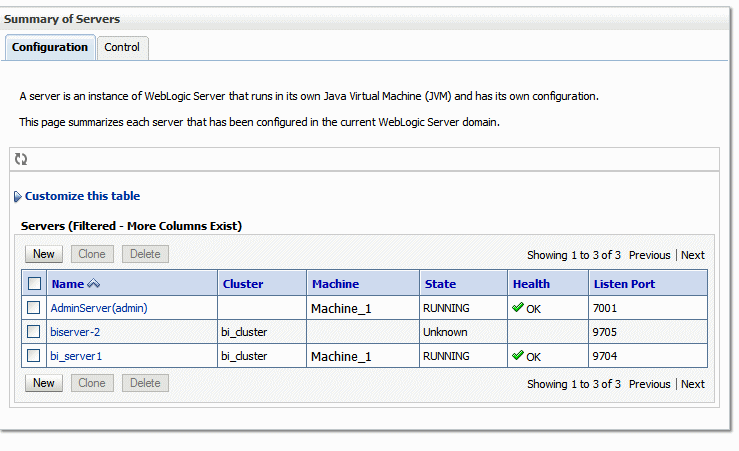
Click the server name to open the Settings page.
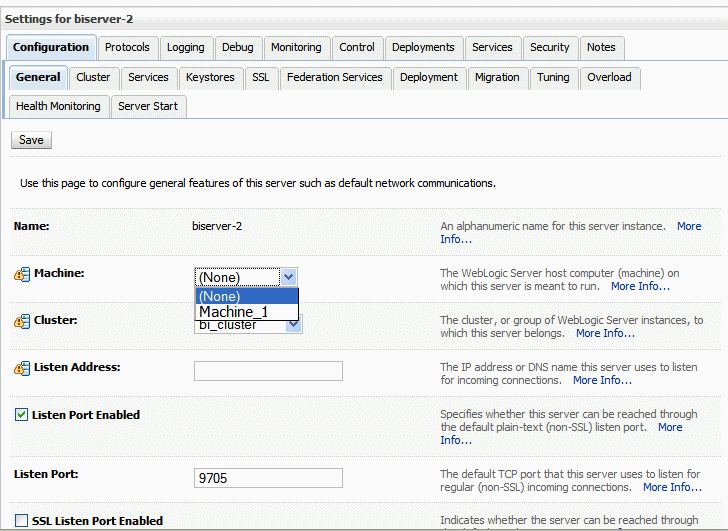
Select a Machine for the new server.
Click Save.
Click Activate Changes.
Start the new server.
After the new managed server has been started, the set of processors for that server display in the BI Publisher, as shown in the following figure:
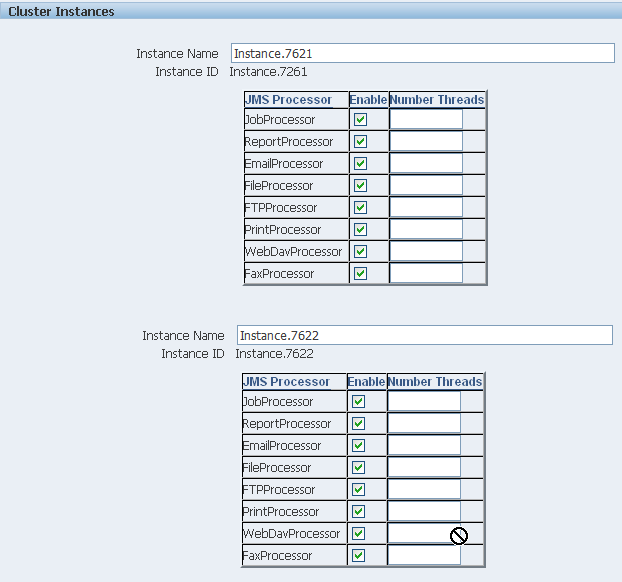
You can now configure the threads appropriately for your system load.
The Scheduler diagnostics page provides the runtime status of the scheduler. It provides status of its JMS configuration, JMS queues, Cluster instance status, Scheduler Database status, Toplink status, and Scheduler (Quartz or Enterprise Scheduler Service) status.
The Diagnostics page displays how many scheduled report requests have been received by the JMS queues, how many of them have failed and how many are still running. The JMS status can be viewed at the cluster-instance level enabling you to decide whether to add more instances to scale up by one or more of these JMS processors.
For example, if there are too many requests queued up for the e-mail processor in one instance, you can consider adding another instance and enabling it to handle e-mail processing. Similarly, if there are very large reports being processed and showing in the Report Process queue in running status, then you can add another instance to scale up the Report Process capability.
Also, the Scheduler Diagnostics page reflects the status of each component to show if any component is down. You can see the connection string or JNDI name to the database, which cluster instance associates to which managed server instance, Toplink connection pool configuration, and so on.
If an instance shows a failed status, you can recover the instance and with the failover mechanism of the JMS set up in the cluster, no jobs submitted will be lost. Once the server instance is brought back, it will immediately be available in the cluster for service. The instance removal and addition will reflect dynamically on the diagnostic page.
When an instance is added to the cluster, the Scheduler Diagnostics page immediately recognizes the new instance and displays the status of the new instances and all the threads running on that instance. This provides a powerful monitoring capability to the administrator to trace and resolve issues in any instance or any component of the scheduler.
The Scheduler Diagnostics page provides information on the following components:
JMS
Cluster
Database
Scheduler Engine
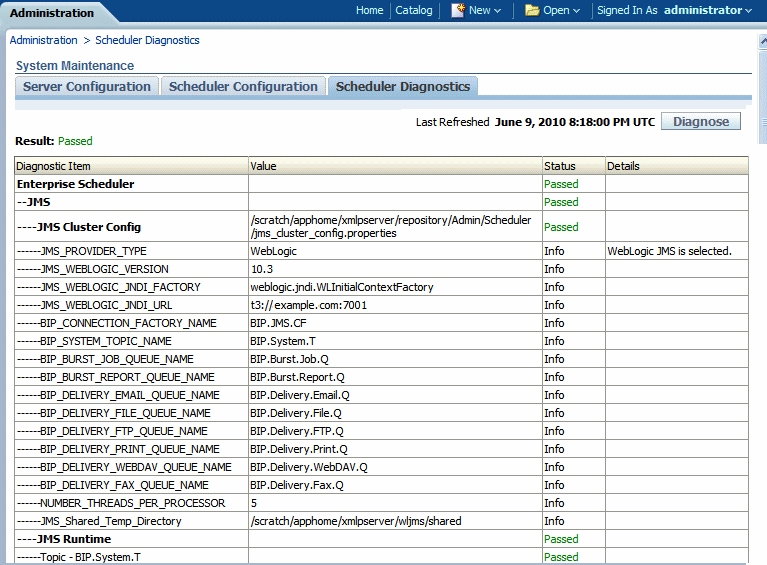
The JMS section provides information on the following:
JMS Cluster Config: This section provides configuration information for JMS setup:
provider type (Weblogic / ActiveMQ)
Weblogic version
Weblogic JNDI Factory
JNDI URL for JMS
Queue names
Temporary directory
JMS Runtime: This provides runtime status of all JMS queues and topics

The Cluster section provides details on the cluster instance. Use this information to understand the load on each processor:
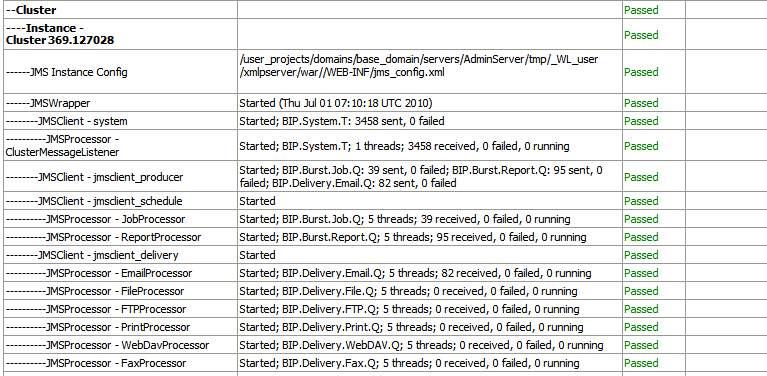
JMS instance config
JMS Wrapper
JMS Client – System - provides status of the BIP System topic. The scheduler diagnostic page is a subscriber to this topic.
JMS Client_producer - not used in this release.
JMS Client_schedule - provides status of the job processor and report processor, each processor showing number of active threads, number of messages received, number of messages failed, and number of messages running.
JMS Client_delivery - provides status of different delivery processors as listeners, each delivery processor showing number of active threads, number of messages received, number of messages failed, and number of messages running.
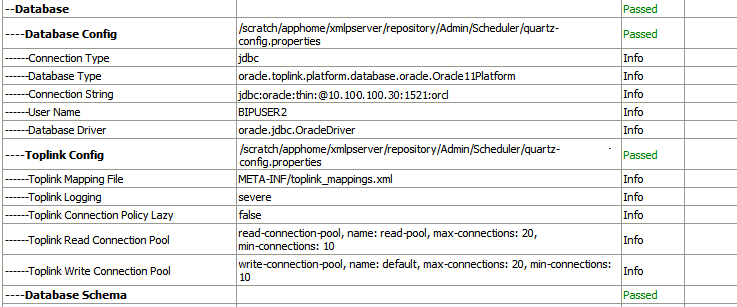
The Database section provides information on:
Database Config - connection type, JNDI Name, or connection string
Toplink Config - connection pooling, logging level
Database Schema
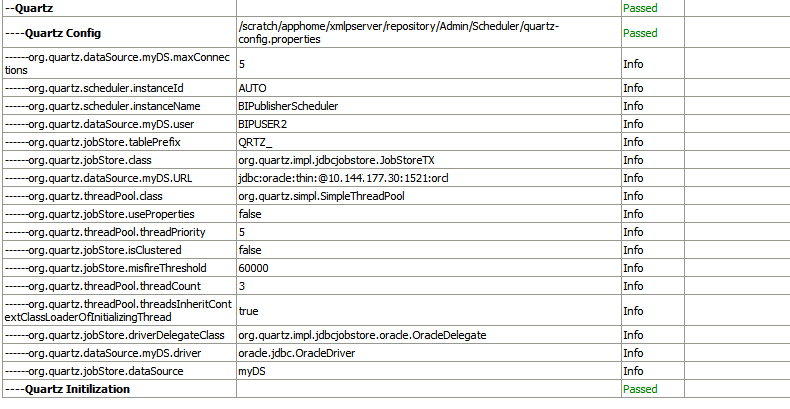
The Quartz section provides information on:
Quartz Configuration
Quartz Initialization
Note: This section will not display for Oracle Fusion Applications implementations.
![]()
Copyright © 2010, 2011, Oracle and/or its affiliates. All rights reserved.