Oracle Advanced Project Planning and Control Plus

This chapter covers the following topics:

Overview

The Oracle Advanced Project Planning and Control Plus application suite includes a variety of features central to the requirements of competent and efficient enterprise project management. It enables project managers to effectively oversee their projects, assess progress against predetermined milestones and budgets, staff their projects with appropriate talent, and quickly generate a wide variety of reports. It also helps virtual and globally distributed project teams to efficiently communicate, collaborate, and complete tasks. Oracle Advanced Project Planning and Control Plus provides a programmatic strategy for tracking, monitoring and controlling a project. By having all key performance indicators of the project at one place enables project managers to watch the metrics, drill down in to details, discover reasons for deviations and then to take appropriate, corrective measures if needed.

Oracle Advanced Project Planning and Control Plus enables you to search and filter projects and tasks from a dashboard, view financial, workplan and expenditure information and make updates to the plans. You can view and analyze financial and workplan information and drilldown to expense items or other information using performance metrics, charts, graphs, tables and alerts. Based on this data, project managers or controllers can take immediate action to bring their project back on track and on schedule.

This chapter provides product-specific details required to integrate Endeca Information Discovery (EID) with Oracle E-Business Suite (EBS) Release 12.2 V8 for the Oracle Advanced Project Planning and Control Plus application. This supplements the information provided in Installing Oracle E-Business Suite Information Discovery, Release 12.2 V8 (Doc ID: 2214431.1). You must read this document and make note of the requirements before you begin your installation.

Oracle Advanced Project Planning and Control Plus User Interface and Integration

Oracle Advanced Project Planning and Control Plus User Interface

Oracle Advanced Project Planning and Control Plus updates are available from the Advanced Project Planning and Control, the Workplan Overview, the Billing Overview, the Financial Overview, and the Expenditure Overview pages. All these page displays information and data graphically and in tabular format.

Advanced Project Planning and Control Page

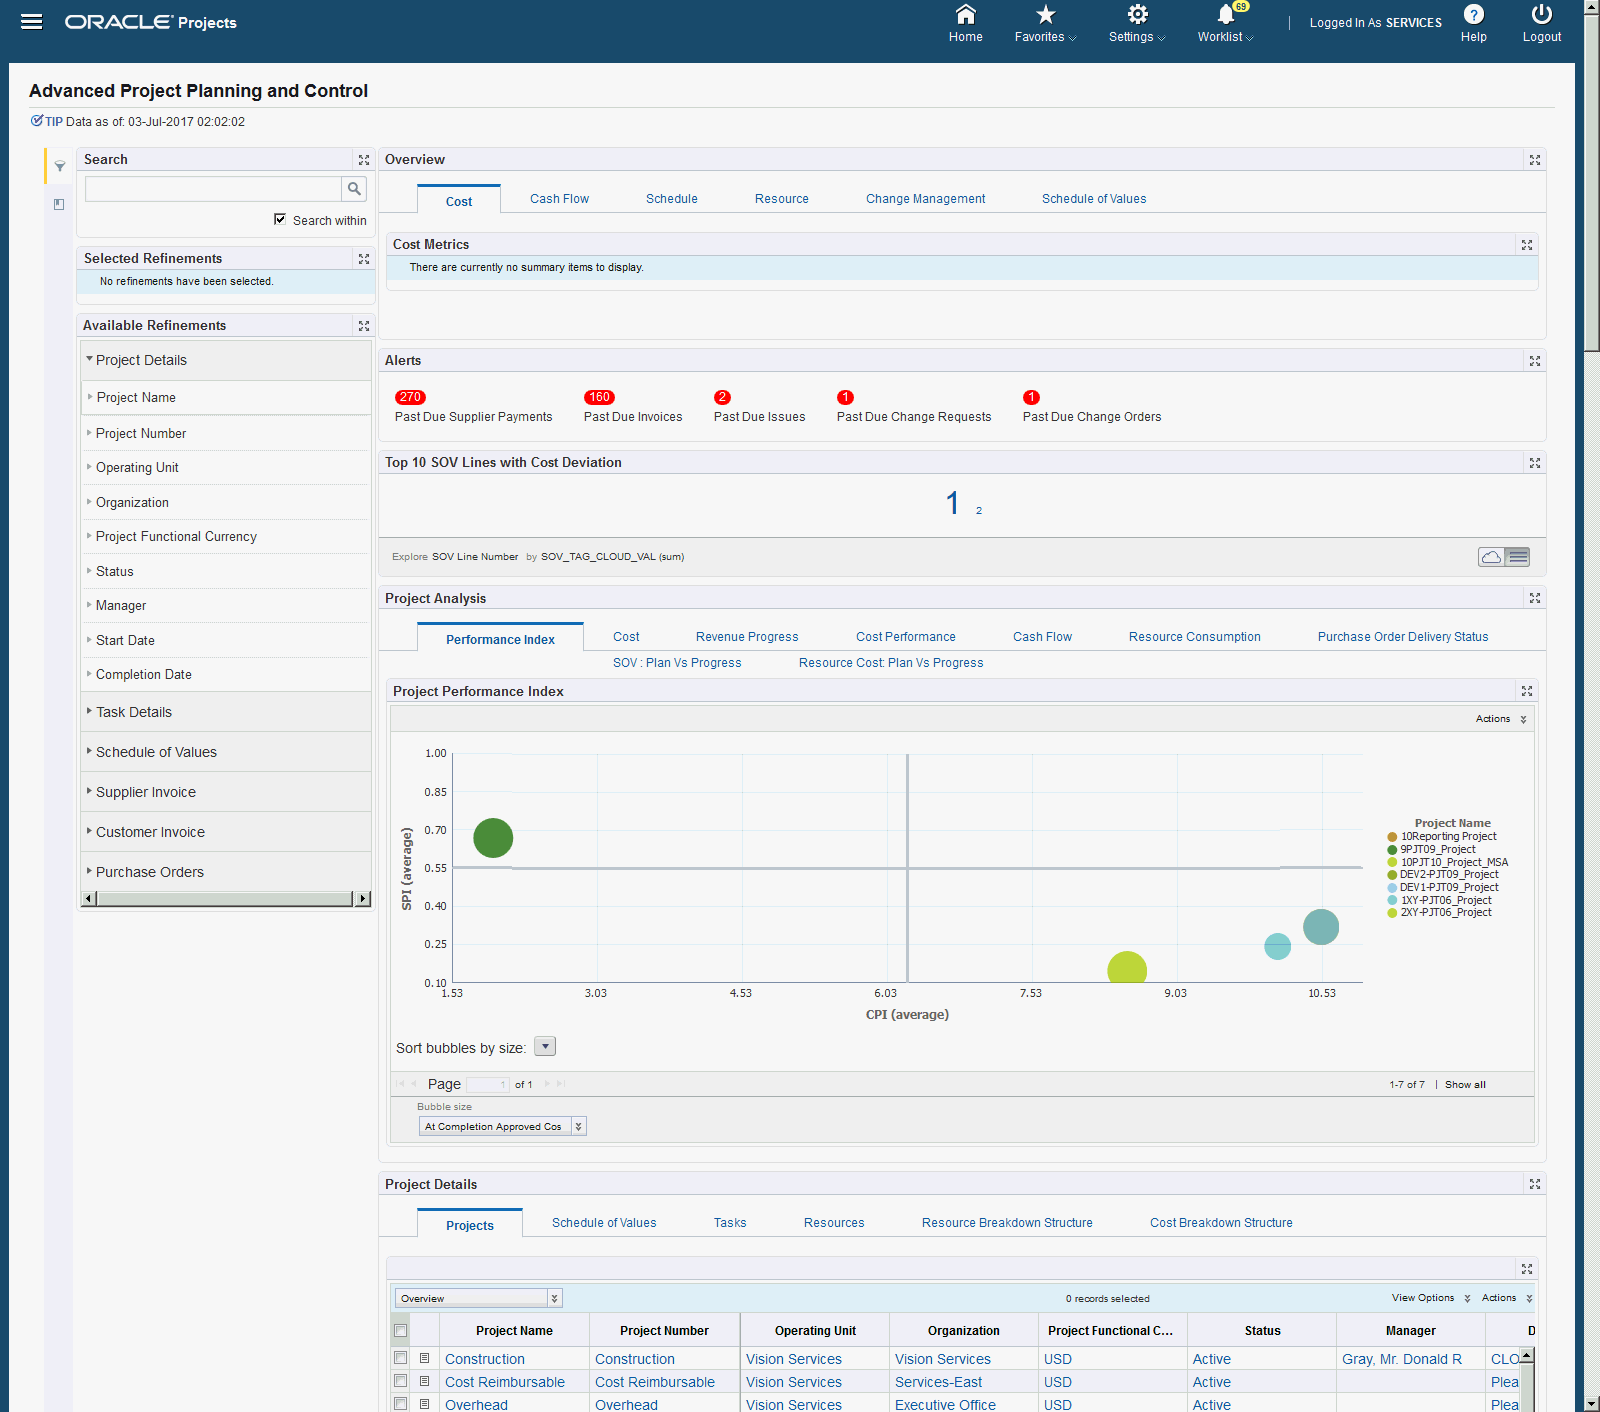
The Advanced Project Planning and Control page displays monitoring metrics across the projects and enables you to navigate down to individual projects and further to the task and resource assignment level. The components of the Advanced Project Planning and Control page are:
the picture is described in the document text

Region Component
Tip Displays the date on which the data was last refreshed.
Search
  • Boolean Search

  • Search Within

The Advanced Search component includes value search, record search, Boolean search, and partial search capabilities. You can submit keyword searches and the application provides type-ahead suggestions and displays attribute values that match the typed text. When you perform a search, the search term is added to the Selected Refinements component. As you type, you may be prompted to select a matching attribute value, or simply search for the entered text.

Additional Information: See the Advanced Search Capabilities appendix in this guide for details.


Partial record search is enabled for specific attributes. Attributes for partial record search include:
  • Project Number

  • Project Name

  • Manager

  • Task Name

  • Task Number

  • Task Manager

  • Supplier Name

  • Resource Class

  • Resource Name

  • Customer Name

  • Project ID

  • Supplier Number

  • PO Number

Selected Refinements The Selected Refinements component displays all values that you have selected to filter data, and allows you to quickly make adjustments to the current refinement by removing items or clearing all filters from the list.
Bookmarks The Bookmarks component allows you to save a given navigation and component state and return to it at a later time.
Available Refinements The Available Refinements component allows you to filter data based on the currently available values or value ranges for selected attributes that are displayed within attribute groups. Expand the following attribute groups to view and select attribute names:
  • Project Details

  • Task Details

  • Supplier Invoice

  • Customer Invoice

  • Purchase Orders

Overview Consists of the following details:
  • Cost tab - this displays all metrics and measures abstracted from financial plans and final progress. This metrics displays Currency, Total Revenue, Planned Revenue to Date, Actual Revenue to Date, Budgeted Cost Work Performed, Actual Cost Work Performed, Total Expenditure Budget (BAC), and CPI.

  • Cash Flow tab - displays Gross Margin till Date (GMTD), Cash Inflow and Cast Outflow, Cash Position, Past Due Invoices, Past due Vendor Payments, Open Payments, Work in Progress (Unbilled), and Non Billable Expenditure metrics.

  • Schedule tab- displays schedule performance metrics like SPI, Planned Financial %, Actual Financial %, Cost Variance (CV), Estimate At Completion (EAC), Estimate To Complete (ETC), and Variance At Completion (VAC).

  • Resource tab - displays resource performance indicators against their capacity for People performance Index, Equipment Performance Index, Material Performance Index, People forecast, Equipment Forecast, and Material Forecast.

  • Change Management tab - displays metrics related to change management. This includes Open Issues, Pending Change Orders, and Pending Change Requests.

  • Schedule of Values tab - displays metrics related to schedule of values. This includes Qty% Complete, Plan vs Progress Percent, Unit Cost Variation, Progress vs Billing Ratio, and %WIP from Billing

Alerts The available alerts are:
  • Issues Past Due - displays issues that are past their due date

  • Past due Invoices - displays customer invoices that are past due by the committed payment date

  • PO Past Due Deliveries (Delivery beyond need by date) - displays Purchase Orders with a Promised date greater than Need By date

  • Past Due Supplier Payments - displays supplier payments which are pending as of the system date

  • Past Due Change Requests - displays change requests which are past their due dates.

  • Past Due Change Orders - displays hange orders which are past their due dates.

Note: Alerts are displayed based on the criteria defined above. If there is no data matching the criteria, then that alert is not displayed.

Top 10 SOV Lines with Cost Deviation This tag cloud displays the top ten Schedule of Values lines with cost deviation.
Project Analysis Contains the following tabs:
  • Performance Index - displays a bubble chart called Project Performance Index, where each bubble represents a project and the size of the bubble represents the total revenue value of the project. The X axis represents CPI and the Y axis represents SPI. Depending on placement of project bubble in the quadrant, it represents the performance against the CPI and SPI. Click an individual bubble, the bubble chart renders again to a single project and all the top tasks of that project shown as bubbles. You can export data, print data or use the save as image option for this chart.

  • Cost - displays a bar & line chart (in combination) called S- Curve, where the bars represent the planned revenue across the periods. The Y axis represents the amount and the X axis represents time or periods. The Line (Curve) represents the actual revenue and Actual cost (ACWP & BCWP).

  • Revenue Progress - this tab displays a Revenue Progress bar chart, where the bars represent planned revenue and the actual revenue (based on task). The Y axis represents the amount and the X axis represents tasks. Additionally, this tab also displays another bar chart called Revenue, where the bars represent At-Completion Approved Revenue, Planned Revenue, and Actual Revenue. You can change the value axis to Opportunity Lost using the list of values. If you do this, then the bars represent At-Completion Approved Revenue, Opportunity Lost (Planned Revenue – Actual Revenue), and Balance Revenue (At-Completion Approved Revenue - Actual Revenue). You can export data, print data or use the save as image option for this chart.

  • Cost Performance - this tab displays the High Level Cost Performance bar chart, which displays cost performance either across projects or across tasks within a project based on the context. By default, the bars represent BCWP & ACWP, and you can change the value axis to:

    • Cost Variance - displays the cost variance between the BCWP & ACWP

    • Revenue Variance - displays the difference between the planned revenue and actual revenue

    • ITD planned vs ITD Actual Cost - displays the Planned Cost and Actual Cost

    • ITD planned vs ITD Actual Revenue - displays the Planned Revenue and Actual Revenue

    You can export data, print data or use the save as image option for this chart.

    The Cost Performance tab also displays a Cost Deviation bar chart, which is always at the project level and the top task level. However, based on the selection made in the High Level Cost Performance chart, the next level of tasks is shown in the cost deviation chart.

  • Cash Flow tab - displays a combination of lines and bar chart called Cash Flow, where the bars represent current month cash inflow (from AR) and cash out flow (from AP). The lines represent cumulative cash inflow from ITD and cumulative cash out flow since ITD. This tab also displays a pie chart called Billed vs Unbilled, which displays the ratio of the total Billed vs Unbilled expenditures.

  • Resource Consumption tab - displays a bar chart called Resource Consumption, where the three bars which represent three resource classes - : People, Material and Equipment. This displays the actual spent on each resource class against their budgeted cost. Budgeted cost is taken as 100 % and the actual are the representation against budget. In addition, this tab also displays a pie chart, called Top Commodities (Category) Consumed To-Date, which represents the top commodities with spend based on their share of total spend on procurement for the project.

  • Purchase Order Delivery Status tab - displays a bar chart Purchase Order Status, which represents how much is ordered in total and how much is received based on each material.

  • SOV Plan Vs Progress - this bar chart represents the planned quantity of work to be executed for a deliverable (SOV) and the executed quantity of the same deliverable. You can sort based on Project Number, Project Number by Planned Quantity (sum), or Project Number by Actual Quantity (sum).

  • Resource Cost Plan Vs Progress - these bar charts display actual resource-wise cost spent versus the total effort assigned for the resource on the project. You can also view the chart by Project Number, SOV Line Number or Period. They also represent the amount of work progressed for the planned effort and planned quantity. You can drill down on this chart from Resource class to Resource level, Resource productivity efficiency. You can view the following charts:

    • Available Vs Required - you can sort based on Resource Class, Resource Class by Planned Cost Work Progressed (sum), Resource Class by Actual Cost (sum), or Resource Class by Resource Productivity Index (average).

    • Planned Vs Progress - you can sort based on Resource Class, Resource Class by Planned Quantity (sum), Resource Class by Actual Quantity (sum), or Resource Class by Resource Productivity Index (average).


You can export data, print data or use the save as image option for these charts.
Project Details This displays the following tabs:
  • Projects - you can view the Overview of the selected Project , or choose an action to complete for the project. Click any of the hyperlinks in the Overview view to refine your search results further using the selected value. In the Actions view, the Project Name and Project Number enable you to refine your search results using those values. Click Details to view the Project Details in the Project Home page. Click Actions to navigate to the Project Actions page, where you can select the action to complete and proceed to complete it. Click Workplan to navigate to the Workplan Overview page. Click Financial to navigate to the Financial Overview page. Click Expenditures to navigate to the Expenditure Overview page. Click Procurement to navigate to the Procurement Plan page. Click Billing to navigate to the Billing Overview page. Click Create Issue to navigate to the Issues page. Click the Create Change Request link to navigate to the Change Requests page. Click Create Change Order to navigate to the Change Orders page.

  • Schedule of Values - you can view the Overview, Revenue, Cost, Forecast, or choose an Action to complete. You can also click the row to view details of the selected row.

    • In Overview, you can view the Project Number, SOV Line Number, SOV Line Description, UOM, Schedule Start Date, Schedule End Date, and Project Name. Click any of the hyperlinks in the Overview view to refine your search results further using the selected value.

    • In Revenue, you can view the Project Number, SOV Line Number, Rate (billing rate in project currency), Planned Quantity, Planned Revenue, Planned ITD Quantity, Planned ITD Revenue, Actual Quantity, Actual Progressed Amount, and Schedule Performance Index. Click any of the hyperlinks in the Revenue view to refine your search results further using the selected value.

    • In Cost, you can view the Project Number, SOV Line Number, Budgeted Work Scheduled Cost, Budgeted Work Performed Cost, Actual Work Scheduled Cost, Actual Work Performed Cost, and Cost Performance Index. Click any of the hyperlinks in the Cost view to refine your search results further using the selected value.

    • In Forecast, you can view the Project Number, SOV Line Number, Estimate to Complete, Estimate at Completion, and To Complete Performance Index. Click any of the hyperlinks in the Forecast view to refine your search results further using the selected value.

    • In Actions view, you can view the Project Number and the SOV Line Number. Click Create Change Order to create a change order for the selected project using the Change Orders page. Click View/Edit ARR to open the Activity Resource Requirements page and maps to the specific SOV for the selected project.

  • Tasks - you can view the Project Name, Task Name, Task Number, Task Manager, Project Functional Currency, Billable, Critical, Task Scheduled Start Date, Task Scheduled Finish Date, Task Actual Start Date, Task Actual Finish Date, Quantity, Raw Cost, Burdened Cost, Actual Quantity, Actual Raw Cost, Actual Burdened Cost, ETC Quantity, ETC Burdened Cost, Variance Due to Quantity, Variance Due to Cost, Cost Performance Index, Scheduled Performance Index, Earned Value, Total Planned Cost, ETC_WBS, Variance at Completion, and Cost Variance. Planned, Actual Quantity, Cost, Revenue At Completion /ITD/PTD/QTD/YTD amounts/values are also displayed. Click any of the links to refine your search results further using that value. You can Print, and Export the search results from the Actions menu. You can also use the Actions menu to Compare two or more rows. You can use the Actions menu to Update Multiple Tasks, Mask Task Update, Mass Progress Update by selecting two or more tasks for a selected project. You cannot perform Update Multiple Tasks, Mast Task Update or Mass Progress Update if tasks are selected from different projects.

  • Resource Breakdown Structure - you can view the Project Name, Resource Name, Outline Number, Project Number, At Completion Approved Revenue, and At Completion Approved Cost. Revenue/Budget/Forecast/ EVM amount/values are also displayed. Click any of the links to refine your search results further using that value. You can Print, and Export the search results from the Actions menu. You can also use the Actions menu to Compare by selecting two or more rows.

  • Cost Breakdown Structure - you can view the Project Name, Project Number, Cost Code Name, Cost Code, Outline Number, Planned Quantity, Actual Quantity, Planned Cost, Actual Cost, Planned Revenue. Actual Revenue, Primary Cost Forecast, and Primary Revenue Forecast. Click any of the links to refine your search results further using that value. You can Print, and Export the search results from the Actions menu. You can also use the Actions menu to Compare by selecting two or more rows.

Cash Flow and Change Management Displays the following tabs:
  • Cash Flow - you can view the Project Name, Project Number, Period, Cash Inflow, and Cash Position. Click any of the links to refine your search results further using that value. You can Print, and Export the search results from the Actions menu.

  • Customer Invoices - choose between the Summary or Details options from the list of values.

    • Summary list option - you can view the Project Name, Customer Name, ITD Invoiced Amount, Current Period Invoice Amount, ITD Receipt Amount, Current Period Receipt Amount, ITD Outstanding Amount, Retention Amount, Last Invoice Number, Last AR Invoice Number, and Last Invoice Date. Click any of the links to refine your search results further using that value. You can Print, and Export the search results from the Actions menu. You can also use the Actions menu to Compare by selecting two or more rows.

    • Details list option - you can view the Project Name, Customer Name, Draft Invoice Number, AR Invoice Number, Draft Invoice Date, Invoice Amount, Receipt Amount, Outstanding Amount, Past Due Draft Invoices, AR Invoice Status, and Draft Invoice Status. Click any of the links to refine your search results further using that value. You can Print, and Export the search results from the Actions menu. You can also use the Actions menu to Compare by selecting two or more rows.

  • Supplier Invoices - choose between Summary, Details or Actions options from the list of values.

    • Summary list option - you can view the Project Number, Supplier Number, Supplier Name, ITD Invoiced Amount, Current Period Invoice Amount, ITD Paid Amount, Current Period Paid Amount, ITD On Hold Amount, ITD Retained Amount, ITD Outstanding Amount, ITD Discount Amount. Click any of the links to refine your search results further using that value. You can Print, and Export the search results from the Actions menu. You can also use the Actions menu to Compare by selecting two or more rows.

    • Details list option - you can view the Project Number, Supplier Number, Supplier Name, Task Number, Invoice Number, Order Number, Invoice Amount, Supplier Invoice Date, Paid Amount, Last Payment Date, Payment Hold, Payment Hold Reason, Invoice Hold, Invoice Hold Reason, and Past Due Vendor Payments. Click any of the links to refine your search results further using that value. You can Print, and Export the search results from the Actions menu. You can also use the Actions menu to Compare by selecting two or more rows.

    • Actions list option - you can view the Project Number, Supplier Number, Supplier Name, Invoice Number, and Order Number. Click any of the links to refine your search results further using that value. Click Apply/Release Holds to navigate to the Search Supplier Invoices page. Click View PO Deliverables to navigate to the PO Deliverables page. Click Create Deduction to navigate to the Deduction page. You can Print, and Export the search results from the Actions menu. You can also use the Actions menu to Compare by selecting two or more rows.

  • Purchase Orders - choose between Details and Actions options from the list of values.

    • Details list option - you can view the Project Number, PO Number, Item Description, Task Name, Task Number, Order Status, Supplier Name, Supplier Number, Need By Date, Invoice Number, Promised Date, Total Amount, Item Category, Item Name, Unit Price, Currency, Unit of Measure, Ordered Quantity, Received Quantity, and Invoiced Quantity. Click any of the links to refine your search results further using that value. You can Print, and Export the search results from the Actions menu. You can also use the Actions menu to Compare by selecting two or more rows.

    • Actions list option - you can view the Project Number and PO Number, Item Description, Task Name, and Task Number. Click any of the links to refine your search results further using that value. Click the View PO Deliverable link to navigate to the PO Deliverables page. You can Print, and Export the search results from the Actions menu. You can also use the Actions menu to Compare by selecting two or more rows.

  • Issues - choose from the Overview or Actions options from the list of values.

    • Overview list option - you can view the Project Name, Project Number, Name, Summary, Resolution, Task Number, Owner, Priority, Progress Status, Open Actions, Status, Days Until Due, and Days Since Updated. Click any of the links to refine your search results further using that value. You can Print, and Export the search results from the Actions menu. You can also use the Actions menu to Compare by selecting two or more rows.

    • Actions list option - you can view the Project Name, Project Number, and Name. Click any of the links to refine your search results further using that value. Click View Issue to navigate to the Issues page. Click Convert to Change Request to navigate to the Change Request page. Click Convert to Change Order to navigate to the Change Order page. You can Print, and Export the search results from the Actions menu. You can also use the Actions menu to Compare by selecting two or more rows.

  • Change Requests - choose between the Overview and Actions options from the list of values.

    • Overview list option - you can view the Project Name, Project Number, Name, Summary, Resolution, Task Number, Owner, Priority, Days since Updated, Open Actions, Cost, Revenue, Margin%, Status, Progress Status and Days Until Due. Click any of the links to refine your search results further using that value. You can Print, and Export the search results from the Actions menu. You can also use the Actions menu to Compare by selecting two or more rows.

    • Actions list option - you can view the Project Name, Project Number, and Name. Click any of the links to refine your search results further using that value. Click View Change Request to navigate to the Change Request page. Click Convert to Change Order to navigate to the Change Order page. Click Include Impact to navigate to the Impact page. You can Print, and Export the search results from the Actions menu. You can also use the Actions menu to Compare by selecting two or more rows.

  • Change Orders - choose between the Overview and Actions options from the list of values.

    • Overview list option - you can view the Project Name, Project Number, Name, Summary, Resolution, Task Number, Owner, Priority, Progress Status, and Days Until Due. Click any of the links to refine your search results further using that value. You can Print, and Export the search results from the Actions menu. You can also use the Actions menu to Compare by selecting two or more rows.

    • Actions list option - you can view the Project Name, Project Number, and Name. Click any of the links to refine your search results further using that value. Click Change Order Details to go to the Change Order Details page. Click Convert to Change Request to navigate to the Change Request page. Click Implement Impact to navigate to the Impact page. You can Print, and Export the search results from the Actions menu. You can also use the Actions menu to Compare by selecting two or more rows.

Workplan Overview Page

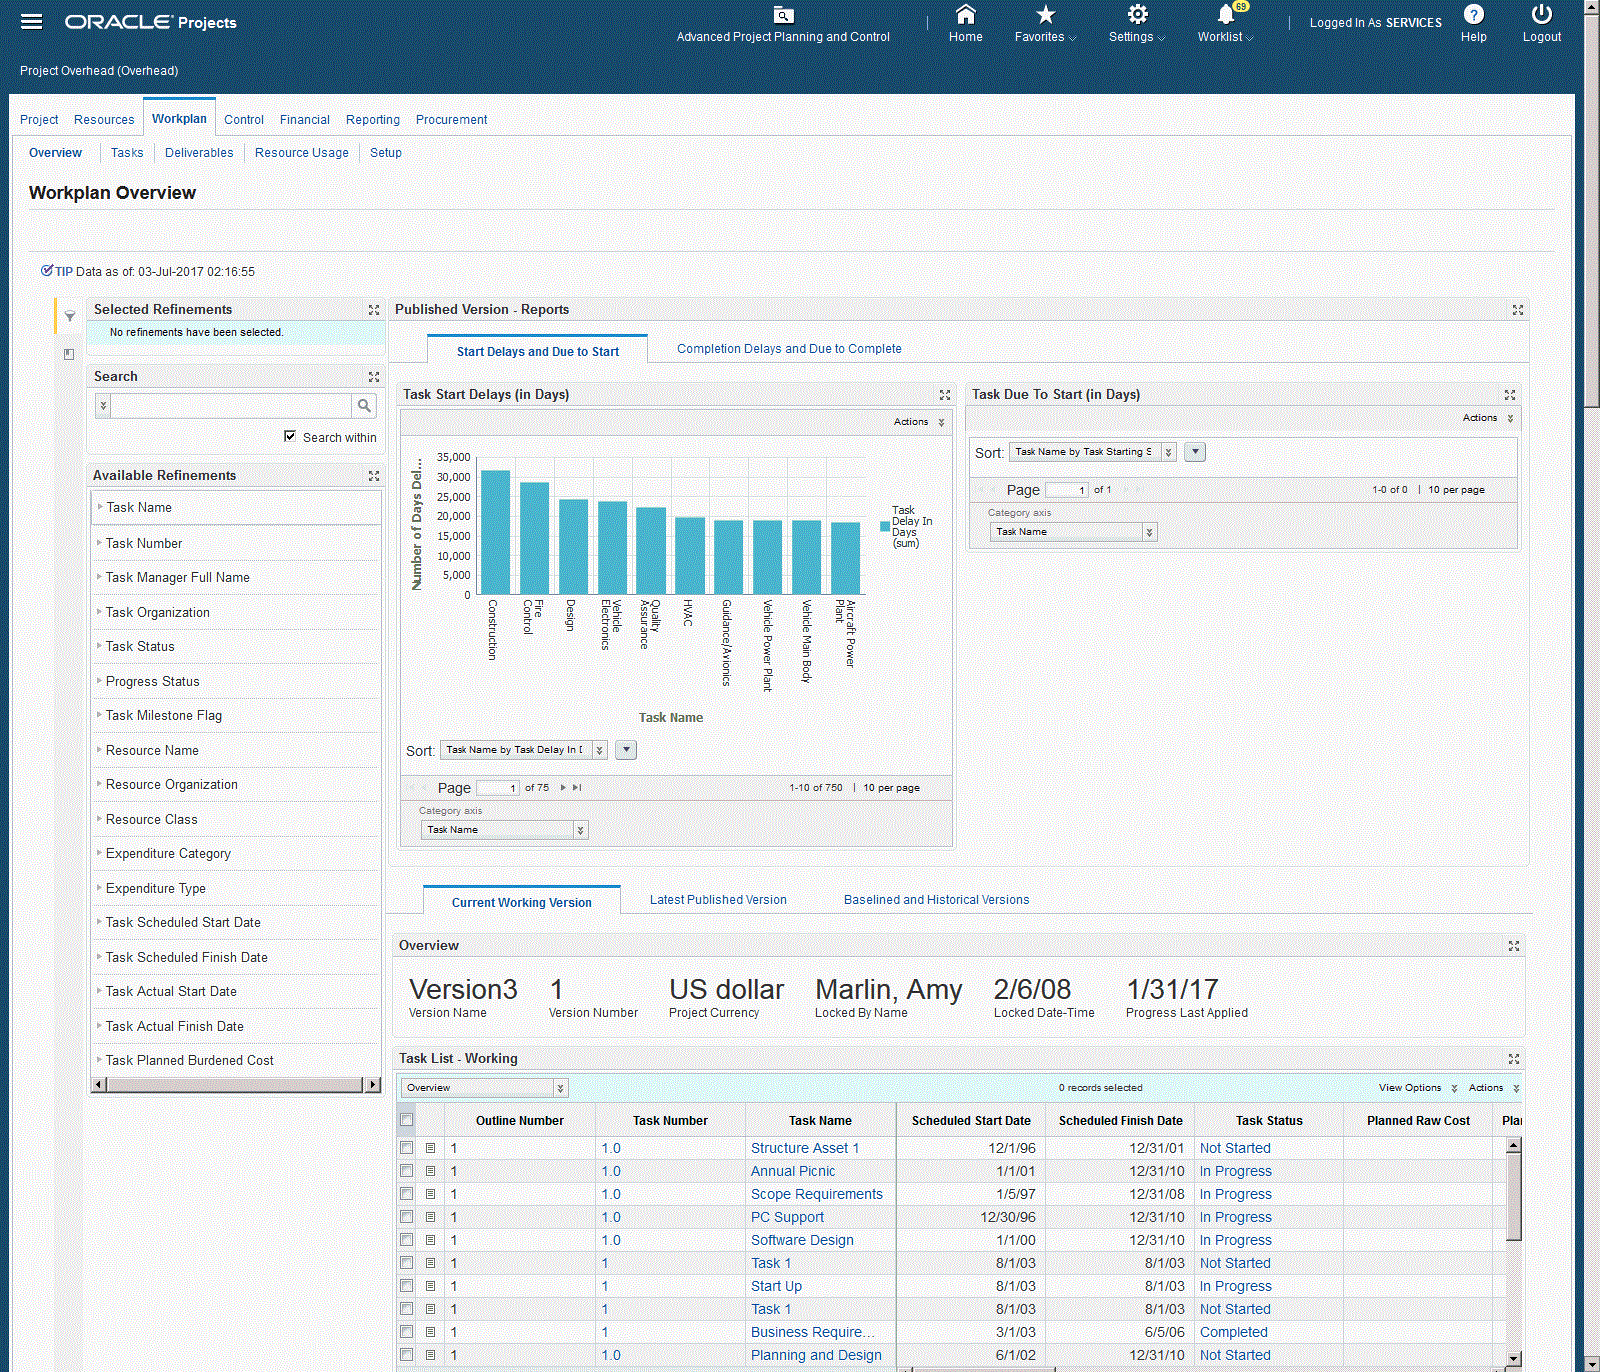
The Workplan Overview page displays financial metrics and task for a specific project. The components of the Workplan Overview page are:

The Workplan Overview page contains filtering components that you can use to search, navigate and filter the data displayed in other components and consists of the following regions and components:

The following graphic displays the Workplan Overview page. There are a couple of ways to access the Workplan Overview page.
the picture is described in the document text

Region Components
Tip This displays the date and time stamp of the last ETL update.
Search
  • Search Within

The Advanced Search component includes value search, record search, and partial search capabilities. You can submit keyword searches and the application provides type-ahead suggestions and displays attribute values that match the typed text. When you perform a search, the search term is added to the Selected Refinements component. As you type, you may be prompted to select a matching attribute value, or simply search for the entered text.

Additional Information: See the Advanced Search Capabilities appendix in this guide for details.


Partial record search is enabled for specific attributes. Attributes for partial record search include:
  • Bill Group

  • Customer

  • Task Name

  • Task Number

  • Task Manager

  • Resource Name

  • Resource Class

  • Employee Name

  • Supplier Name

  • PO Number

  • Receipt Number

  • Organization

  • Task ID

  • Invoice Number

Selected Refinements The Selected Refinements component displays all values that you have selected to filter data, and allows you to quickly make adjustments to the current refinement by removing items or clearing all filters from the list.
Bookmarks The Bookmarks component allows you to save a given navigation and component state and return to it at a later time.
Available Refinements The Available Refinements component allows you to filter data based on the currently available values or value ranges for selected attributes that are displayed within attribute groups. Expand the following attribute groups to view and select attribute names:
  • Task Name

  • Task Number

  • Task Organization

  • Task Status

  • Task Milestone Flag

  • Resource Name

  • Resource Organization

  • Resource Class

  • Task Scheduled Start Date

  • Task Scheduled Finish Date

  • Task Actual Start Date

Alerts You can use alerts to direct you attention to any potential issues or risks that might arise on the project or task. There is one configurable alert:
  • Late Tasks

Published Versions - Reports
  • Start Delays and Due to Start tab:

    • Task Start Delays (in Days) - This report displays tasks and the number of days the tasks has been delayed. You can sort the Series Dimension by Task Name or Task Name by Number of Days Delayed (sum).

    • Task Due to Start (in Days) - This report displays the tasks and the number of days before the task start date. You can sort the Series Dimension by Task Name or Task Name by Number of Days to Start (sum).

  • Completion Delays and Due to Complete tab:

    • Task Completion Delays (in Days) - This report displays the task and the number of days the task has been delayed past its completion date. You can sort the Series Dimension by Task Name or Task Name by Task Completion Delay in Days (sum).

    • Task Due to Complete (in Days) - This report displays the task and the number of days the task is due to be complete. You can sort the Series Dimension by Task Number and Task Name by Task Completion Due in Days (sum).

You can also print or export these task details.
Current Working Version Tab
  • Overview - this tag cloud displayed the Version Name, Version Number, Project Currency, Locked by Name, Locked Date-Time, and Progress Last Applied.

The Task List - Working and Resources List - Working tables display the following details:
Task List - Working:
  • Overview

    • Outline Number

    • Task Number

    • Task Name

    • Scheduled Start Time

    • Scheduled Finish Time

    • Task Status

    • Raw Cost Planned

    • Burdened Cost Planned

    • Task Manager Full Name

    • Task Organization

    • Task Milestone Flag

    • Progress Status

    • Critical Flag

    • Task Priority

    • Display Sequence

    • SOV LIne Number

    • Activity Resource Requirement

  • Actions

    • Outline Number

    • Task Number

    • Task Name

    • Task Details - click this to navigate to the Task Details page

    • Additional Information - click this to navigate to the Update Additional Task Information page


Resource List - Working
  • Task Name

  • Resource Name

  • Full Name

  • Resource Organization

  • Planned Hours

  • Planned Raw Cost

  • Planned Burdened Cost

  • Resource Class

  • Unit of Measure

  • Forecast ETC Basis

  • Expenditure Type

  • Expenditure Category


Table View Options include:
  • Conditional Formatting

  • Hide/Show Columns

  • Sort

  • Reset table to default


Table Actions include:
  • Print

  • Update Multiple Tasks (available only from Task List - Working table) - Use to make updates for the tasks on the selected tasks. The updates are carried through to all the selected task in a single update on the current working version.

    Note: For SOV, you cannot delete task assignment and you cannot make updates to all task assignments.

  • Mass Tasks Update (available only from Task List - Working table) - Use to make updates for tasks on an updateable table where user can enter different values for each of the selected tasks on the current working version.

  • Export

Latest Published Version Tab
  • Overview

    • Version Name

    • Version Number

    • Published Date-Time

    • Published By

    • Project Currency

    • Late Tasks

  • Financial Overview

    • Raw Cost Variance

    • Burdened Cost Variance

    • ITD Actual Raw Cost

    • ITD Actual Burdened Cost

The Task List - Latest Published and Resources List - Latest Published tables display the following details:
Task List - Latest Published:
  • Overview

    • Outline Number

    • Task Number

    • Task Name

    • Scheduled Start Time

    • Scheduled Finish Time

    • Task Status

    • Planned Raw Cost

    • Planned Burdened Cost

    • Task Manager Full Name

    • Task Organization

    • Task Milestone Flag

    • Critical Flag

    • Task Priority

    • Progress Status

    • Display Sequence

    • SOV Line Number

    • Acticity Resource Requirement

  • Actions

    • Outline Number

    • Task Number

    • Task Name

    • Additional Information - click this to navigate to the Update Additional Task Information page


Resource List - Latest Published
  • Task Name

  • Resource Name

  • Full Name

  • Resource Organization

  • Planned Hours

  • Planned Raw Cost

  • Planned Burdened Cost

  • Resource Class

  • Unit of Measure

  • Forecast ETC Basis

  • Spread Curve

  • Expenditure Type

  • Expenditure Category


Table View Options include:
  • Conditional Formatting

  • Hide/Show Columns

  • Sort

  • Reset table to default


Table Actions include:
  • Print

  • Export

  • Mass Update Progress (available only from Task List - Latest Published table) - Use to make updates for the tasks on an updateable table where you can enter different values for each selected tasks on the latest published version.

Baselined and Historical Versions Tab Overview:
  • Version Name

  • Version Number

  • Published Date-Time

  • Published By

  • Project Currency


The Task List - Baseline, Resources List - Baseline, and Other Versions tables display the following details:
Task List - Baseline:
  • Outline Number

  • Task Number

  • Task Name

  • Scheduled Start Date

  • Scheduled Finish Date

  • Task Status

  • Planned Raw Cost

  • Planned Burdened Cost

  • Task Manager Full Name

  • Task Organization

  • Task Milestone Flag

  • Critical Flag

  • Task Priority

  • Progress Status

  • Display Sequence

  • SOV Line Number

  • Activity Resource Requirement


Resource List - Baseline:
  • Task Name

  • Resource Name

  • Full Name

  • Resource Organization

  • Planned Hours

  • Planned Raw Cost

  • Planned Burdened Cost

  • Resource Class

  • Unit of Measure

  • Spread Curve

  • Forecast ETC Basis

  • Expenditure Category


Other Versions
  • Version Name

  • Published By

  • Planned Raw Cost

  • Actual Raw Cost

  • Planned Burdened Cost

  • Actual Burdened Cost


Table View Options include:
  • Conditional Formatting

  • Hide/Show Columns

  • Sort

  • Reset table to default


Table Actions include:
  • Print

  • Export

Financial Overview Page

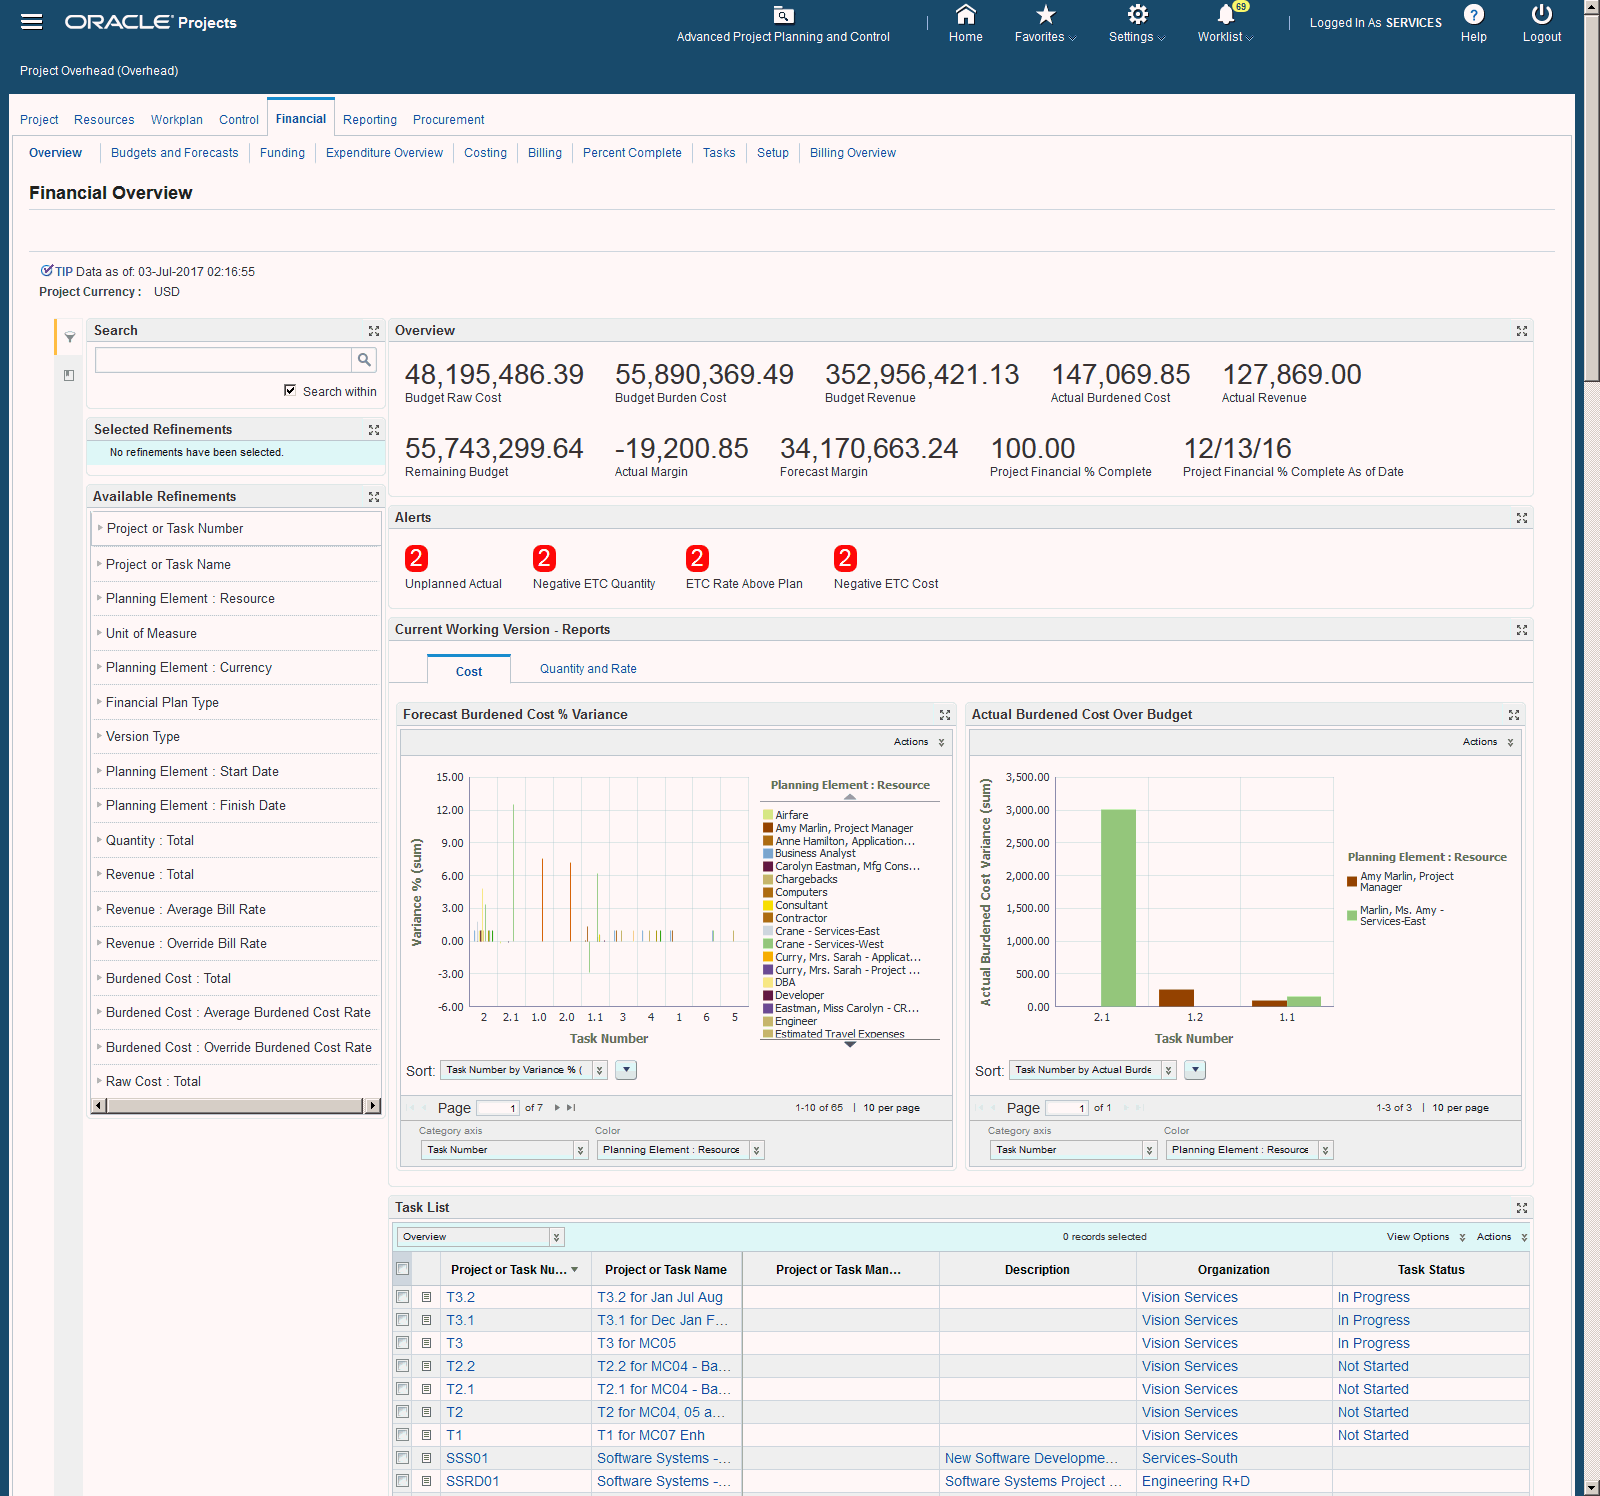
The Financial Overview page displays financial metrics and task status information for a specific project. The components of the Financial Overview page are:

The Financial Overview page will display values for the project only under the following conditions:

If the project does not meet the above criteria, then the application displays an information message in the page header, stating: The project you have selected does not meet the conditions required and cannot be displayed on the Financial Overview page. To view or modify a financial plan for budgets and forecasts, use the Maintain Versions page.

The following graphic displays the Financial Overview page.
the picture is described in the document text

From the Advanced Project Planning and Control page, click the Financial link in the Project Details actions region to access the Financial Overview page.

The Financial Overview page contains filtering components that you can use to search, navigate and filter the data displayed in other components and consists of the following regions and components:

Region Components
Tip This displays the date and time stamp of the last ETL update.
Search
  • Search Within

The Advanced Search component includes value search, record search, and partial search capabilities. You can submit keyword searches and the application provides type-ahead suggestions and displays attribute values that match the typed text. When you perform a search, the search term is added to the Selected Refinements component. As you type, you may be prompted to select a matching attribute value, or simply search for the entered text.

Additional Information: See the Advanced Search Capabilities appendix in this guide for details.


Partial record search is enabled for specific attributes. Attributes for partial record search include:
  • Bill Group

  • Customer

  • Task Name

  • Task Number

  • Task Manager

  • Resource Name

  • Resource Class

  • Employee Name

  • Supplier Name

  • PO Number

  • Receipt Number

  • Organization

  • Task ID

  • Invoice Number

Selected Refinements The Selected Refinements component displays all values that you have selected to filter data, and allows you to quickly make adjustments to the current refinement by removing items or clearing all filters from the list.
Bookmarks The Bookmarks component allows you to save a given navigation and component state and return to it at a later time.
Available Refinements The Available Refinements component allows you to filter data based on the currently available values or value ranges for selected attributes that are displayed within attribute groups. Expand the attribute groups to view and select attribute names.
Alerts You can use alerts to direct you attention to any potential issues or risks that might arise on the project or task. There are configurable alerts:
  • Unplanned Actuals - Alert displays task with no current planned quantity or amount, yet there are actual costs against the task.

  • ETC Rate Above Plan - Alert displays tasks where the ETC Raw Cost rate is greater than the Current Budget Average Raw Cost rate.

  • Negative ETC Quantity - Alert displays tasks where there is a negative ETC quantity or cost.

Overview
  • Budget Raw Cost

  • Budget Burdened Cost

  • Budget Revenue

  • Actual Burdened Cost

  • Actual Revenue

  • Remaining Budget

  • Actual Margin

  • Forecast Margin

    Note: For Actual Margin and Forecast Margin positive margin is displayed in green, zero margin is displayed in yellow and negative margin is displayed in red.

  • Project Financial % Complete

  • Project Financial % Completion As of Date

Current Working Version - Reports Cost tab
  • Forecast Burdened Cost % Variance - you can sort by Task Number and Task Number by Variance % (average)

  • Actual Burdened Cost Over Budget - you can sort by Task Number and Task Number by Actual Burdened Cost Variance (sum)


Quantity and Rate
  • Forecast Effort Variance - you can sort by Task Number and Task Number by Forecast Effort Variance (sum)

  • ETC Raw Cost Rate % Variance - you can sort by Task Number and Task Number by ETC Raw Cost Rate % Variance (average)

Task List Overview
  • Task Number

  • Task Name

  • Task Manager

  • Description

  • Organization

  • Task Status


Details
  • Task Number

  • Task Name

  • Task Manager

  • Transaction Start

  • Transaction Finish

  • Work Type

  • ETC Source

  • Receive Inter-Project Invoices

  • Billable Flag

  • Chargeable Flag

  • Capitalize Flag

  • Task Type

  • Service Type


Actions
  • Task Number

  • Task Name

  • Task Manager

  • Expenditures - click this to navigate to the Expenditure Overview page

  • Issues - click this to navigate to the Issues page

  • Change Requests - click this to navigate to the Change Requests page

  • Change Orders - click this to navigate to the Change Orders page

  • Update Plans - click this to navigate to the Update Multiple Financial Plans page. You use this to make updates for the tasks on the financial plan.

  • Add Resource Assignment – User to add resource assignment to the financial plan.

    Note: If you choose an SOV enabled project, then Approved Cost budget, Primary Cost Forecast are not displayed in the Plan Types Table in this page.

Plan Lines Overview
  • Task Name

  • Financial Plan Type

  • Planning Element: Resource

  • Version Type

  • Version Name

  • Planning Element: UOM

  • Planning Element: Currency

  • Planning Element: Start Date

  • Planning Element: Finish Date


Quantity
  • Task Name

  • Financial Plan Type

  • Planning Element: Resource

  • Version Type

  • Quantity: Total

  • Quantity: Current Budget

  • Quantity: Actual

  • Quantity: ETC

  • Quantity: Forecast


Raw Cost
  • Task Name

  • Financial Plan Type

  • Planning Element: Resource

  • Version Type

  • Raw Cost: Total

  • Raw Cost: Current Budget

  • Raw Cost: Override Raw Cost

  • Raw Cost: ETC

  • Raw Cost: Forecast

  • Spread Curve


Burdened Cost
  • Task Name

  • Financial Plan Type

  • Planning Element: Resource

  • Version Type

  • Burdened Cost: Total

  • Burdened Cost: Current Budget

  • Burdened Cost: Override Burdened Cost Rate

  • Burdened Cost: Actual

  • Burdened Cost: ETC

  • Burdened Cost: Forecast


Revenue

Note: This column set is not displayed if you choose an SOV Project.

  • Task Name

  • Financial Plan Type

  • Planning Element: Resource

  • Version Type

  • Revenue: Total

  • Revenue: Current Budget

  • Revenue: Actual

  • Revenue: Average Bill Rate

  • Revenue: ETC

  • Revenue: Forecast

  • Revenue: ETC Bill Rate

  • Revenue: Override Bill Rate

  • Revenue: Variance (%) Current Budget


Margin

Note: This column set is not displayed if you choose an SOV Project.

  • Task Name

  • Financial Plan Type

  • Planning Element: Resource

  • Version Type

  • Margin: Budget

  • Margin: Current Budget

  • Margin (%): Current Budget

  • Margin: Actual

  • Margin (%): Actual

  • Margin: Forecast

  • Margin (%): Forecast

  • Margin (%): Variance : Current Budget

  • Margin (%): Variance : Original Budget


Actions
  • Task Name

  • Financial Plan Type

  • Planning Element: Resource

  • Version Type

  • Update Plan Line Details - click this to navigate to the Edit Budget Line: Approved Budget window.


You can also Print or Export the results of the table.

Expenditure Overview Page

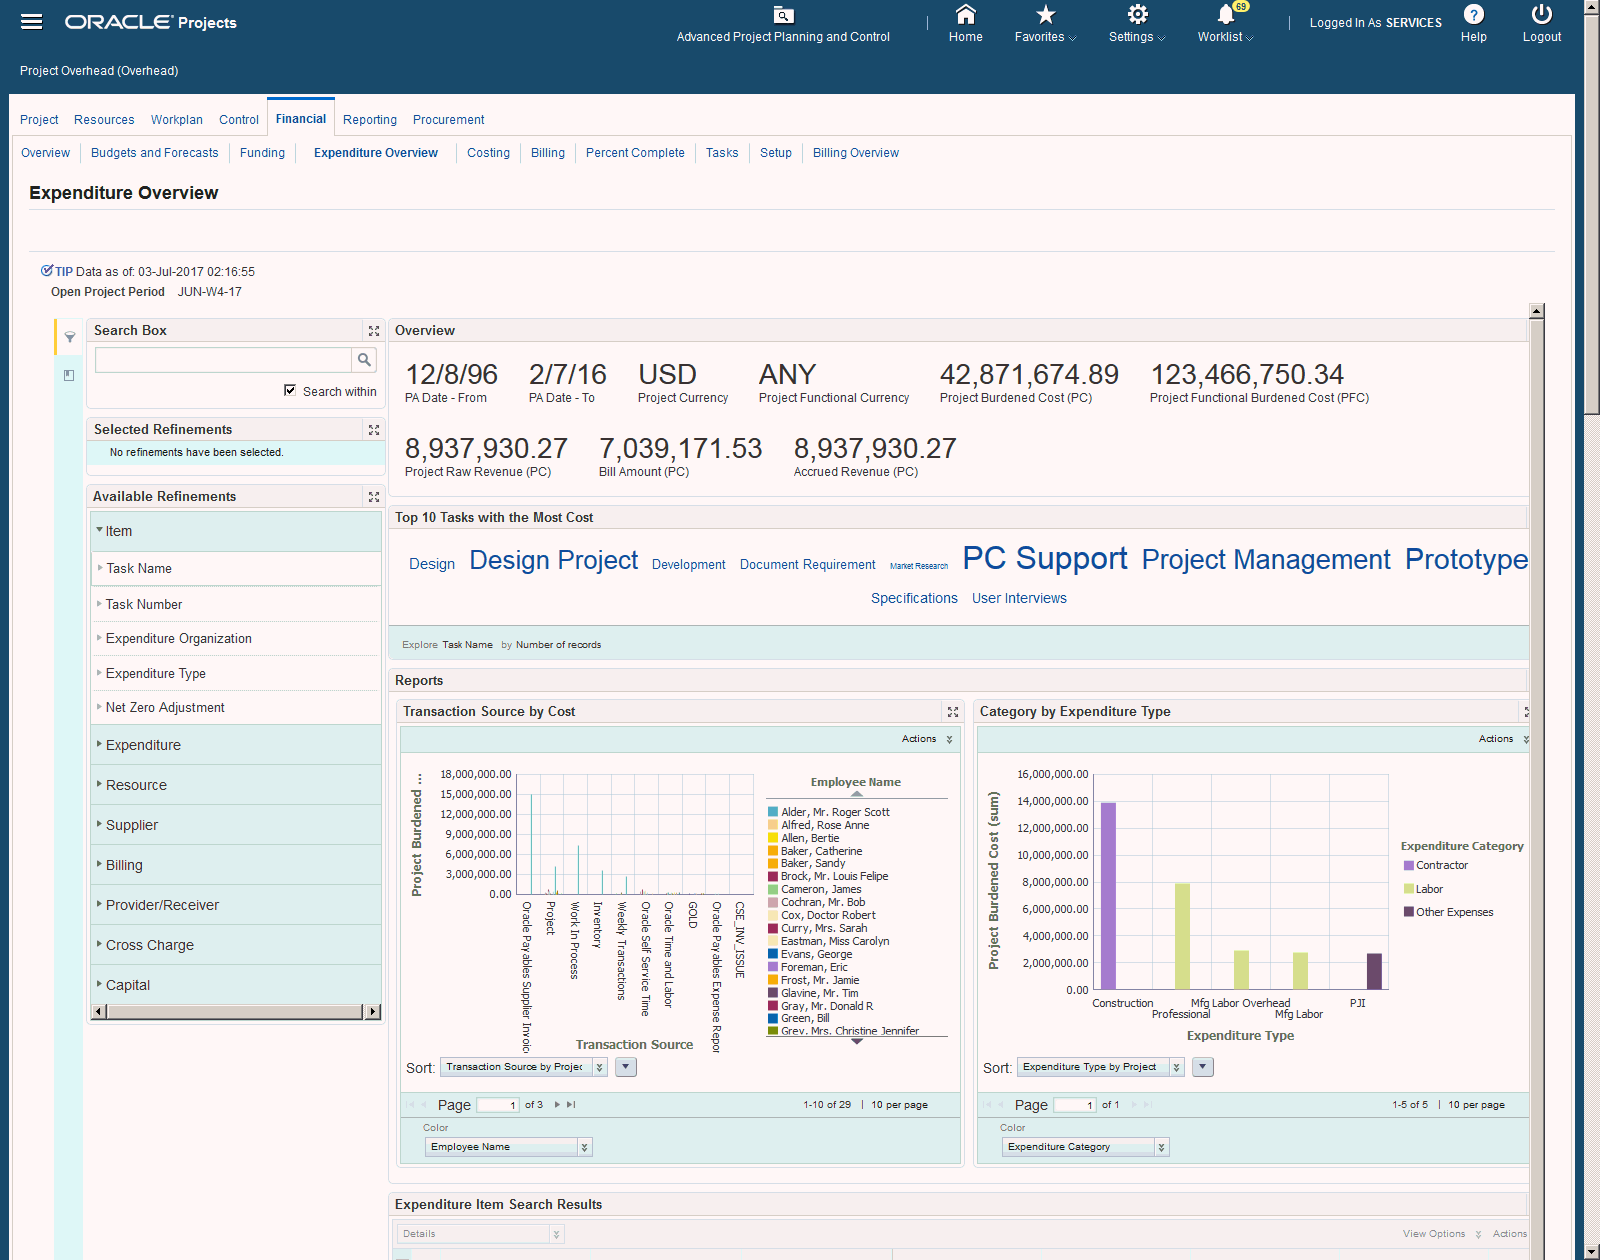
The Endeca Expenditure Overview page displays expense related information on an expense item. The components of the Expenditure Overview page are:

The following graphic displays the Expenditure Overview page.
the picture is described in the document text

From the Advanced Project Planning and Control page, click the Expenditures link in the Project Details actions region, to access the Expenditure Overview page.

Region Components
Tip Displays the date on which the data was last refreshed.
Search
  • Search Within

The Advanced Search component includes value search, record search, and partial search capabilities. You can submit keyword searches and the application provides type-ahead suggestions and displays attribute values that match the typed text. When you perform a search, the search term is added to the Selected Refinements component. As you type, you may be prompted to select a matching attribute value, or simply search for the entered text.

Additional Information: See the Advanced Search Capabilities appendix in this guide for details.


Partial record search is enabled for specific attributes. Attributes for partial record search include:
  • Customer

  • Task Name

  • Task Number

  • Task Manager

  • Resource Name

  • Resource Class

  • Employee Name

  • Supplier Name

  • PO Number

  • Receipt Number

  • Organization

  • Task ID

  • Invoice Number

Selected Refinements The Selected Refinements component displays all values that you have selected to filter data, and allows you to quickly make adjustments to the current refinement by removing items or clearing all filters from the list.
Bookmarks The Bookmarks component allows you to save a given navigation and component state and return to it at a later time.
Available Refinements The Available Refinements component allows you to filter data based on the currently available values or value ranges for selected attributes that are displayed within attribute groups. Expand the attribute groups to view and select attribute names.
Overview
  • PA Date - From

  • PA Date - To

  • Project Currency

  • Project Functional Currency

  • Project Burdened Cost (PC)

  • Project Functional Burdened Cost (PFC)

  • Project Raw Revenue (PC)

  • Adjusted Revenue (PC)

  • Bill Amount (PC)

  • Accrued Revenue (PC)

Top 10 with the Most Cost Displays the top 10 Transaction Source by Project Burdened Cost (cost incurred) and Expenditure Type by Category.
Reports
  • Transaction Source by Cost - you can sort the data by Transaction Source and Transaction Source by Project Burdened Cost (sum)

  • Category by Expenditure Type - you can sort the data by Expenditure Type and Expenditure Type by Project Burdened Cost (sum)

Expenditure Item Search Results Column Sets:
  • Details

  • Accounting

  • Billing

  • Burden

  • Capital

  • Cross Charge

  • Expenditure

  • Provider

  • Receiver

  • Resource

  • Supplier


The details you can view include:
  • Trans ID

  • Task Number

  • Task Name

  • Expenditure Org

  • Expenditure Type

  • Expenditure Category

  • Employee/Supplier

  • Item Date

  • Quantity

  • UOM

  • Bill Amount

  • Project Functional Burdened Cost

  • Project Burdened Cost.

  • Burden Distributed

  • Cost Burdened

  • Cost Distribution Rejection

  • Cost Distributed

  • Cost Job

  • Billed Amount

  • Billed

  • Billable

  • Burdened Cost Rate

  • Burden Distribution Rejection

  • Capital Event Number

  • Capitalizable

  • Borrowed and Lent Distributed

  • Cross Charge Processing Method

  • Adjusted Revenue

  • Adjusting Item

  • Provider Operating Unit

  • Provider Org Name

  • Receiver Operating Unit

  • Receiver Org Name

  • Employee Name

  • Employee Number

  • Supplier Name

  • Supplier Number, and so on.

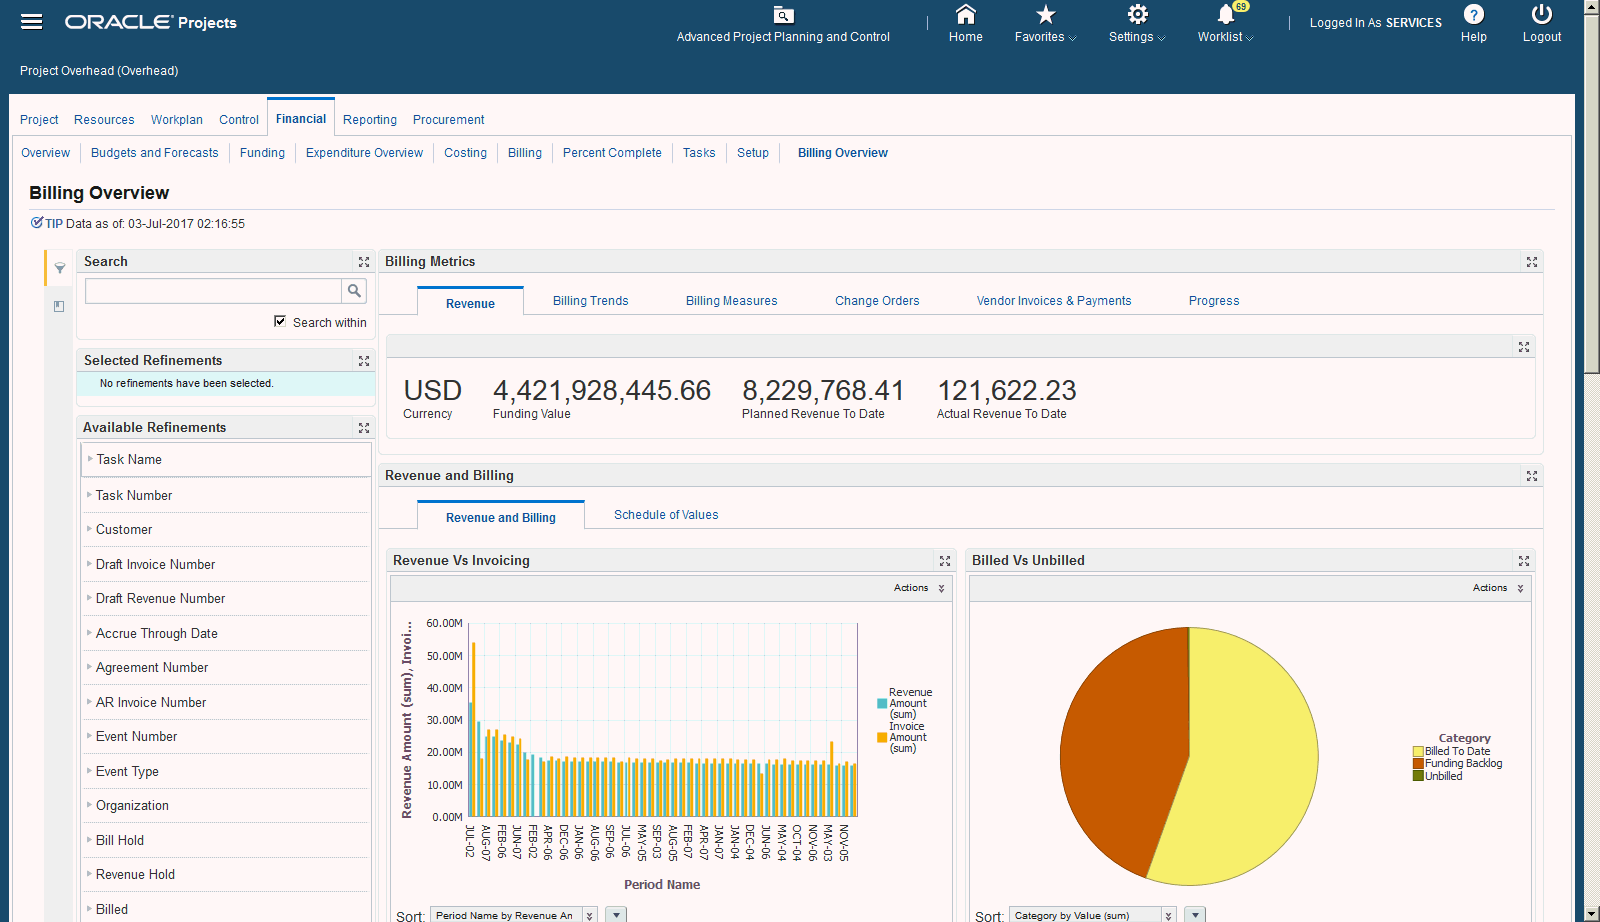
Billing Overview Page

The Billing Overview page displays billing information for the project. The components of the Billing Overview page are:

The following graphic displays the Billing Overview page. To access the Billing Overview page, from the Advanced Project Planning and Control page, click the Billing link in the Project Details actions region.
the picture is described in the document text

Region Components
Tip Displays date on which data was last refreshed.
Search
  • Search Within

The Advanced Search component includes value search, record search, and partial search capabilities. You can submit keyword searches and the application provides type-ahead suggestions and displays attribute values that match the typed text. When you perform a search, the search term is added to the Selected Refinements component. As you type, you may be prompted to select a matching attribute value, or simply search for the entered text.

Additional Information: See the Advanced Search Capabilities appendix in this guide for details.


Partial record search is enabled for specific attributes. Attributes for partial record search include:
  • Bill Group

  • Customer

  • Employee Name

  • Task Manager

  • Task Number

  • Task Name

  • Invoice Number

  • Organization

  • PO Number

  • Receipt Number

  • Resource Name

  • Resource Class

  • Supplier Name

Selected Refinements The Selected Refinements component displays all values that you have selected to filter data, and allows you to quickly make adjustments to the current refinement by removing items or clearing all filters from the list.
Bookmarks The Bookmarks component allows you to save a given navigation and component state and return to it at a later time.
Available Refinements The Available Refinements component allows you to filter data based on the currently available values or value ranges for selected attributes that are displayed within attribute groups. Expand the following attribute groups to view and select attribute names:
  • Task Name

  • Task Number

Billing Metrics Displays the following details:
  • Revenue tab - displays the following details:

    • Currency - Displays Project Functional currency you use to record transactions and maintain accounting data for your ledger. In cross-charge transactions, the functional currency, as defined in the ledger is the currency associated with a project transaction. In this context the currency displayed is applicable for all the metrics related to amount.

    • Funding Value - Funding is the step that allocates an amount associated with a customer agreement to a specific project. The total amount of allocated project funding is the funding value and it must be equal the current approved project revenue budget amount in order to successfully baseline the project. For SOV projects, this is the SOV Header Amount in Project Functional Currency.

    • Planned Revenue To Date - displays the revenue that is planned to be achieved from inception to-date. For SOV enabled projects, this value comes from SOV lines.

    • Actual Revenue To Date - displays the revenue that is achieved or recorded from inception to-date. For SOV projects, the SOV progress till date is Actual Revenue to Date.

  • Billing Trends tab - displays the following details:

    • Billable/Non Billable Ratio - displays the ratio of the cost spent on Billable tasks to Non Billable tasks. A low ratio could signify decreasing profitability. Only work-based events are considered to calculate this. This is not available for SOV projects.

    • Billed /Unbilled Ratio - this ratio is in context of the billable amount. The ratio is between the billed amount and the unbilled amount (unbilled billable amount). Only work-based events are considered to calculate this. This is not available for SOV projects.

    • Original Funding Vs Increase Ratio - this is the ratio between the initial and the modified funding amount. Modified funding amount is the resultant of change orders. Ratio is calculated between Current Funding Amount and Original funding Amount.

    • Billing Cycle - this is the schedule of recurrent times in any regular system of preparing or sending bills. It is measured in terms of days. It is generally number of days between the previous bill generation to the next bill generation.

    • Average Lead Time-Cut off to Submission - displays the average number of days from the billing cutoff date to the date invoices is submitted to the client.

    • Average Lead time -Invoice to cash - displays the average number of days from the date, invoices are submitted to the date client has released the payment.

  • Billing Measures tab - displays the following details:

    • Total Invoice Value to Date - displays the amount invoiced till date from inception is reported in this metric. This metric does not consider invoices in Draft status. Only invoices accepted in receivables are considered.

    • Accuracy Index - The billing accuracy index is measured based on absolute number of adjustments and corrections. To calculate the billing accuracy, divide the number of correct bills by the total number of bills. Accuracy Index is equal to the Total Invoice value to date minus the Past Due invoice value plus the Hold/Reject value divided by the Total Invoice value to date.

    • Bill Hold Value - displays the total value of any billable items that are not accepted by the client (which are kept under bill hold or rejected from the invoice). These values are taken from the credit memo issued. This is not available for SOV projects.

    • Past due Invoice Value - displays the cumulative value of the invoices which are past due to the payment date is presented in this metric. The criteria to arrive at the metric is due date on the invoice should be less than the system date.

    • Average Lead time -Invoice to cash - displays the average number of days from the date, invoices are submitted to the date client has released the payment.

  • Change Orders tab - displays the following details:

    • Change Orders Approved - displays the total value of the approved change orders ITD.

    • Change Orders Pending Approval - displays the total value of change orders which are Pending Approval status till date.

    • Change Orders Pending Implementation - displays the total amount of approved change orders which are not yet implemented is provided by this metric.

    • Open Change Orders - displays the total value of change orders which are in open status till date.

    • Change Orders Success Ratio - displays the ratio between the total amounts of approved change orders to the total amount of all change orders raised. It is calculated as the Total amount of approved change orders divided by the Total amount of all change orders.

  • Vendor Invoices and Payments tab - displays the following details:

    • Vendor Invoices To-Date - displays the sum total of the amounts pertaining to all vendor invoices till date.

    • Non Billable Supplier Invoices - displays the total value of supplier invoices against non billable items / tasks.This is not displayed for SOV projects.

    • Vendor Invoice Vs Client Billing - displays the ratio between the vendor's invoice amount ITD to the client invoice amount ITD is mentioned in this metric. It is calculated as Vendor Invoice amount ITD divided by the Client invoice amount ITD.

    • Vendor Payment Index - presents us with the efficiency of our paying cycle to the vendor, based on the payments made by due date. It is calculated as dividing Total past due amount/Total Invoice amount. Where, Past Due amount = If Invoice due date is lesser than system date, then (Total Invoice Amount – Total amount paid).

    • Vendor Payments due this Period - displays the total amount of vendor invoices that are due in the current GL period.

    • Vendor Payments Past Due - displays the total value of vendor invoices that are not paid as per the committed payment due date. Reference to Past Due vendor payments is in accordance with current system date.

  • Progress tab - displays the following details:

    • Progress on Expenditures - displays an insight of the potential revenue that can be incurred from the expenditures. It is the sum total of billable and unbilled billable amount. Only work- based events are considered to calculate this. This is not displayed for SOV projects.

    • Work in Progress (Unbilled) - displays the Work in Progress that is the expenditure charged but not billed due various reasons. Only work-based events are considered to calculate this. For SOV projects, Work in Progress is calculated as Total Progressed Amount - Total Billed Amount.

    • Progress Reported Till-Date - displays the progress /quantity of work completed against all tasks/SOV lines till date.

Revenue and Billing Displays the following details:
  • Revenue vs. Invoicing - is a bar chart that displays periodic revenue and the invoicing trends across the periods. The graph is depicted with time period in months on X-axis and Amount on Y –Axis. The chart contains dual Y axis to accommodate monthly values and the cumulative values as well. Bars represent monthly values and the lines represent Cumulative values.

  • Billed vs Unbilled - displays a pie chart that explains how much amount is billed and unbilled (expenditures already booked / progress made but not billed) vs. the balance billing amount. The total circle represents the funding value and each pie represents Billed, Unbilled & Balance respectively. Draft Invoices are considered for billed amount. All the values displayed in this chart represent values excluding tax i.e. Billed To Date value displayed on the pie chart is Invoice Lines value of the Billing Summary page. The Invoiced Total available on Billing Summary page includes tax amount which is not displayed in this pie chart.

Schedule of Values Displays the following details:
  • Progress Vs WIP Vs Billing - is a bar chart that explains how billing happened versus the progress recorded. The values are represented in amounts for this chart.

Revenue Analysis Displays the following details:
  • Funding tab - displays details such as Customer, Agreement Number, Task Name, Task Number, Total Unbaselined Amount, Total Baselined Amount, Retention-Withheld, Retention-Billed, Billing Sequence, Total Funding, Net Revenue, Revenue Write-Off, and Invoiced Amount

  • Revenue Budget tab - displays details such as Task Number, Task Name, At Completion Approved Revenue Budget, Planned Revenue to Date, Actual Revenue to Date, Variation, Planned %, and Actual %,

  • Draft Revenue tab - This has two views - Summary and Details displaying details such as Customer, ITD Accrued Amount, Current Period Accrued Amount, Last Draft Revenue Number, and Last Accrue Through Date.

  • Draft Invoice tab - This has two views - Summary and Details and displays details such as Customer, Invoice Amount, Current Period Invoiced Amount, Receipt Amount, Current Period Receipt Amount, Outstanding Amount, Retention Amount, Last Invoice Number, Last AR Invoice Number, and Last Invoice Date.

  • Schedule of Values tab - this displays SOV Line Number, SOV Description, UOM, Rate, Total Planned Quantity, Total Planned Revenue Amount, Till Current Period Billed Quantity, and Till Current Period Billed Amount.


You can print or export any of these results. You can also use the Actions menu to Compare by selecting two or more rows.
Events and Expenditure Analysis Displays the following details:
  • Events tab - displays details such as Event Number, Task Name, Task Number, Billed, Event Type, Organization, Description, Currency, Revenue Amount, On Hold Bill Amount, Unbilled Amount, On Hold Revenue Amount, Bill Hold, Revenue Hold, Bill Group, and Bill Amount

  • Expenditure Item tab - displays details such as Task Name, Task Number, Billable Expenditure Cost, Non-billable Expenditure Cost, Billable Billed Amount, and Billable Unbilled Amount.

  • Change Orders tab - displays details such as Name, Summary, Task Name, Task Number, Owner, Priority, Progress Status, Days Until Due, Days Since Updated, and Open Actions.

  • Retention tab - displays details such as Customer, Agreement Number, task Name, Task Number, Withheld Amount, and Total Billed.


You can print or export any of these results.

Oracle Advanced Project Planning and Control Plus Product Configuration

Oracle Advanced Project Planning and Control Plus Product Configuration

Once you have completed installation and common configurations as described in Installing Oracle E-Business Suite Information Discovery, Release 12.2 V8 document (Doc ID: 2214431.1), you must complete the Oracle Advanced Project Planning and Control Plus product configuration setup.

See: Setting Up Oracle Advanced Project Planning and Control Plus Integration

Setting up Oracle Advanced Project Planning and Control Plus Integration

To set up Oracle Advanced Project Planning and Control Plus integration, complete the following steps:

  1. Enable JSP compilation post installation.

    Note: If this is not done, then the integration between Oracle Advanced Project Planning and Control pages and the Oracle Applications framework pages will not work as expected.

    See: How to Enable Automatic Compilation of JSP pages in R12 Environment Document ID: 458338.1.

  2. Grant the Projects Endeca Access Role (UMX|PJT_ENDECA_ACCESS_ROLE) to the predefined Projects responsibility Project Super User (FND_RESP|PA|PA_PRM_PROJ_SU|STANDARD). You can also grant the Projects Endeca Access Role to any custom Oracle Projects responsibility. You can access the Oracle Advanced Project Planning and Control Plus pages once you add the predefined role Projects Endeca Access Role to the Project Super User Responsibility responsibility (PA_PRM_PROJ_SU).

    See: Oracle E-Business Suite System Administrator's Guide - Security for more information on how to assign roles.

  3. Review the Projects Integration Security.

    See: Projects Integration Security

  4. Set up the PA: Expenditure Data Load Start Date Profile Option to determine the list of expenditure items to be loaded. All expenditure items on or after this date would be loaded in Endeca. Ensure you set the value in the canonical date format (example: 2010/01/01).

  5. Set up the PA:Project Monitoring and Control Transactional Data Load (YYYY/MM/DD) profile option to determine the date from which transactional data should be extracted for viewing in the Project Monitoring and Controls Command Centre.

  6. Optionally, run the Summarization processes.

    Note: You need to run this process only if the cost numbers do not match the amounts on the Workplan page.

    See: Performance and Exceptions Reporting Programs, Oracle Projects Fundamentals for more details.

  7. Schedule the set up for Full Endeca Refresh.

    See: Setting Up Scheduler to Load Full Graphs

  8. Schedule the set up for Incremental Endeca Refresh.

    See: Setting Up the Scheduler to Load Incremental Graphs

Advanced Projects Planning and Control Plus Integration Security

The Advanced Projects Planning and Control Plus Security is based on the following criteria:

Note: If the Project uses a Workplan or Financial Plan - Budget or Forecast with Time Phase as None, then such Projects are not displayed in any of the Projects Dashboards. Program enabled Projects & SOV projects are also restricted.

Setting Up the Scheduler to Load Full Graphs

You run the Full Load graph regularly to ensure that delete records are purged from the Endeca MDEX Server. It is recommended that you run the Full Load graph at least once as week. You can run it more frequently if required.

To set up the scheduler

  1. Login to Integrator server using your Clover login.

  2. Click the Scheduling tab.

  3. Select the New Schedule link.

  4. Enter a Description for the scheduler, for example, Projects Full Load Scheduler.

  5. Select Periodic as the Type.

  6. Select by interval as the Periodicity.

  7. Enter a start date and time in the Not active before date/time field.

  8. Enter an end date and time in the Not active after date/time field.

  9. Enter a value in the Interval (minutes) field.

  10. Ensure you select the Fire misfired event as soon as possible check box.

  11. Select Execute graph from the Task Type list.

  12. Select prj-pjt or prj-pmc from the Sandbox list.

  13. Select graph/Full.grf from the Graph list.

  14. Click Create to set the scheduler.

Setting Up the Scheduler to Load Incremental Graphs

You set up the Scheduler to load incremental graphs depending on when you update project information. For example, if you update project information frequently, you might choose to set the scheduler to load the incremental graph once in every 3 hours, or, if you do not update project information too frequently, you can set the scheduler to run once in a day.

To set up the scheduler

  1. Login to Integrator server using your Clover login.

  2. Click the Scheduling tab.

  3. Select the New Schedule link.

  4. Enter a Description for the scheduler, for example, Projects Incremental Load Scheduler.

  5. Select Periodic as the Type.

  6. Select by interval as the Periodicity.

  7. Enter a start date and time in the Not active before date/time field.

  8. Enter an end date and time in the Not active after date/time field.

  9. Enter a value in the Interval (minutes) field.

  10. Ensure you select the Fire misfired event as soon as possible check box.

  11. Select Start a graph from the Task Type list.

  12. Select prj-pjt or prj-pmc from the Sandbox list.

  13. Select graph/Incremental.grf from the Graph list.

  14. Click Create to set the scheduler.

Views and Joins to Load and Display Oracle Advanced Project Planning and Control Plus Data

The following views are used by the ETL layer in Endeca to load and display Oracle Advanced Project Planning and Control Plus data to the Endeca data store: