Oracle Process Manufacturing Information Discovery Plus
This chapter covers the following topics:
- Overview
- Batch Search Page
- Transaction Accounting Register Page
- Period Health Check Page
- Quality Information Discovery Page
- Setting Up Oracle Process Manufacturing Information Discovery Plus
- Setup and Configuration Steps
- Access Control: Hide and Show EID Dashboards (User Interfaces) for Oracle Process Manufacturing
- Setting Up the Scheduler for Endeca Full Refresh
- Profile Options for Oracle Process Manufacturing
- Views and Joins for Oracle Process Manufacturing
- Menus for Oracle Process Manufacturing
Overview
You can use Oracle Process Manufacturing (OPM) Information Discovery to search and filter batch status, batch delays, ingredient and resource shortage, quantity of scraps, quality sample results, and batch yield information. Using the Process Manufacturing dashboard pages, you can review and analyze data using key Performance Indicators (KPIs), performance evaluation metrics, charts, graphs, and tables. You can search using OPM pages and Endeca Information Discovery (EID) design tools. These pages are hosted in an EID environment, and called from new container pages in EBS. In OPM, the following region and pages enable search functions using Endeca Information Discovery integration:
Batch Search Page: This page displays the complete set of process batches with any of the following status:
-
WIP
-
Pending
-
Completed
This chapter provides product-specific details required to integrate Endeca Information Discovery (EID) with Oracle E-Business Suite Release 12.2 V8 for the Oracle Process Manufacturing Information Discovery Plus application. This supplements the information provided in Installing Oracle E-Business Suite Information Discovery, Release 12.2 V8 (Doc ID: 2214431.1). You must read this document and make note of the requirements before you begin your installation.
Oracle Process Manufacturing Information Discovery Plus User Interface
Batch Search Page
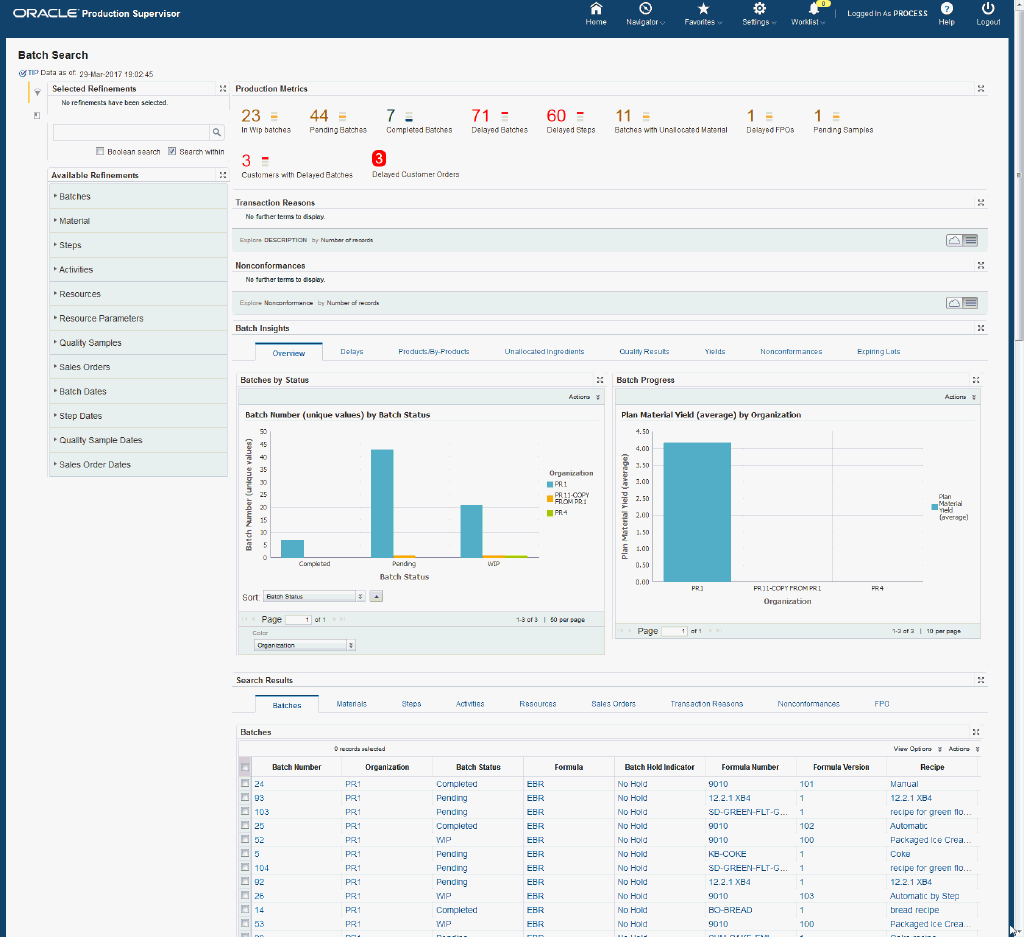
The Batch Search page displays Endeca content for Oracle Process Manufacturing batch processes. You can search using Available Refinements attributes, and view production metrics, charts, and results tables. The following is a partial display of the Batch Search page.
From the Production Supervisor responsibility, navigate to the Batch Search page:
(N) Production Supervisor > Batch Information Discovery

Within Endeca regions on the Batch Search page, you can track process batch activity. You can analyze data and review process batch production metrics, charts, graphs, and tables. The following describes the Endeca Batch Search page regions and components:
| Region | Components |
|---|---|
Advanced Search
|
The Advanced Search component includes value search, record search, Boolean search, and partial search capabilities. You can submit keyword searches and the application provides type-ahead suggestions and displays attribute values that match the typed text. When you perform a search, the search term is added to the Selected Refinements component. As you type, you may be prompted to select a matching attribute value, or simply search for the entered text.
Additional Information: See the Advanced Search Capabilities appendix in this guide for details. Partial record search is enabled for specific attributes. Attributes for partial record search include:
|
| Selected Refinements | The Selected Refinements component displays all values that you have selected to filter data, and allows you to quickly make adjustments to the current refinement by removing items or clearing all filters from the list. |
| Bookmarks | The Bookmarks component allows you to save a given navigation and component state and return to it at a later time. |
| Available Refinements | You can use the Available Refinements component to filter data using attribute groups. Expand the following attribute groups to view and select attribute names:
|
| Production Metrics (summarization bar) Note: The Metric Components are color coded to highlight warnings and health: - Red: Critical warning state - Yellow: Warning - Gray: Normal - Green: Good |
|
| Transaction Reasons (tag cloud) | Top Ten Transaction Reasons Tag Cloud Component
Note: The Transaction Reasons tag cloud component displays the top ten transaction reasons by frequency of occurrence. |
| Non-conformances (tag cloud) | Top Ten Non-conformances Tag Cloud Component
Note: The Non-conformances tag cloud component displays the top ten non-conformances by frequency of occurrence. |
| Batch Insights (tabbed component container) Overview (tab) |
Batches by Status (chart)
Batch Progress (chart) |
| Batch Insights (tabbed component container) Delays (tab) |
Delayed Batches (chart)
Delayed Steps (chart)
|
| Batch Insights (tabbed component container) Products/By-Products (tab) |
Products (chart)
By-Products (chart)
|
| Batch Insights (tabbed component container) Unallocated Ingredients (tab) |
Batches by Unallocated Ingredients (chart)
Products by Unallocated Ingredients (chart)
|
| Batch Insights (tabbed component container) Quality Results (tab) |
Sample Results (chart)
Sample Results Details (cross tab) |
| Batch Insights (tabbed component container) Yields (tab) |
Yield Percent By Organization, Product (chart)
Product Yield Details (cross tab) |
| Batch Insights (tabbed component container) Nonconformances (tab) |
Non Conformances by Organization (chart)
Non Conformances by Product, Customer (chart)
|
| Batch Insights (tabbed component container) Expiring Lots (tab) |
Expiring Lots by Organization (chart)
Expiring Lots Details (cross tab) |
| Search Results (tabbed component container) | The Search Results displays the following results tables:
|
Transaction Accounting Register Page
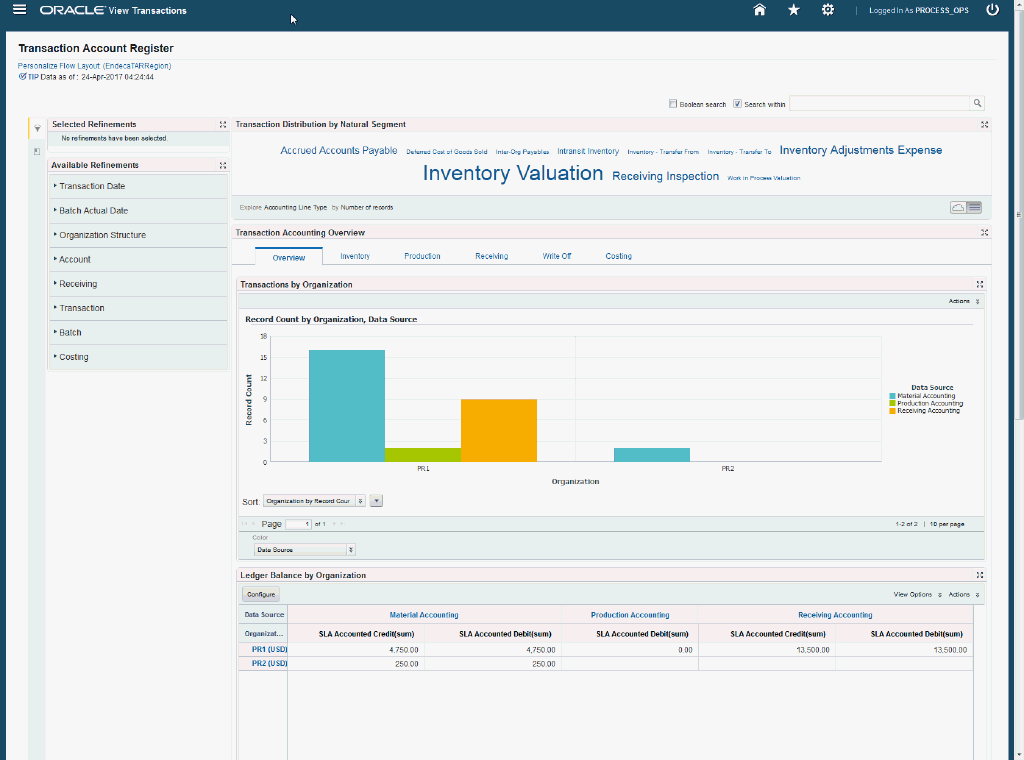
The Transaction Accounting Register page displays material, production, receiving, write-off, and costing transaction accounting information along with SLA and GL accounting (if transferred to GL in detail mode). Using the Available Refinements component, you can search on various attributes and view Transaction Distributions Overview charts, graphs and Subledger results tables. The following is a display of the Transaction Accounting Register page.
From the OPM Financials responsibility, navigate to the Transaction Accounting Register page:
(N) OPM Financials > View Transactions > Transaction Accounting Register

You can use the Transaction Accounting Register page to view charts, graphs, and tag clouds for insights into Transaction Accounting Distributions. The following describes the Endeca Cost Management Transaction Accounting Register page regions and components:
| Region | Components |
|---|---|
Advanced Search
|
The Advanced Search component includes value search, record search, Boolean search, and partial search capabilities. You can submit keyword searches and the application provides type-ahead suggestions and displays attribute values that match the typed text. When you perform a search, the search term is added to the Selected Refinements component. As you type, you may be prompted to select a matching attribute value, or simply search for the entered text.
Additional Information: See the Advanced Search Capabilities appendix in this guide for details. |
| Selected Refinements | The Selected Refinements component displays all values that you have selected to filter data, and allows you to quickly make adjustments to the current refinement by removing items or clearing all filters from the list. |
| Bookmarks | The Bookmarks component allows you to save a given navigation and component state and return to it at a later time. |
| Available Refinements | You can use the Available Refinements component to filter data using attribute groups. Expand the following attribute groups to view and select attribute names:
|
| Transaction Distribution by Natural Segment (tag cloud) | Top Ten Transaction Distribution by Natural Segment Tag Cloud Component
Note: The Transaction Distributions by Natural Segment tag cloud component displays the top ten Natural Segment Accounts based on the accounting distributions displayed in relative sizes by frequency of occurrence. |
| Transactions Accounting Overview (tabbed component container) Overview (tab) |
Transactions by Organization (chart)
Note: The Overview - Transaction by Organization chart displays distributions of the number of transactions by Organizations stacked by Source Type of the transactions.
Ledger Balance by Organization (cross tab) Note: The Overview - Ledger Balance by Organization cross tab displays ledger balances for all Organizations.
|
| Transactions Accounting Overview (tabbed component container) Inventory (tab) |
Transaction Value by Organization (chart)
Inventory Subledger (cross tab)
|
| Transactions Accounting Overview (tabbed component container) Production (tab) |
Transaction Value by Organization (chart)
Production Subledger (cross tab)
|
| Transactions Accounting Overview (tabbed component container) Receiving (tab) |
Transaction Value by Organization (chart)
Receiving Subledger (cross tab)
|
| Transactions Accounting Overview (tabbed component container) Write Off (tab) |
Transaction Value by Organization (chart)
Receiving Subledger (cross tab)
|
| Transactions Accounting Overview (tabbed component container) Costing (tab) |
Transaction Value by Organization (chart)
Costing Subledger (cross tab)
|
Period Health Check Page
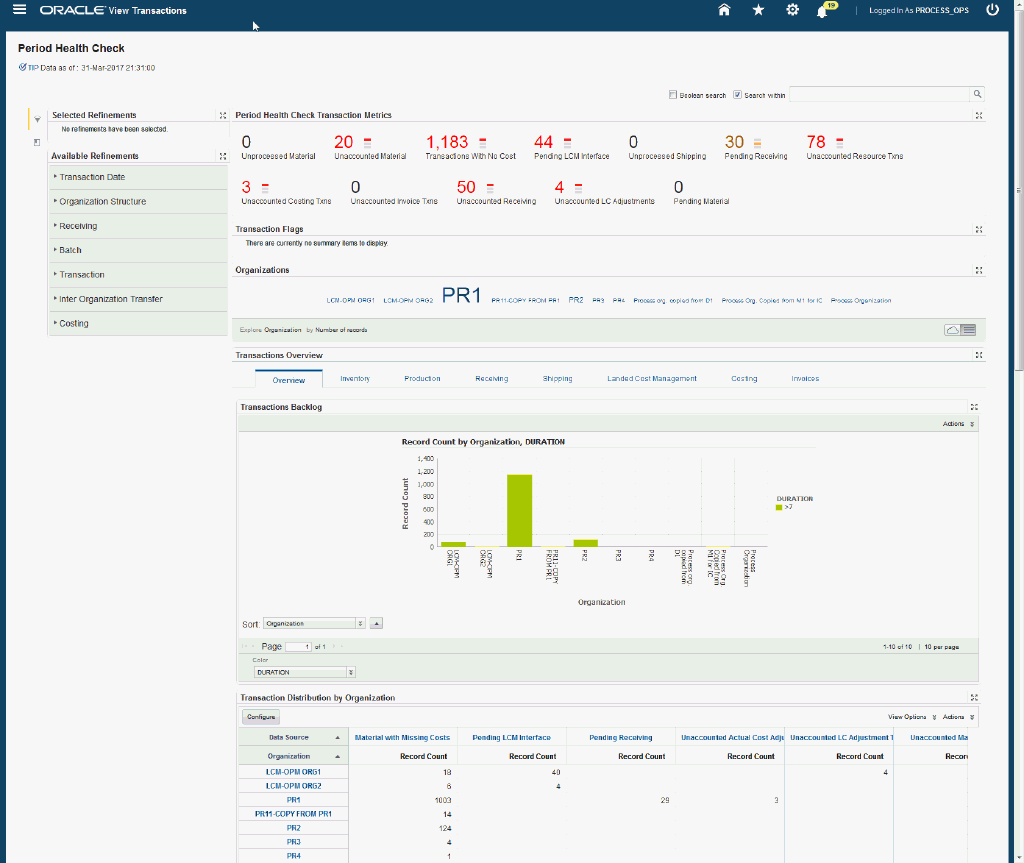
Use the Period Health Check page to search for and display Inventory, Production, Receiving, Shipping, Landed Cost Management, Costing, and Invoices transactions that are preventing period close, as well as transactions that are to be reviewed and preferably processed but are not necessary for period close. You can use the Available Refinements component to search on various attributes and view period close metrics, charts, and results tables. The following is a partial display of the Period Health Check page.
From the OPM Financials responsibility, navigate to the Period Health Check page:
(N) OPM Financials > View Transactions > Period Health Check

You can use the Period Health Check page to view transactions that could prevent or delay period close. You can analyze data and review transaction metrics, charts, graphs, and tables. The following describes the Endeca Cost Management Period Health Check page regions and components:
| Region | Components |
|---|---|
Advanced Search
|
The Advanced Search component includes value search, record search, Boolean search, and partial search capabilities. You can submit keyword searches and the application provides type-ahead suggestions and displays attribute values that match the typed text. When you perform a search, the search term is added to the Selected Refinements component. As you type, you may be prompted to select a matching attribute value, or simply search for the entered text.
Additional Information: See the Advanced Search Capabilities appendix in this guide for details. |
| Selected Refinements | The Selected Refinements component displays all values that you have selected to filter data, and allows you to quickly make adjustments to the current refinement by removing items or clearing all filters from the list. |
| Bookmarks | The Bookmarks component allows you to save a given navigation and component state and return to it at a later time. |
| Available Refinements | You can use the Available Refinements component to filter data using attribute groups. Expand the following attribute groups to view and select attribute names:
|
| Period Health Check Transaction Metrics (summarization bar)
Note: The Metric Components are color coded to highlight warnings and health: - Red: Critical warning state - Yellow: Warning state - Gray: Normal - Green: Good |
|
| Organizations (tag cloud) | Top Ten Organizations Tag Cloud Component
Note: The Organizations tag cloud component displays the top ten organizations having the most transactions displayed in relative sizes by frequency of occurrence. |
| Transactions Overview (tabbed component container) Overview (tab) |
Transactions Backlog (chart)
Transaction Distribution by Organization (cross tab) Note: The Overview - Transactions Distribution by Organization cross tab displays the transaction counts grouped by Functional Group and Organization.
|
| Transactions Overview (tabbed component container) The tabbed container includes tabs for each of the following transaction sources:
|
Transaction Distribution by Organization (chart)
Note: The Transaction Distribution by Organization chart displays the transaction counts grouped by Transaction Source and Organization.
Transaction Distribution by Organization (cross tab) Note: The Transaction Distribution by Organization cross tab displays the counts of transactions grouped by Source Type and Organization. Transaction Details (results table) Note: The Transaction Details results table displays all attributes pertaining to the transactions and are grouped into column sets. Each column set contains a subset of logically related and relevant columns. Therefore, there is no need for long scrolls to view all the transaction details.
|
Quality Information Discovery Page
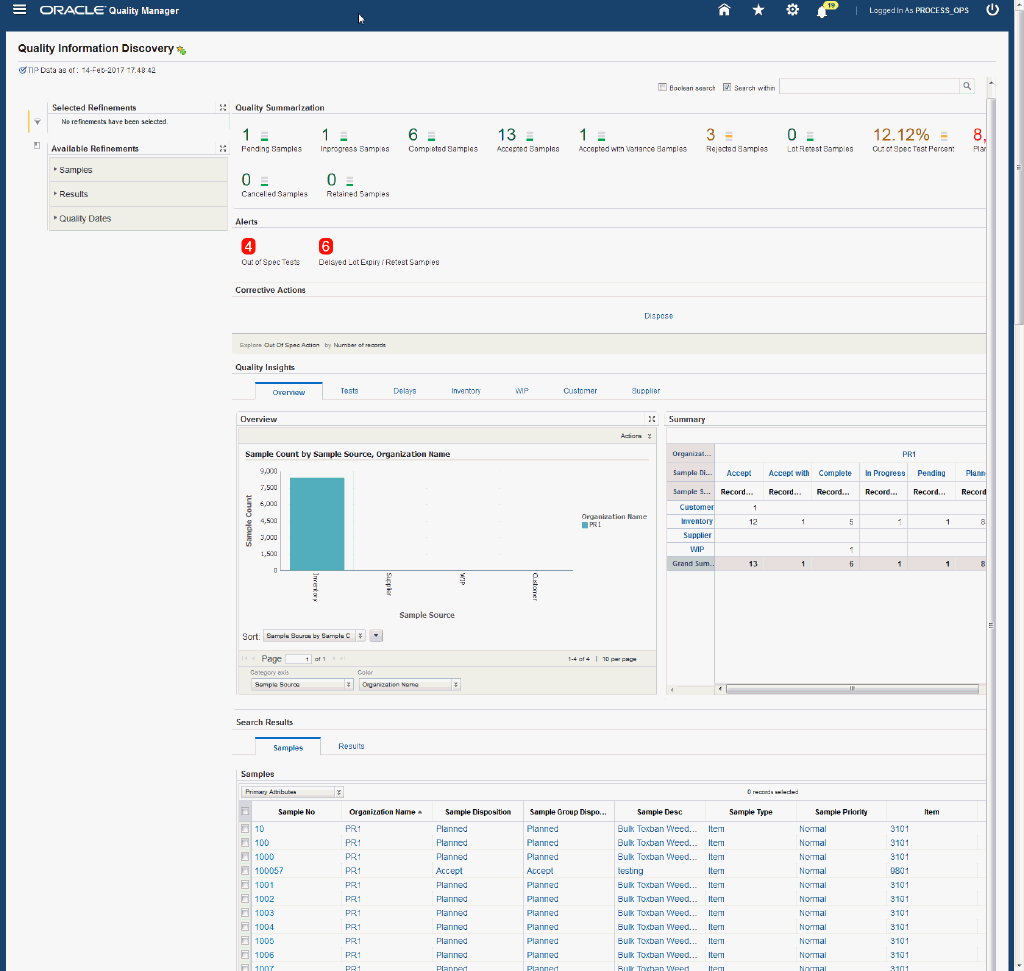
Use the Quality Information Discovery page to search for and display information related to the quality of the material and processes, identify material non conformances, and take corrective actions. You can use the Available Refinements component to search on various attributes and view quality metrics, charts, and results tables. The following is a partial display of the Quality Information Discovery page.
From the OPM Quality Manager responsibility, navigate to the Quality Information Discovery page:
(N) Quality Manager > Quality Information Discovery

You can use the Quality Information Discovery page to search and view process quality samples, test results, and related entities across inventory and laboratory organizations. You can analyze data and review quality metrics, charts, graphs, and tables. The following describes the Endeca Quality Information Discovery page regions and components:
| Region | Components |
|---|---|
Advanced Search
|
The Advanced Search component includes value search, record search, Boolean search, and partial search capabilities. You can submit keyword searches and the application provides type-ahead suggestions and displays attribute values that match the typed text. When you perform a search, the search term is added to the Selected Refinements component. As you type, you may be prompted to select a matching attribute value, or simply search for the entered text.
Additional Information: See the Advanced Search Capabilities appendix in this guide for details. |
| Selected Refinements | The Selected Refinements component displays all values that you have selected to filter data, and allows you to quickly make adjustments to the current refinement by removing items or clearing all filters from the list. |
| Bookmarks | The Bookmarks component allows you to save a given navigation and component state and return to it at a later time. |
| Available Refinements | You can use the Available Refinements component to filter data using attribute groups. Expand the following attribute groups to view and select attribute names:
|
| Quality Summarization (summarization bar)
Note: The Metric Components are color coded to highlight warnings and health: - Red: Critical warning state - Yellow: Warning - Gray: Normal - Green: Good |
|
| Alerts | The Quality Information Alerts region displays a list of the quality alerts for
|
| Corrective Actions (tag cloud) | Top Ten Corrective Actions Tag Cloud Component
Note: The Corrective Actions tag cloud component displays the top ten corrective actions entered in tests that are evaluated as Out of Specification and are displayed in relative sizes by frequency of occurrence. |
| Quality Insights (tabbed component container) Overview (tab) |
Sample Count by Sample Source, Organization Name (chart)
Summary (cross tab)
|
| Quality Insights (tabbed component container) Test (tab) |
Tests Due by Tester (chart)
Tests Due by Due Period (chart)
|
| Quality Insights (tabbed component container) Delays (tab) |
Delayed Samples (chart)
Delayed Tests (chart)
|
| Quality Insights (tabbed component container) Inventory (tab) |
Disposition Analysis (chart)
Out of Spec Test Analysis (chart)
|
| Quality Insights (tabbed component container) WIP (tab) |
Disposition Analysis (chart)
Out of Spec Test Analysis (chart)
|
| Quality Insights (tabbed component container) Customer (tab) |
Disposition Analysis (chart)
Out of Spec Test Analysis (chart)
|
| Quality Insights (tabbed component container) Supplier (tab) |
Disposition Analysis (chart)
Out of Spec Test Analysis (chart)
|
| Search Results (tabbed component container) Samples (tab) |
Samples (results table)
|
| Search Results (tabbed component container) Results (tab) |
Results (results table)
|
Oracle Process Manufacturing Information Discovery Plus Product Configuration
Setting Up Oracle Process Manufacturing Information Discovery Plus
The Oracle Process Manufacturing application configuration and setup must be completed after the installation and common configurations are completed as described in Installing Oracle E-Business Suite Information Discovery, Release 12.2 V8 (Doc ID: 2214431.1).
Setup and Configuration Steps
To set up Oracle Process Manufacturing Information Discovery Plus, you must complete the following steps:
-
Set Access Control by assigning UMX roles and updating access grants.
Access Control: Hide and Show EID Dashboards (User Interfaces) for Oracle Process Manufacturing
As part of the Oracle E-Business Suite-EID integration for the Oracle Process Manufacturing application, the following UMX Roles are provided:
| UMX Role | Internal Code Name |
|---|---|
| GMO Endeca Access Role | UMX|GMO_ENDECA_ACCESS_ROLE |
| OPM Financials Endeca Transaction Accounting Register Access Role | UMX|GMF_ENDECA_TXN_REG_ACCESS_ROLE |
| OPM Financials Endeca Period Health Check Access Role | UMX|GMF ENDECA PRD HLTH CHK ACCESS ROLE |
| GMD Quality Endeca Access Role | UMX|GMD_QUALITY_ENDECA_ACCESS_ROLE |
You must add the UMX roles to enable Endeca menus for the Production Supervisor, OPM Financials, and OPM Quality Manager responsibilities (or any other custom responsibility which is using the same menu). You must assign these UMX roles to the responsibilities. When the UMX roles are assigned to the responsibilities, the pages appear.
If you want to use the Endeca-related roles with more than one responsibility, then you must have an additional grant with a security context corresponding to each responsibility. You can add grants for a given role as a separate process instead of while you are adding the role to the responsibility.
| Permission Set | Internal Code Name |
|---|---|
| GMD Quality Endeca Access Permission Set | GMD_QUALITY_ENDECA_ACCESS_PS |
| Access Grant | Internal Code Name |
|---|---|
| GMD Quality Endeca Access Grant | GMD_QUALITY_ENDECA_ACCESS_GRANT |
Complete the following steps to enable Endeca Menus in Oracle E-Business Suite (EBS):
-
Assign a UMX Role to the Responsibility.
-
Update GMD_QUALITY_ENDECA_ACCESS_GRANT Grant.
For assigning UMX Roles and Grants, refer to Appendix C in Installing Oracle E-Business Suite Information Discovery, Release 12.2 V8 (Doc ID: 2214431.1).
Setting Up the Scheduler for Endeca Full Refresh
The initial data upload for Endeca Search is complete when the Full graph is run as described in Installing Oracle E-Business Suite Information Discovery, Release 12.2 V8 (Doc ID: 2214431.1). Full refresh deletes all data from Endeca and repopulates it with a full data extract from the E-Business Suite system. For incremental refresh, you should determine how often the Endeca data should be refreshed from E-Business Suite depending on your organizational requirements.
-
Login to Integrator server using your Clover login.
-
Click the Scheduling tab.
-
Select the New Schedule link.
-
Enter a Description for the scheduler.
-
Select Periodic as the Type.
-
Select by interval as the Periodicity.
-
Enter a start date and time in the Not active before date/time field.
-
Enter an end date and time in the Not active after date/time field.
-
Enter a value in the Interval (minutes) field.
-
Ensure you select the Fire misfired event as soon as possible check box.
-
Select Start a graph from the Task Type list.
-
Select the graph for schedule to run. I.e. Full.grf/incremental.grf.
-
Click Create to set the scheduler.
Profile Options for Oracle Process Manufacturing
| Profile Option Name | Description |
|---|---|
| GMD:Days For Full Data Load | This optional site-level profile determines the number of days for loading quality data. Records updated within the days set by this profile option are loaded. The default setting is 180 days and overrides the Endeca Workspace parameter setting defined by the user. |
| GME: Days For Endeca Cancelled Batches Load | This optional site-level profile sets the maximum days for gmo-batch Endeca full data load for cancelled batches. |
Views and Joins for Oracle Process Manufacturing
The following views are used by the ETL layer in Endeca to load Process Manufacturing data to the Endeca data domain:
| View Name | Purpose |
|---|---|
| GMD_ENDECA_CUS_QUALITIES_V | This view loads customer sample and results for display in the Quality Information Discovery Page. |
| GMD_ENDECA_INV_QUALITIES_V | This view loads inventory samples and results for display in the Quality Information Discovery Page. |
| GMD_ENDECA_SUP_QUALITIES_V | This view loads supplier samples and results for display in the Quality Information Discovery Page. |
| GMD_ENDECA_WIP_QUALITIES_V | This view loads WIP samples and results for display in the Quality Information Discovery Page. |
| GMD_ENDECA_QM_TMP | Incremental load uses a temp table to gather samples and results created and modified from the last successful full/incremental load. |
| OPM_ENDECA_HDR_V | This view loads batch header information for display in the Batch Information Discovery Page. |
| OPM_ENDECA_MTL_V | This view loads material data pertaining to the batch for display in the Batch Information Discovery Page. |
| OPM_ENDECA_STEP_V | This view loads batch step information for display in the Batch Information Discovery Page. |
| OPM_ENDECA_ACTIVITY_V | This view loads batch step activity information for display in the Batch Information Discovery Page. |
| OPM_ENDECA_RESOURCE_V | This view loads batch step resource information for display in the Batch Information Discovery Page. |
| OPM_ENDECA_PP_V | This view loads batch step resource parameter information for display in the Batch Information Discovery Page. |
| OPM_ENDECA_SO_RESER_V | This view loads sales order reservation information pertaining to the batch for display in the Batch Information Discovery Page. |
| OPM_ENDECA_TXN_REASON_V | This view loads transaction reason information pertaining to the batch for display in the Batch Information Discovery Page. |
| OPM_ENDECA_EXPIRED_LOT_V | This view loads expired lot information pertaining to the batch for display in the Batch Information Discovery Page. |
| OPM_ENDECA_SAMPLE_V | This view loads OPM Quality sample information pertaining to the batch for display in the Batch Information Discovery Page. |
| OPM_ENDECA_NCM_V | This view loads non conformance data pertaining to the batch for display in the Batch Information Discovery Page. |
Menus for Oracle Process Manufacturing
Endeca Process Manufacturing integration includes the following user menu functions:
| User Function Name | Function Name |
|---|---|
| View Transactions | GMF_VIEW_TRANSACTIONS |
| Quality Information Discovery | GMD_QUALITY_ENDECA_SEARCH_PAGE |