Oracle Quality Information Discovery Plus
Overview
You can use Oracle Quality Information Discovery Plus to search and filter the most collections data in a single location and drill down to get more detailed information enabling you to take action using that information. As a Product & Process Quality Engineer or an Analyst, you can use the Quality Collection Results, Nonconformance Collection Results, and Corrective Actions Collection Results pages to perform searches across quality plans and plan types, across quality plan hierarchies for quality and nonconfirmance enabling you to take early corrective actions. You use these pages, based on your role, to review and analyze data using key Performance Indicators (KPIs), performance evaluation metrics, charts, graphs, and tables.
You can search using Oracle Quality Information Discovery Plus pages and Endeca Information Discovery (EID) design tools. These pages are hosted in an EID environment, and called from new container pages in EBS.
This chapter provides product-specific details required to integrate Endeca Information Discovery (EID) with Oracle E-Business Suite Release 12.2 V8 for the Oracle Quality Information Discovery Plus for the Oracle Endeca application. This supplements the information provided in Installing Oracle E-Business Suite Information Discovery, Release 12.2 V8 (Doc ID: 2214431.1). You must read this document and make note of the requirements before you begin your installation.
Oracle Quality Information Discovery Plus User Interfaces
Quality Collection Results
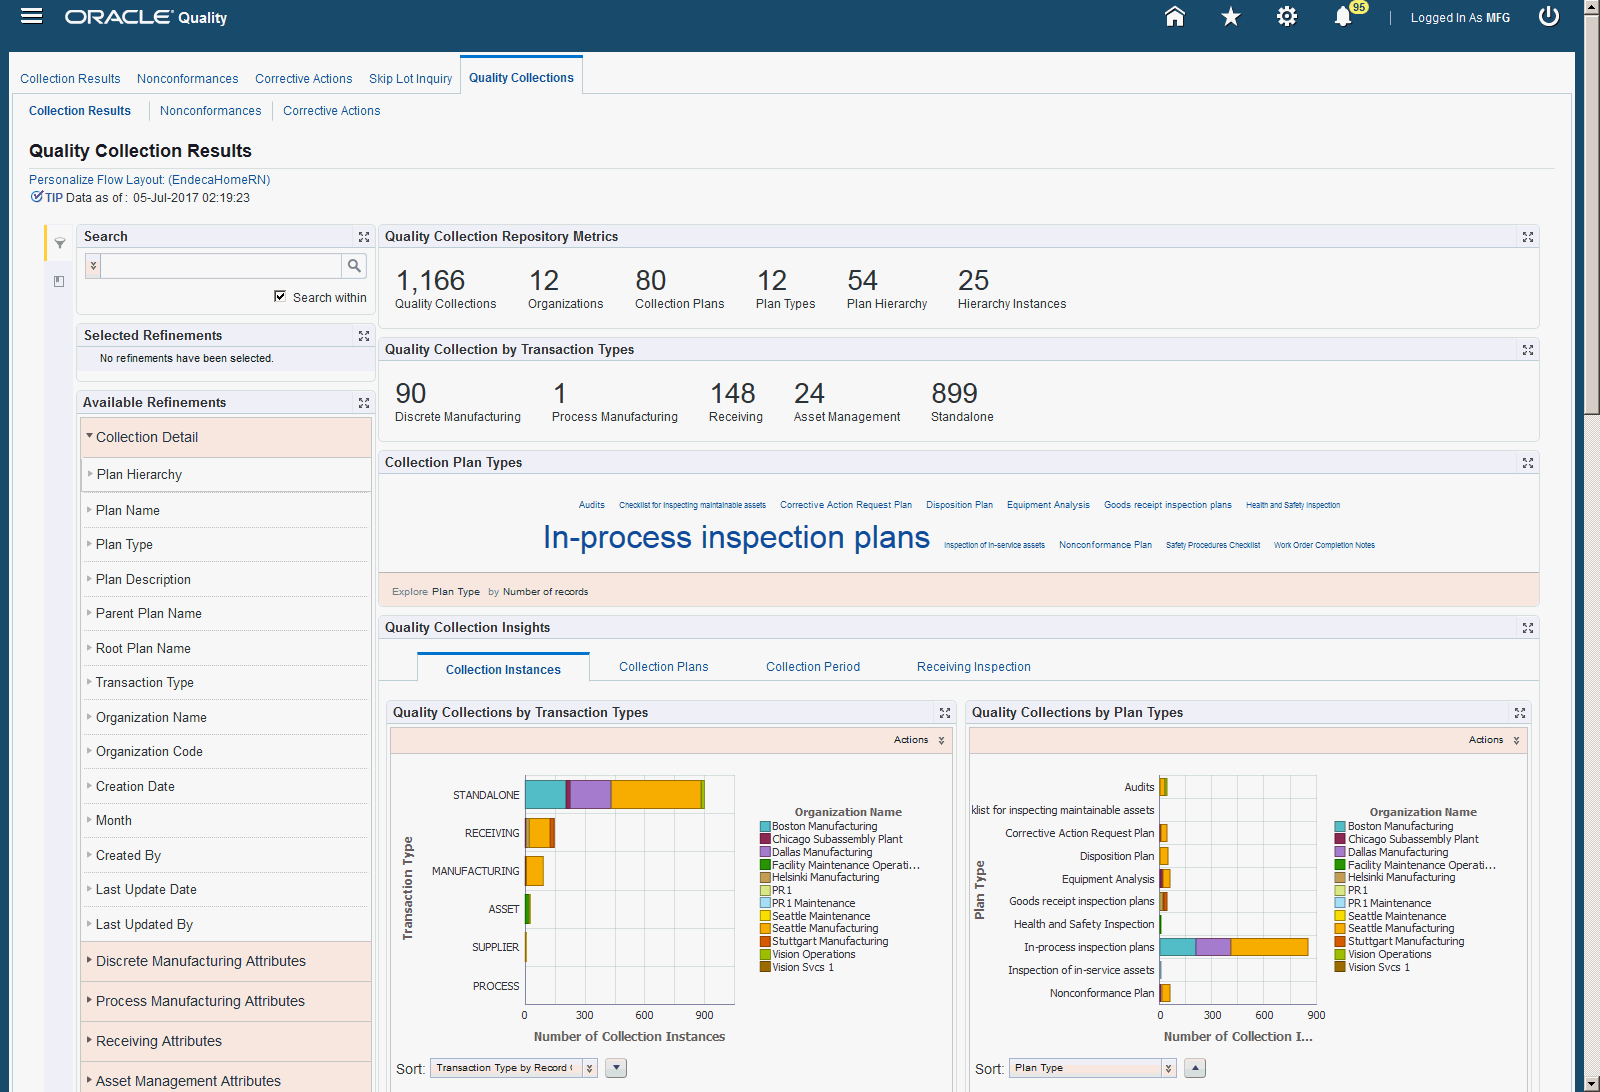
If you are a Product & Discrete Quality Engineer or an Analyst, you use the Quality Collection Results page to search for quality plans and plan types, across quality plan hierarchies for an overview and detail of all the quality collections plans and plan elements.
From the Quality Collections responsibility, navigate to the Quality Collection Results page:
-
(N) Quality Collections Information Discovery > Quality Collections > Quality Collection Results

| Region | Components |
|---|---|
| Alerts | Use alerts to direct you attention to any potential issues or risks that might arise. |
| Tip | Displays the date on which data was last refreshed. |
Search
|
The Advanced Search component includes value search, record search, and partial search capabilities. You can submit keyword searches and the application provides type-ahead suggestions and displays attribute values that match the typed text. When you perform a search, the search term is added to the Selected Refinements component. As you type, you may be prompted to select a matching attribute value, or simply search for the entered text.
Additional Information: See the Advanced Search Capabilities appendix in this guide for details. |
| Selected Refinements | The Selected Refinements component displays all values that you have selected to filter data, and allows you to quickly make adjustments to the current refinement by removing items or clearing all filters from the list. |
| Bookmarks | The Bookmarks component allows you to save a given navigation and component state and return to it at a later time. |
| Available Refinements | The Available Refinements component allows you to filter data based on the currently available values or value ranges for selected attributes that are displayed within attribute groups. Expand the attribute groups to view and select attribute names. |
| Quality Collection Repository Metrics
Note: The Metric Components are color coded to highlight warnings and health:
|
Consists of the following:
|
| Quality Collection by Transaction Types | Consists of the following:
|
| Collection Plan Types | Displays the top 10 plan types. |
| Quality Collection Insights | Consists of the following tabs:
|
| Quality Collections | Consists of the following tabs:
|
| Compare Collections | Use this to compare two or more collections. |
| Collection Record Details | Use this to view details of the collections. |
Nonconformances Collection Results
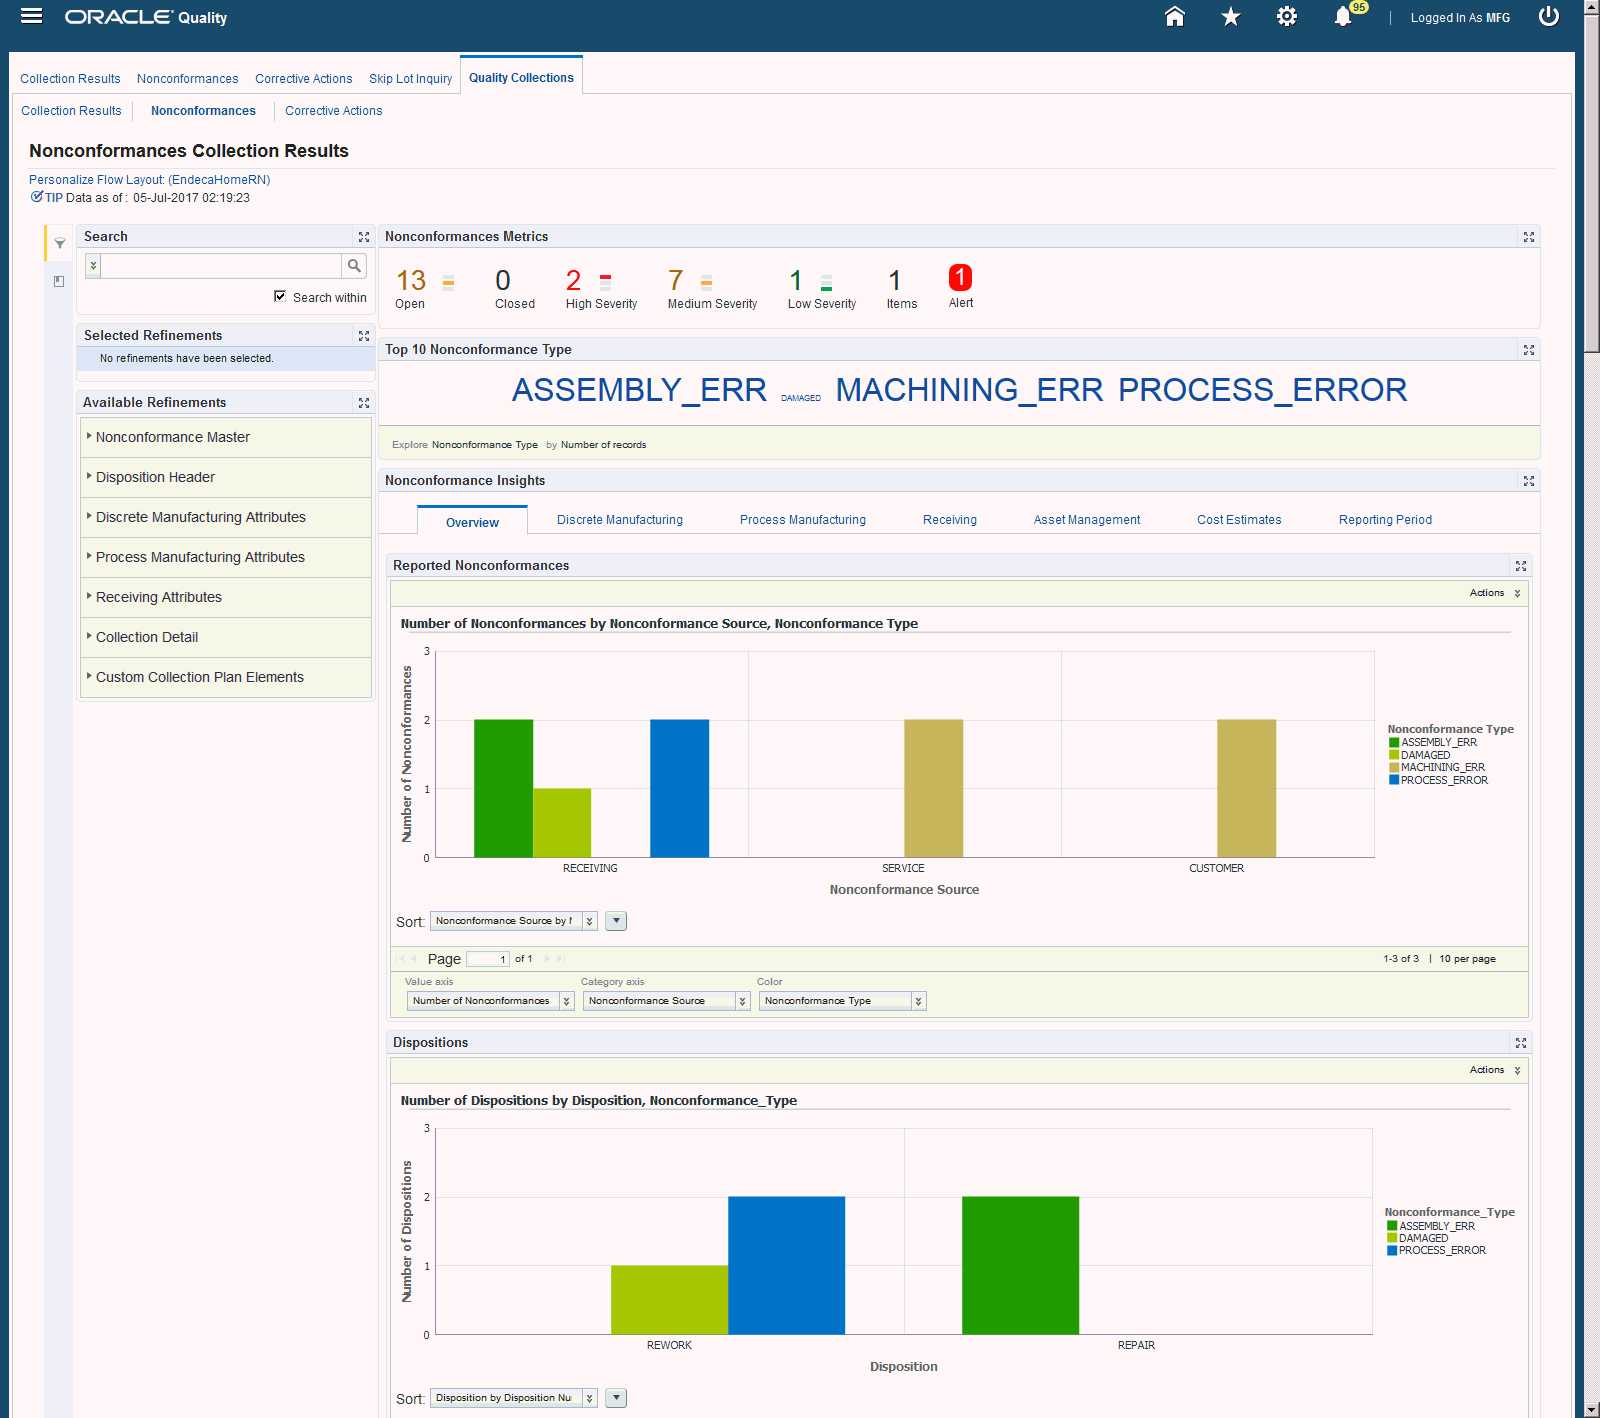
If you are a Product & Discrete Quality Engineer or an Analyst, you use the Nonconformances Collection Results page to get an insights into quality non-conformance and details.
From the Quality Collections Information Discovery responsibility, navigate to the Nonconformances Collection Results page:
-
(N) Quality Collections > Nonconformances > Nonconformances Collection Results

| Region | Components |
|---|---|
| Alerts | Use alerts to direct you attention to any potential issues or risks that might arise. |
| Tip | Displays the date on which data was last refreshed. |
Search
|
The Advanced Search component includes value search, record search, and partial search capabilities. You can submit keyword searches and the application provides type-ahead suggestions and displays attribute values that match the typed text. When you perform a search, the search term is added to the Selected Refinements component. As you type, you may be prompted to select a matching attribute value, or simply search for the entered text.
Additional Information: See the Advanced Search Capabilities appendix in this guide for details. |
| Selected Refinements | The Selected Refinements component displays all values that you have selected to filter data, and allows you to quickly make adjustments to the current refinement by removing items or clearing all filters from the list. |
| Bookmarks | The Bookmarks component allows you to save a given navigation and component state and return to it at a later time. |
| Available Refinements | The Available Refinements component allows you to filter data based on the currently available values or value ranges for selected attributes that are displayed within attribute groups. Expand the attribute groups to view and select attribute names. |
| Nonconformances Metrics
Note: The Metric Components are color coded to highlight warnings and health:
|
Consists of the following:
|
| Top 10 Nonconformance Types | Displays the top 10 Nonconformance types. |
| Nonconformance Insights | Consists of the following tabs:
|
| Dispositions | Displays the number of dispositions by disposition type and nonconformance type in a graphical format. |
| Quality Collections | Consists of the following tabs:
|
| Compare Collections | Use this to compare two or more collections. |
| Collection Record Details | Use this to view details of the collections. |
Corrective Actions Collection Results
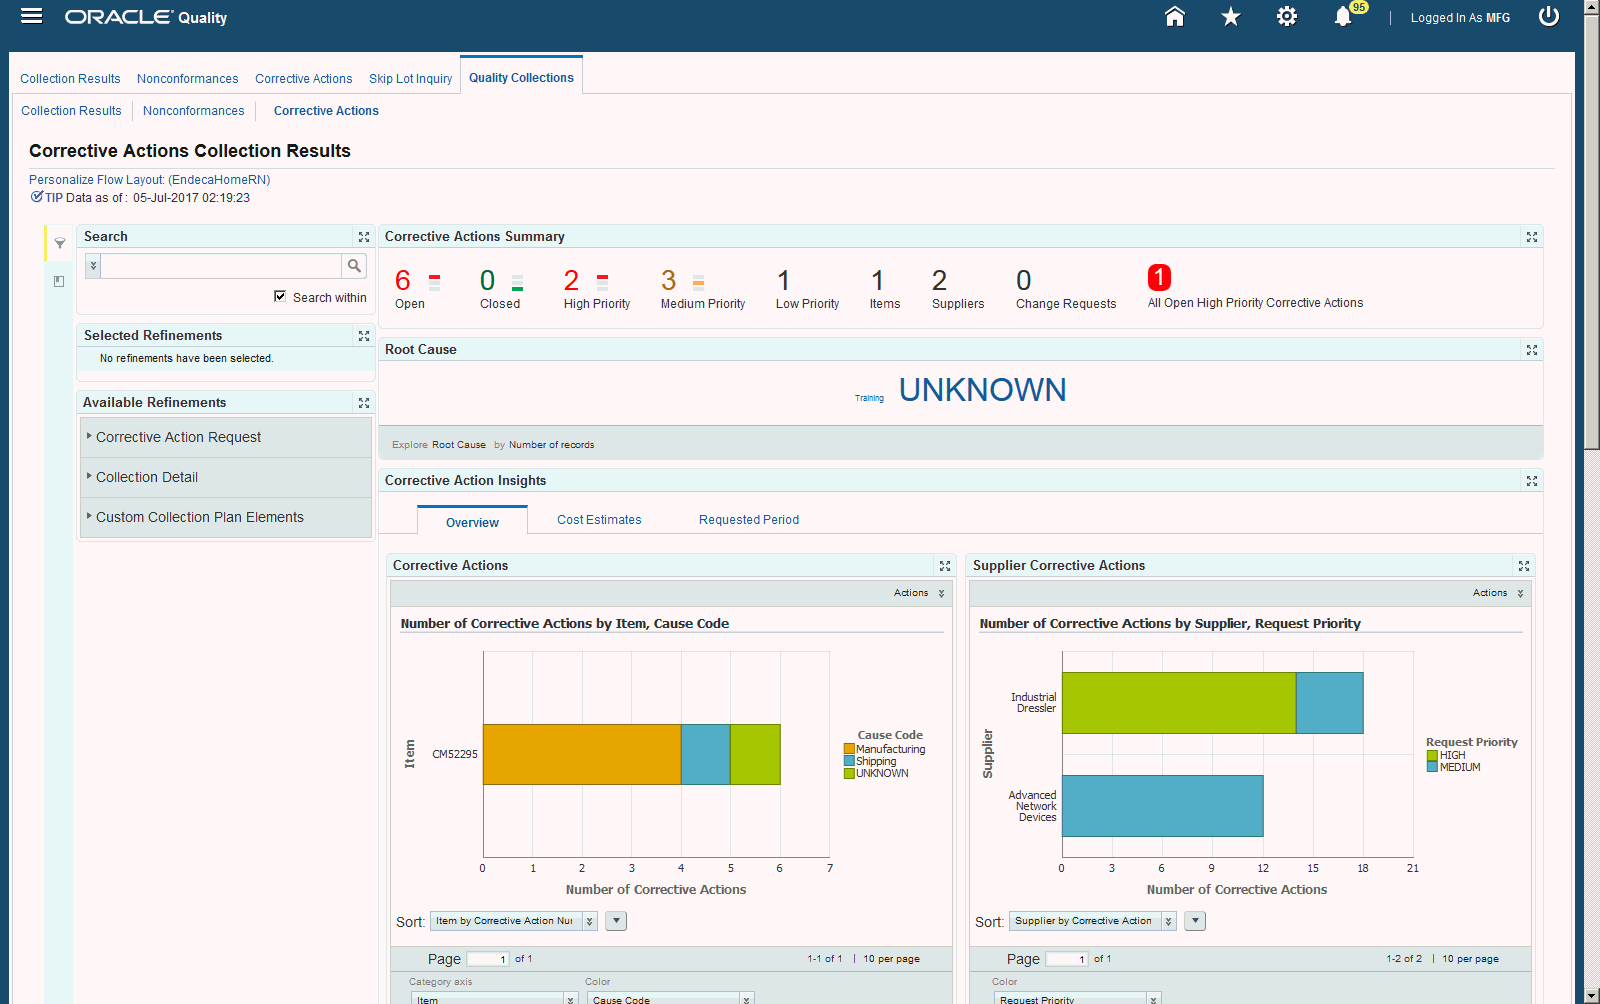
If you are a Product & Process Quality Engineer or an Analyst, you use the Corrective Actions Collection Results page to analyze and search past corrective actions.
From the Quality Collections Information Discovery responsibility, navigate to the Corrective Actions Collection Results page:
-
(N) Quality Collections > Corrective Actions > Corrective Actions Collection Results

| Region | Components |
|---|---|
| Alerts | Use alerts to direct you attention to any potential issues or risks that might arise. |
| Tip | Displays the date on which data was last refreshed. |
Search
|
The Advanced Search component includes value search, record search, and partial search capabilities. You can submit keyword searches and the application provides type-ahead suggestions and displays attribute values that match the typed text. When you perform a search, the search term is added to the Selected Refinements component. As you type, you may be prompted to select a matching attribute value, or simply search for the entered text.
Additional Information: See the Advanced Search Capabilities appendix in this guide for details. |
| Selected Refinements | The Selected Refinements component displays all values that you have selected to filter data, and allows you to quickly make adjustments to the current refinement by removing items or clearing all filters from the list. |
| Bookmarks | The Bookmarks component allows you to save a given navigation and component state and return to it at a later time. |
| Available Refinements | The Available Refinements component allows you to filter data based on the currently available values or value ranges for selected attributes that are displayed within attribute groups. Expand the attribute groups to view and select attribute names. |
| Corrective Actions Metrics
Note: The Metric Components are color coded to highlight warnings and health:
|
Consists of the following:
|
| Root Cause | Displays the top 10 root causes for corrective actions. |
| Corrective Action Insights | Consists of the following tabs:
|
| Quality Collections | Consists of the following tabs:
|
| Compare Collections | Use this to compare two or more collections. |
| Collection Record Details | Use this to view details of the collections. |
Oracle Quality Information Discovery Plus Product Configuration
Overview
Complete the Oracle Quality Information Discovery Plus product configuration after the installation and common configurations are completed as described in the Installing Oracle E-Business Suite Information Discovery, Release 12.2 V8 document (Doc ID: 2214431.1).
Setting Up Oracle Quality Information Discovery Plus Integration
-
Add the UMX|QA ENDECA ACCESS ROLE to any predefined Oracle Quality responsibility or to any custom Oracle Quality responsibility.
See: Oracle E-Business Suite System Administrator's Guide - Security for more information on how to assign roles.
-
Change plan names as well element names which start with number.
The SQL script for getting all the plan names which start with number is:
SELECT *
FROM qa_plans
WHERE name LIKE '1%'
OR name LIKE '2%'
OR name LIKE '3%'
OR name LIKE '4%'
OR name LIKE '5%'
OR name LIKE '6%'
OR name LIKE '7%'
OR name LIKE '8%'
OR name LIKE '9%'
OR name LIKE '0%';
The SQL script for getting all the plan elements which start with number is:
SELECT *
FROM qa_chars
WHERE name LIKE '1%'
OR name LIKE '2%'
OR name LIKE '3%'
OR name LIKE '4%'
OR name LIKE '5%'
OR name LIKE '6%'
OR name LIKE '7%'
OR name LIKE '8%'
OR name LIKE '9%'
OR name LIKE '0%' ;
-
Run qltvcreb.plb on the environment to re create all the collection plan views.
-
Run the Publish Quality Collection Metadata to Endeca Information Discovery concurrent program to publish EBS data to Endeca.
Note: The total number of unique collection elements across all the published collection plans should not exceed 900.
See: Publishing Quality Collection Metadata to Endeca Information Discovery
-
Run the Full Load graph.
-
Set up the Scheduler.
Publishing Quality Collection Metadata to Endeca Information Discovery
You run the Publish Quality Collection Metadata to Endeca Information Discovery concurrent program to publish EBS data to Endeca. You run the program from the Submit Requests window.
To publish quality collection metadata to endeca information discovery
-
Choose Single Request and click OK.
-
Select Publish Quality Collection Metadata to Endeca Information Discovery as the Request Name.
-
In the Parameters window, enter the following information:
-
Plans List
-
Create Plan Attribute Groups
-
Create Plan Hierarchy Attribute Group
-
Publish/Reset Plan
-
From Date
-
-
Choose OK.
-
Choose Submit Request. Use the Concurrent Requests Summary window to verify that the concurrent program completed successfully.
Running the Full Load Graph
Once you have run the full load graph in accordance with the Installing Oracle E-Business Suite Information Discovery, Release 12.2 V8 document (Doc ID: 2214431.1), attribute configuration is loaded for all seeded attributes. Additionally, you need to run the following full data loads as follows:
To run a full Endeca Refresh on the Integrator Server
-
Login to Integrator server using your Clover login
-
Click the Scheduling tab.
-
Select the New Schedule link.
-
Enter a Description for the scheduler, for example, Quality Full Load Scheduler.
-
Select Periodic as the Type.
-
Select by interval as the Periodicity.
-
Enter a start date and time in the Not active before date/time field.
-
Enter an end date and time in the Not active after date/time field.
-
Enter a value in the Interval (minutes) field.
-
Ensure you select the Fire misfired event as soon as possible check box.
-
Select Execute graph from the Task Type list.
-
Select qa-quality from the Sandbox list.
-
Select graph/FullLoadConfig.grf from the Graph list.
-
Click Create to set the scheduler.
Setting Up the Scheduler to Load Incremental Graphs
Once you have run the full load graph in accordance with the Installing Oracle E-Business Suite Information Discovery, Release 12.2 V8 document (Doc ID: 2214431.1), attribute configuration is loaded for all seeded attributes. For incremental refresh, you must determine how often the Endeca data should be refreshed from EBS depending upon your organizational requirements. Oracle recommends that you keep this near real time. As the data is updated in the EBS, you need to ensure it is updated in the endeca MDEX server. You set up the Scheduler to load incremental graphs depending on the volume of information requiring update.
To set up the schedule:
-
Login to Integrator server using your Clover login.
-
Click the Scheduling tab.
-
Select the New Schedule link.
-
Enter a Description for the scheduler, for example, Quality Incremental Load Scheduler.
-
Select Periodic as the Type.
-
Select by interval as the Periodicity.
-
Enter a start date and time in the Not active before date/time field.
-
Enter an end date and time in the Not active after date/time field.
-
Enter a value in the Interval (minutes) field.
-
Ensure you select the Fire misfired event as soon as possible check box.
-
Select Execute graph from the Task Type list.
-
Select qa-quality from the Sandbox list.
-
Select graph/IncrementalLoadConfig.grf from the Graph list.
-
Click Create to set the scheduler.
ETL Parameters for Oracle Quality Information Discovery Plus
You can load data to the qa data store by running the graphs provided by Quality Information Discovery.
To load data to the qa data store:
-
Using the URL for the EID Integrator Server, navigate to the Sandboxes page and expand the graph node. The Quality Information Discovery sandbox is qa.
-
Graphs to load data include:
-
FullLoadConfig.grf - This graph is executed only once for the first time when Quality Endeca is set up This graph would further call FullLoad.grf from common api which Inserts Audit Record, Init Datastore, Reset Datastore, Loads the FND config from the Endeca FND tables for Attributes and Groups etc.
-
LoadDataFull.grf - This graph calls the LoadTaxonomy1.grf, loads collection data for the plans published and LoadViewDefinitions.grf is called to load the views at studio.
-
LoadTaxonomy1.grf - This graph loads the taxonomy data by querying the QA_ENDECA_TAX_TAB table.
-
LoadViewDefinitions.grf - This graph loads EQL view definitions to the studio.
-
IncrementalLoadConfig.grf - This graph is executed for all subsequent data loads except the first time. IncrDataSetup processes all the metadata and collection data that need to be published and IncrementalLoad.grf loads this attribute metadata.
-
LoadDataIncr.grf - This graph calls the LoadTaxonomyForIncrLoad.grf to update the plan hierarchy data, loads collection data for the plans published along with respective attribute metadata.
-
LoadTaxonomyForIncrLoad.grf - This graph loads the delta Taxonomy data from the previous run.
-
Views and Joins in Oracle Quality Information Discovery Plus
The following views are used by the ETL layer in Oracle Endeca to load and display Oracle Quality Information Discovery Plus data to the Oracle Endeca data store:
-
QA_RESULTS_ENDEA_V - this view is used by Endeca layer to query Quality data.