Oracle Contract Renewal Command Center Plus
Overview
Oracle Contract Renewal Command Center Plus helps drive customer and partner loyalty, improve operational efficiency, and ensures that the return on investments of your customers and your organization are balanced. Using Oracle Contract Renewal Command Center Plus, you can:
-
Align decision making and enhance collaboration in an organization to achieve the best outcome.
-
Provide context to users when making decisions to ensure alignment of objectives and customer interests.
-
Track progress towards objectives and provide a prescriptive course of action to achieve those objectives.
-
Provide insight required to evaluate options and select the best business outcomes.
Each command center area and page is organized to support specific business outcomes. Oracle Contract Renewal Command Center Plus is a dashboard-driven product comprised of the following pages:
Customer Management Page - Drives customer loyalty, improves customer renewals, and increases share of the customer.
Portfolio Management Page - Balances Return on Investment (ROI) between customers and organization.
Vendor Management Page - Drives partner loyalty, removes obstacles for sales, and manages partner cash flow.
Contract Management Pages - Contains two separate pages for Lease and Finance Contract Management and Service Contract Management. These pages drive operational efficiency and provide context for implementing transactions in OLFM and OKS.
You can search using Oracle Contract Renewal Command Center Plus pages and Endeca Information Discovery (EID) design tools. These pages are hosted in an EID environment, and called from new container pages in EBS.
This chapter provides product-specific details required to integrate Endeca Information Discovery (EID) with Oracle E-Business Suite Release 12.2 V8 for the Oracle Contract Renewal Command Center Plus application. This supplements information provided in Installing Oracle E-Business Suite Information Discovery, Release 12.2 V8 (Doc ID: 2214431.1). You must read this document and make note of the requirements before you begin your installation.
Oracle Contract Renewal Command Center Plus User Interfaces
Customer Management Page
Use the Customer Management page to better understand customers and improve your relationships. The Customer Management page also helps to drive customer loyalty through repurchase decisions that include renewals, extensions, and new business. This page can help to drive more business by understanding up-sell and cross-sell opportunities to customers across their portfolio of Finance and Service Contracts that they have with you. You can monitor factors that create customer satisfaction and dissatisfaction, contract cancellation and renewal, and factors that result in increased or decreased share. The Customer Management page includes the following high-level information:
-
Customer
-
Contracts (Finance and Service Contracts)
-
Assets
-
Vendors
-
Service Requests
-
Receivables
-
Investment
From the Customer Management page you can view customer information metrics, charts, and results tables. The following is a partial display of the Customer Management Page.
From the Lease Super User responsibility, navigate to the Customer Management page:
(N) Renewals > Customer Management
From the Service Contracts Manager responsibility, navigate to the Customer Management page:
(N) Renewal Command Center > Customer Management
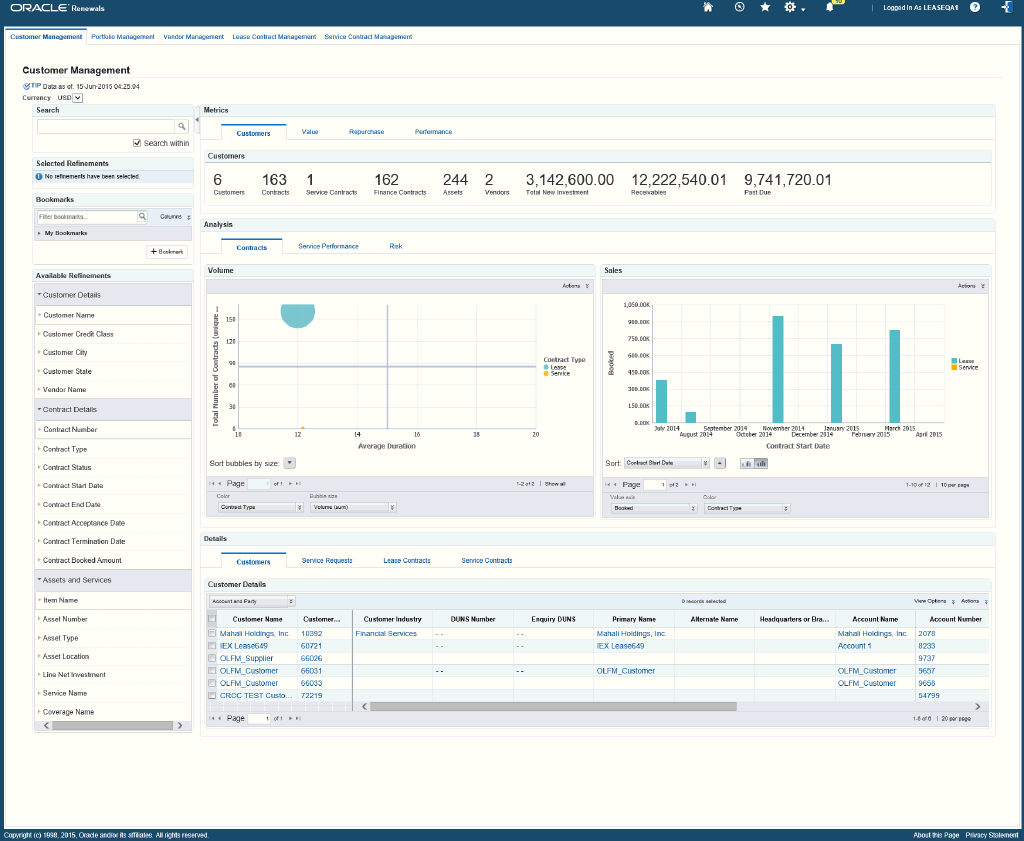
Within the Customer Management page, you can analyze data using metrics, charts, graphs, and tables. The following describes the Customer Management page regions and components:
| Region | Components |
|---|---|
Advanced Search
|
The Advanced Search component includes value search, record search, Boolean search, and partial search capabilities. You can submit keyword searches and the application provides type-ahead suggestions and displays attribute values that match the typed text. When you perform a search, the search term is added to the Selected Refinements component. As you type, you may be prompted to select a matching attribute value, or simply search for the entered text.
Additional Information: See the Advanced Search Capabilities appendix in this guide for details. |
| Selected Refinements | The Selected Refinements component displays all values that you have selected to filter data, and allows you to quickly make adjustments to the current refinement by removing items or clearing all filters from the list. |
| Bookmarks | The Bookmarks component allows you to save a given navigation and component state and return to it at a later time. |
| Available Refinements | The Available Refinements component allows you to filter data based on the currently available values or value ranges for selected attributes that are displayed within attribute groups. Expand the following attribute groups to view and select attribute names:
|
| Metrics (tabbed component container) | The Metrics tabbed component container contains four metrics tabs:
|
| Analysis (tabbed component container) Contracts (tab) |
Volume (chart) The Volume chart displays the total number and the average duration of service contracts and lease contracts.
Sales (chart) The Sales chart displays the amount booked by year for service contracts and lease contracts.
|
| Analysis (tabbed component container) Service Performance (tab) |
Service Request Analysis (chart) The Service Request Analysis chart displays the number of service requests filed in each period.
|
| Analysis (tabbed component container) Risk (tab) |
Receivables (chart) The Receivables chart displays the measure of due and open receivables in aging buckets. The chart is empty until the user selects a currency.
Volume Segmentation (chart) The Volume Segmentation chart displays segmentation of NIV for active contracts as of the latest date and current period. The chart is empty until the user selects a currency.
|
| Details (tabbed component container) Customers (tab) |
Customer Details (results table)
|
| Details (tabbed component container) Service Requests (tab) |
Service Requests (results table)
|
| Details (tabbed component container) Lease Contracts (tab) |
Headers (results table)
Asset Lines (results table)
|
| Details (tabbed component container) Service Contracts (tab) |
Headers (results table)
Service Lines (results table)
|
Portfolio Management Page
The Portfolio Management page helps to ensure that the value for your customers is balanced with the value of your investment and risk. The information in the Portfolio Management page helps you benchmark the profitability and value between customers, contracts, assets, and sections of your portfolio, and determine the return on investment. The following is a partial display of the Portfolio Management Page.
From the Lease Super User responsibility, navigate to the Portfolio Management page:
(N) Renewals > Portfolio Management
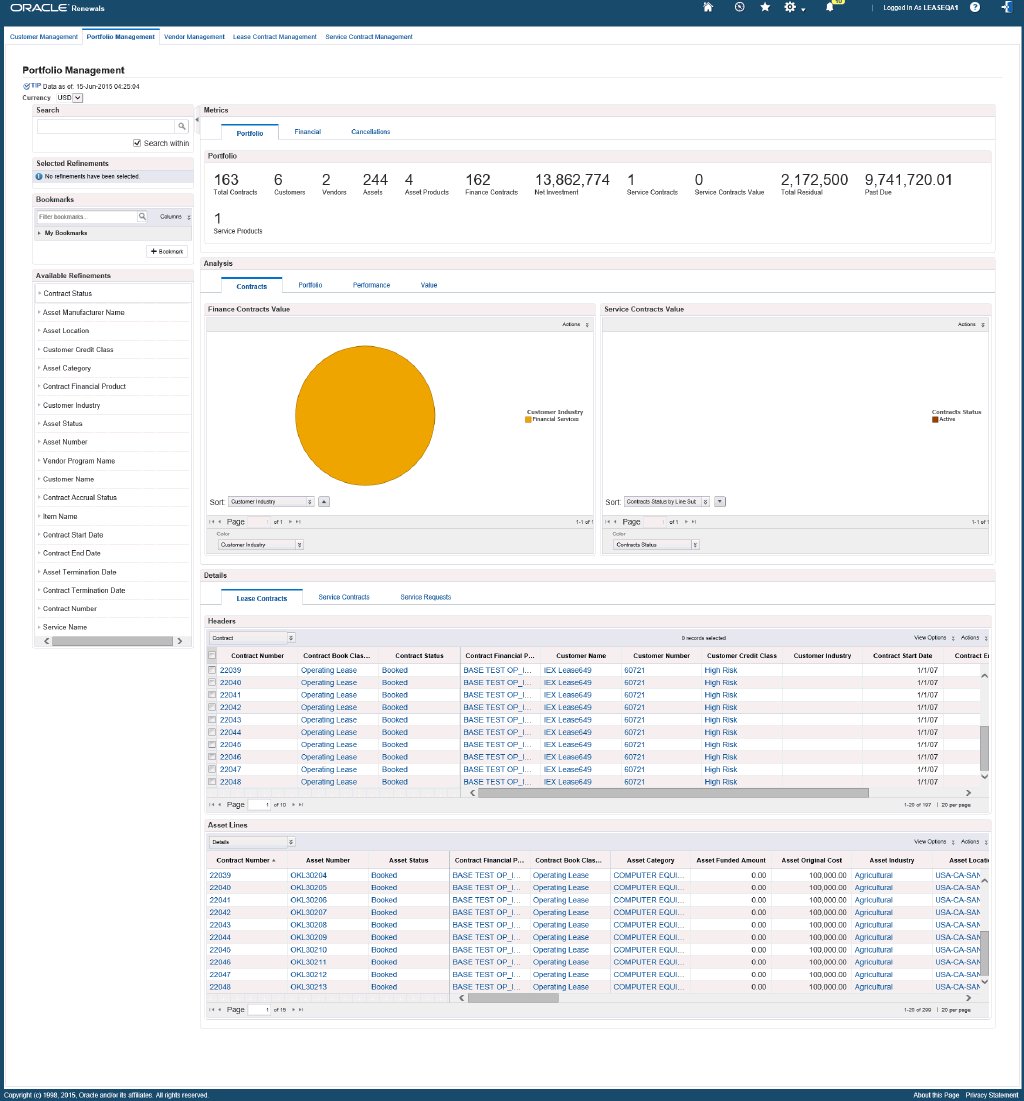
Within the Portfolio Management page, you can analyze data using metrics, charts, graphs, and tables. The following describes the Portfolio Management page regions and components:
| Region | Components |
|---|---|
Advanced Search
|
The Advanced Search component includes value search, record search, Boolean search, and partial search capabilities. You can submit keyword searches and the application provides type-ahead suggestions and displays attribute values that match the typed text. When you perform a search, the search term is added to the Selected Refinements component. As you type, you may be prompted to select a matching attribute value, or simply search for the entered text.
Additional Information: See the Advanced Search Capabilities appendix in this guide for details. |
| Selected Refinements | The Selected Refinements component displays all values that you have selected to filter data, and allows you to quickly make adjustments to the current refinement by removing items or clearing all filters from the list. |
| Bookmarks | The Bookmarks component allows you to save a given navigation and component state and return to it at a later time. |
| Available Refinements | The Available Refinements component allows you to filter data based on the currently available values or value ranges for selected attributes that are displayed within attribute groups. Expand the following attribute groups to view and select attribute names:
|
| Metrics (tabbed component container) | The Metrics tabbed component container contains three metrics tabs:
|
| Analysis (tabbed component container) Contracts (tab) |
Finance Contracts Value (chart) The Finance Contracts Value chart displays the NIV of active contracts as of the latest date (current period).
Service Contracts Value (chart) The Service Contracts Value chart displays the sum of future and expected payments for the current contract term of active contracts.
|
| Analysis (tabbed component container) Portfolio (tab) |
Sales Analysis (chart) The Sales Analysis chart displays the number of contracts and contract volume booked (including renewals) of current active contracts.
Sales and Terminations (chart) The Sales and Terminations chart displays the volume booked and the volume cancelled or terminated over the last twelve months. For finance contracts, volume cancelled is the NIV of terminations (with or without return). For service contracts the volume cancelled or terminated is the sum of cancellation or termination amounts.
|
| Analysis (tabbed component container) Performance (tab) |
Asset Performance (chart) The Asset Performance Analysis chart displays service requests and the trend of service requests over the last 12 months.
Service Performance Analysis (chart) The Service Performance Analysis chart displays the trend of time to resolution of service requests over the last 12 months.
|
| Analysis (tabbed component container) Value (tab) |
Yields (chart) The Yields chart displays the distribution of contract yields across active contracts as of the current period and latest date.
|
| Details (tabbed component container) Lease Contracts (tab) |
Headers (results table)
Asset Lines (results table)
|
| Details (tabbed component container) Service Contracts (tab) |
Headers (results table)
Service Lines (results table)
|
| Details (tabbed component container) Service Requests (tab) |
Service Requests (results table)
|
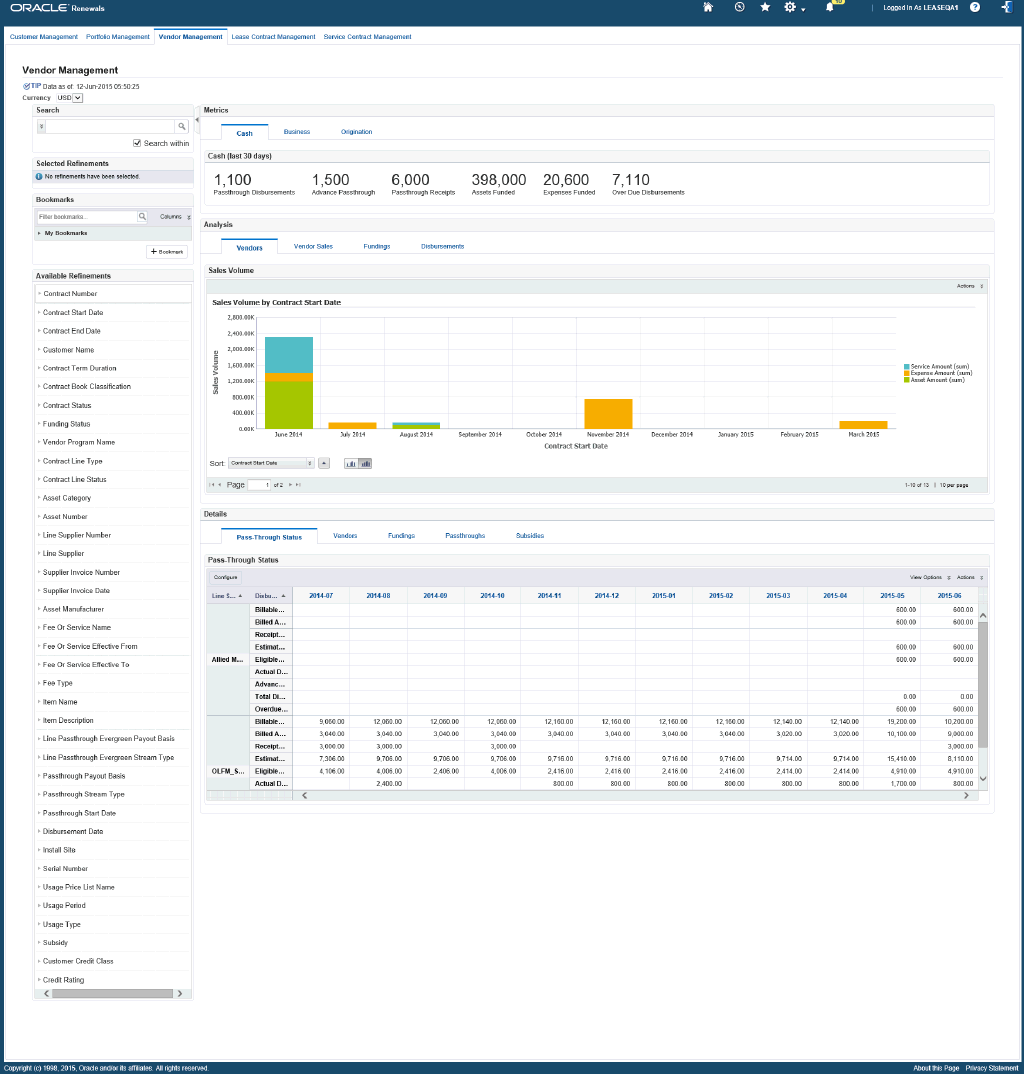
Vendor Management Page
The Vendor Management dashboard helps to drive partner loyalty. For those who use indirect sales models, this is the primary tool to help you drive business with your vendor and helps you to manage their cash flow. The Vendor Management page is organized around the following key activities:
-
Exceptions – Alerts are provided that guide users to critical actions that need to be taken to address time sensitive issues.
-
Charts – graphs, charts, metrics, and tables help users identify work and decisions that are critical to address.
-
Metrics – graphs, charts, metrics, and tables help users understand the overall state of relationships with vendors in the context of OLFM and service contract transactions.
From the Vendor Management page you can view vendor and partner information using metrics, charts, and results tables. The following is a partial display of the Vendor Management Page.
From the Lease Super User responsibility, navigate to the Vendor Management page:
(N) Renewals > Vendor Management
Within the Vendor Management page, you can analyze data using metrics, charts, graphs, and tables. The following describes the Vendor Management page regions and components:
| Region | Components |
|---|---|
Advanced Search
|
The Advanced Search component includes value search, record search, Boolean search, and partial search capabilities. You can submit keyword searches and the application provides type-ahead suggestions and displays attribute values that match the typed text. When you perform a search, the search term is added to the Selected Refinements component. As you type, you may be prompted to select a matching attribute value, or simply search for the entered text.
Additional Information: See the Advanced Search Capabilities appendix in this guide for details. |
| Selected Refinements | The Selected Refinements component displays all values that you have selected to filter data, and allows you to quickly make adjustments to the current refinement by removing items or clearing all filters from the list. |
| Bookmarks | The Bookmarks component allows you to save a given navigation and component state and return to it at a later time. |
| Available Refinements | The Available Refinements component allows you to filter data based on the currently available values or value ranges for selected attributes that are displayed within attribute groups. Expand the following attribute groups to view and select attribute names:
|
| Metrics (tabbed component container) | The Metrics tabbed component container contains three metrics tabs:
|
| Analysis (tabbed component container) Vendors (tab) |
Sales Volume (chart) The Sales Volume chart displays the volume sold over each period.
|
| Analysis (tabbed component container) Vendor Sales (tab) |
Sales Trend (chart)
Sales (chart) The Sales chart displays the number of customers over the past-due pass-through disbursement amounts over the last twelve months.
|
| Analysis (tabbed component container) Fundings (tab) |
Asset Funding (chart) The Asset Funding chart displays trends of asset funded Amounts for contracts booked in the period.
Expense Funding (chart) The Expense Funding chart displays trends of expense funded amounts for contracts booked in the period.
|
| Analysis (tabbed component container) Disbursements (tab) |
Passthrough Status (chart) The Passthrough Status chart displays the pass-through disbursement status for the past 12 months.
Funding Analysis (chart) The Funding Analysis chart displays the aging of past-due disbursements by funding type in each aging bucket.
|
| Details (tabbed component container) Pass-Through Status (tab) |
Pass-Through Status (results table) The Pass-Through Status results table displays the pass-through disbursement data over the past 12 months
|
| Details (tabbed component container) Vendors (tab) |
Vendors (results table) The Vendors results table displays the vendor details and metrics for volume booked over the last 12 months.
|
| Details (tabbed component container) Fundings (tab) |
Fundings (results table) The Fundings results table displays the asset, expense and advance disbursement fundings completed over the last 12 months.
|
| Details (tabbed component container) Passthroughs (tab) |
Passthroughs (results table) The Passthroughs results table displays the pass-through disbursement data over the last 12 months by supplier and contract.
|
| Details (tabbed component container) Subsidies (tab) |
Subsidies (results table) The Subsidies results table displays subsidies that were applied to contracts over the last 12 months.
|
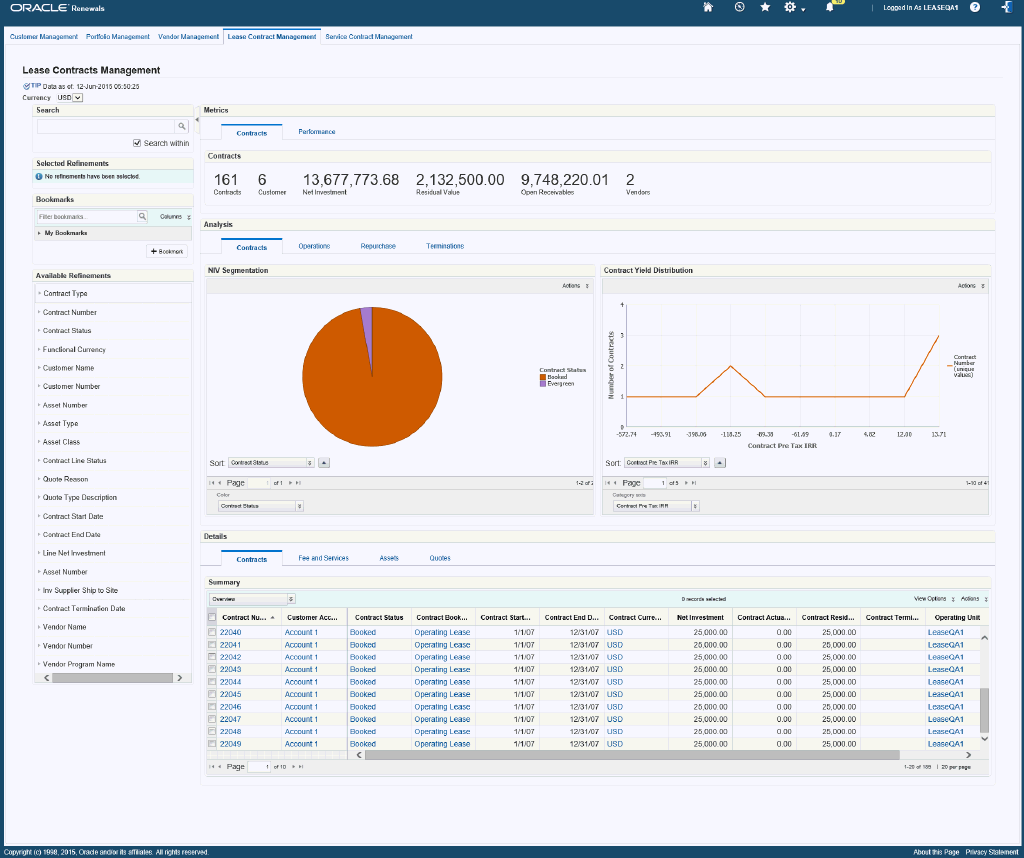
Lease Contract Management Page
The Lease Contract Management page provides information to better manage your lease contracts. The information from this page helps to increase operational efficiency by identifying exception situations that require immediate attention, and provides insights to help you take action. The Lease Contract Management page is organized around the following key activities:
-
Exceptions – Alerts are provided that guide users to critical actions that need to be taken to address risks to the contract.
-
Workload Balance – graphs, charts, metrics, and tables help users identify decisions that are critical to address.
-
Metrics – graphs, charts, metrics, and tables.
From the Lease Contract Management page you can view information using metrics, charts, and results tables. The following is a partial display of the Lease Contract Management Page.
From the Lease Super User responsibility, navigate to the Lease Contract Management page:
(N) Renewals > Lease Contract Management
Within the Lease Contract page, you can analyze data using metrics, charts, graphs, and tables. The following describes the Lease Contract Management page regions and components:
| Region | Components |
|---|---|
Advanced Search
|
The Advanced Search component includes value search, record search, Boolean search, and partial search capabilities. You can submit keyword searches and the application provides type-ahead suggestions and displays attribute values that match the typed text. When you perform a search, the search term is added to the Selected Refinements component. As you type, you may be prompted to select a matching attribute value, or simply search for the entered text.
Additional Information: See the Advanced Search Capabilities appendix in this guide for details. |
| Selected Refinements | The Selected Refinements component displays all values that you have selected to filter data, and allows you to quickly make adjustments to the current refinement by removing items or clearing all filters from the list. |
| Bookmarks | The Bookmarks component allows you to save a given navigation and component state and return to it at a later time. |
| Available Refinements | The Available Refinements component allows you to filter data based on the currently available values or value ranges for selected attributes that are displayed within attribute groups. Expand the following attribute groups to view and select attribute names:
|
| Metrics (tabbed component container) | The Metrics tabbed component container contains two metrics tabs:
|
| Analysis (tabbed component container) Contracts (tab) |
NIV Segmentation (chart) The NIV Segmentation chart displays segmentation NIV of active contracts (Booked and Evergreen contracts).
Contract Yield Distribution
|
| Analysis (tabbed component container) Operations (tab) |
Rebooks (chart) The Rebooks chart displays the source of rebooks that occurred over the last periods.
Rebook Analysis (chart) The Rebook Analysis chart displays the evolution of rebooks by NIV across periods.
|
| Analysis (tabbed component container) Repurchase (tab) |
Repurchases (chart) The Repurchases chart displays the number of assets by days to end of term (EOT).
Quotes (chart) The Quotes chart displays the number of approved and accepted quotes by days to expiration or days to End of Term (EOT) within a calendar year.
|
| Analysis (tabbed component container) Terminations (tab) |
Termination and Repurchase (chart) The Termination and Repurchase chart displays NIV of terminated and expired assets, and gain/loss on terminations.
Termination Trend (chart) The Termination Trend Chart displays evolution of NIV of terminated or expired contracts, and gain/loss on termination.
|
| Details (tabbed component container) Contracts (tab) |
Summary (results table)
|
| Details (tabbed component container) Fee and Services (tab) |
Contract Lines (results table)
|
| Details (tabbed component container) Assets (tab) |
Asset Lines (results table)
|
| Details (tabbed component container) Quotes (tab) |
Quotes (results table)
|
Service Contract Management Page
The Service Contract Management page provides information to manage and prioritize service contracts for renewal. The Service Contract Management page is organized around the following key activities:
-
Exceptions – alerts are provided that guide users to prioritize actions that are required to address renewal risk.
-
Workload Balance – graphs, charts, metrics, and tables help users identify contracts that are critical to prioritize, monitor progress on renewal cycle, and provide insight into renewal performance.
From the Service Contract Manager responsibility, navigate to the Service Contract Management page:
(N) Renewal Command Center > Service Contract Management
From the Lease Super User responsibility, navigate to the Service Contract Management page:
(N) Renewals > Service Contract Management
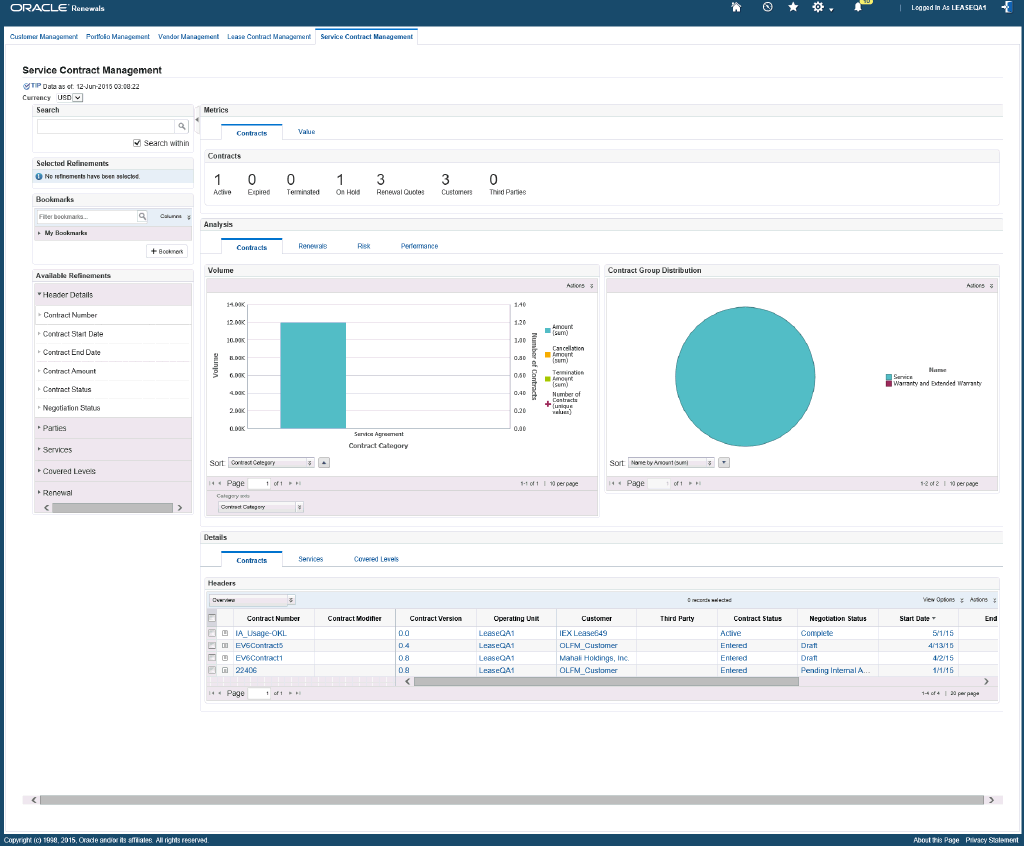
Within the Service Contract page, you can analyze data using metrics, charts, graphs, and tables. The following describes the Service Contract Management page regions and components:
| Region | Components |
|---|---|
Advanced Search
|
The Advanced Search component includes value search, record search, Boolean search, and partial search capabilities. You can submit keyword searches and the application provides type-ahead suggestions and displays attribute values that match the typed text. When you perform a search, the search term is added to the Selected Refinements component. As you type, you may be prompted to select a matching attribute value, or simply search for the entered text.
Additional Information: See the Advanced Search Capabilities appendix in this guide for details. |
| Selected Refinements | The Selected Refinements component displays all values that you have selected to filter data, and allows you to quickly make adjustments to the current refinement by removing items or clearing all filters from the list. |
| Bookmarks | The Bookmarks component allows you to save a given navigation and component state and return to it at a later time. |
| Available Refinements | The Available Refinements component allows you to filter data based on the currently available values or value ranges for selected attributes that are displayed within attribute groups. Expand the following attribute groups to view and select attribute names:
|
| Metrics (tabbed component container) | The Metrics tabbed component container contains two metrics tabs:
|
| Analysis (tabbed component container) Contracts (tab) |
Volume (chart) The Volume chart displays total contract amount (sum) by contract category.
Contract Group Distribution The Contract Distribution chart displays contract volume and percentage by contract groups.
|
| Analysis (tabbed component container) Renewals (tab) |
Renewal Aging (chart) The Renewal Aging chart displays the contract amount that is available for renew versus the amount for which the quotes have been created and are under negotiation, classified by due days to end of term.
Quotes (chart) The Quotes chart displays contract volume and percentage by negotiation status.
|
| Analysis (tabbed component container) Risk (tab) |
Renewal Leakage (chart) The Renewal Leakage chart displays contract volume and percentage by cancellation reason, termination reason, and service name.
Value vs Risk (chart) The Value vs Risk chart displays the contract value rating and risk rating by contract status or negotiation status. The chart also displays the number of contracts by bubble size.
|
| Analysis (tabbed component container) Performance (tab) |
Renewal Trend (chart) The Renewal Trend chart displays contract amount, cancellation amount, termination amount (optionally by contract categories) rolling up by fiscal year.
|
| Details (tabbed component container) Contracts (tab) |
Headers (results table)
|
| Details (tabbed component container) Services (tab) |
Services (results table)
|
| Details (tabbed component container) Covered Levels (tab) |
Covered Levels (results table)
|
Oracle Contract Renewal Command Center Plus Product Configuration
Setting Up Oracle Contract Renewal Command Center Plus
Oracle Contract Renewal Command Center Plus product configuration setup must be completed after the installation and common configurations are completed as described in Oracle E-Business Suite Information Discovery Globalization Guide, Release 12.2 V8 (Doc ID: 2214432.1).
Setup and Configuration Steps
Setup and Configuration Steps
To set up Oracle Contract Renewal Command Center Plus, you must complete the following steps:
-
Setting Access Control by assigning UMX roles and updating access grants.
-
Setting Profile Options to ensure appropriate data is loaded for analysis.
-
Loading Oracle Contract Renewal Command Center data to the Data Domain by running graphs provided.
-
Scheduling Setup for incremental data loads and full data refresh.
Setting Access Control
Based on the roles and responsibilities of the different business users, access to the Oracle Contract Renewal Command Center Plus dashboards are set up using the Role Based Access Control (RBAC) feature of Oracle E-Business Suite.
Oracle Contract Renewal Command Center Plus includes the following menu and functions to access the various dashboards.
Under OKL_SUPER_USER_MENU (Lease Super User Menu):
| Sub Menu Code | Function Code | Function Name |
|---|---|---|
| OKL_CRCC_HYBRID (CRCC Hybrid Menu) | OKL_CRCC_ENDECA_CUSTOMER_PG | CRCC: Customer Management Page |
| OKL_CRCC_ENDECA_PORTFOLIO_PG | CRCC: Portfolio Management Page | |
| OKL_CRCC_ENDECA_VENDORS_PG | CRCC: Vendor Management Page | |
| OKL_CRCC_ENDECA_OKL_CNT_PG | CRCC: Lease Contract Management Page | |
| OKL_CRCC_ENDECA_OKS_PG | CRCC: Service Contract Management Page |
Under OKS_MANAGER_TOP_LEVEL_MENU_R12 (OKS Manager Top level menu):
| Sub Menu Code | Function Code | Function Name |
|---|---|---|
| OKS_COMMAND_CENTER_R12 | OKS_CRCC_ENDECA_CUST_PG | OKS CRCC Endeca Customer Page |
| OKS_ENDECA | CRCC Service Contracts Management Page |
The following roles have been seeded for Oracle Contract Renewal Command Center Plus:
| Role Name | Internal Code Name |
|---|---|
| CRCC Lease Access Role | UMX|OKL_CRCC_ENDECA_ACCESS_ROLE |
| CRCC Service Access Role | UMX|OKS_ENDECA_ACCESS_ROLE |
The following are the permission sets created to control access to each of the dashboards in CRCC:
| Permission Sets | Internal Code Name |
|---|---|
| CRCC Customer Permission Set | OKL_CRCC_CUSTOMER_PS |
| CRCC Lease Contracts Permission Set | OKL_CRCC_ENDECA_OKL_CNT_PS |
| CRCC Portfolio Permission Set | OKL_CRCC_PORTFOLIO_PS |
| CRCC Vendors Permission Set | OKL_CRCC_VENDORS_PS |
| CRCC Service Contract Permission Set | OKS_ENDECA_ACCESS_PS |
| CRCC Customer Permission Set (Service Only) | OKS_CRCC_ENDECA_CUST_PS |
The following are the grants to the seeded roles:
| Grant Name | Description | Permission Set | Security Context Grantee |
|---|---|---|---|
| CRCC Customer Grant | CRCC Customer Grant | CRCC Customer Permission Set | CRCC Lease Access Role |
| CRCC Portfolio Grant | CRCC Portfolio Grant | CRCC Portfolio Permission Set | CRCC Lease Access Role |
| CRCC Lease Contracts Grant | CRCC Lease Contracts Grant | CRCC Lease Contracts Permission Set | CRCC Lease Access Role |
| CRCC Vendors Grant | CRCC Vendors Grant | CRCC Vendors Permission Set | CRCC Lease Access Role |
| CRCC Service Contracts Grant | CRCC Service Contracts Grant | CRCC Service Contracts Permission Set | CRCC Lease Access Role |
| OKS_ENDECA_ACCESS_GRANT | CRCC Service Contracts Grant | CRCC Service Contracts Permission Set | CRCC Service Access Role |
| OKS_ENDECA_CUST_GRANT | CRCC Service Customer Grant | CRCC Customer Permission Set (Service Only) | CRCC Service Access Role |
Oracle recommends that you use and add 'CRCC Lease Access Role' (Internal Code Name: UMX|OKL_CRCC_ENDECA_ACCESS_ROLE) with Lease Super User Responsibility, and 'CRCC Service Access Role' (Internal Code Name: UMX|OKS_ENDECA_ACCESS_ROLE) with Service Contracts Manager responsibility to grant access to menu items of CRCC. The roles can also be used with custom responsibilities using the same menu.
If you want to use the above access roles with more than one responsibility, then you must add an additional grant with a security context corresponding to each responsibility. You can add grants for a given role as a separate process while you are adding the role to the responsibility. For assigning UMX roles and grants, refer to Appendix C in Oracle E-Business Suite Information Discovery Globalization Guide, Release 12.2 V8 (Doc ID: 2214432.1).
Profile Options for Oracle Contract Renewal Command Center Plus
You must set the following profile options:
| Profile Option Name | Description |
|---|---|
| Enable CRCC for Oracle Lease Management | This profile option enables you to load the Finance contracts into the okl-oks-crcc data domain to view customer management and portfolio management dashboard. |
| Enable CRCC for Oracle Service Contracts | This profile option enables you to load the Service contracts into the okl-oks-crcc data domain to view customer management and portfolio management dashboard. |
| OKS: Contract Extraction Reference Date | This profile option specifies the reference date from which expired, terminated, and canceled service contracts are to be loaded during a full load. This does not govern active contracts. |
| OKL: CRCC EXTRATION FROM DATE | This profile option specifies the reference date from which expired and terminated finance contracts are to be loaded during a full load. This does not govern active contracts. |
Loading Data into the Data Domain for Oracle Contract Renewal Command Center Plus
Clover ETL graphs within Endeca server queries data source Views in E-Business suite and does a full data load to the appropriate data domain. The first data load must be a full load where the required data for analysis is loaded, and from there on the changed data is incrementally loaded on a periodic basis according to business requirements. Incremental data load updates the changed records in Oracle E-Business Suite to the data domain as of the last load. After the successful data load, the Oracle Contract Renewal Command Center Plus pages can be viewed.
Data Domains and Data Sources for Oracle Contract Renewal Command Center Plus
Data sources are defined in the data domain and are used to query data for different pages in Oracle Contract Renewal Command Center Plus. The following data domains and data sources are included with Oracle Contract Renewal Command Center Plus:
| Data Domain Name | Data Source Name | Purpose |
|---|---|---|
| okl-oks-crcc | okl-oks-crcc | Holds data that is common between Finance and Service Contracts. The Customer Management and Portfolio Management pages utilize the data in this data domain. |
| okl-crcc | okl-crcc | Holds data that is specific to Finance Contracts. The Vendor Management and Lease Contract Management pages utilize the data in this data domain |
| oks-crcc | oks-contract | Holds data that is specific to Finance Contracts. The Vendor Management and Lease Contract Management pages utilize the data in this data domain |
You can load data by running the ETL graphs provided under the CRCC sandboxes okl-oks-crcc, okl-crcc, and oks-contract.
To load data to the data domains
-
Using the URL for the EID Integrator Server, navigate to the Sandboxes page and expand the graph node under any of the above sandboxes.
-
Graphs to load data include:
-
Full.grf: This graph loads the metadata and data from the appropriate views to the corresponding CRCC data domain on the Endeca server.
-
Incremental.grf: Incremental data load will update changed records in EBS to the data domain since the last successful load. It will also load any new records since the last load.
Note: Data deleted in EBS will not be removed from Endeca by running Incremental Graph. You must complete a full refresh by running the Full.grf graph to remove all the data from Endeca and then reload the required data.
Refer to Oracle E-Business Suite Information Discovery Globalization Guide, Release 12.2 V8 (Doc ID: 2214432.1) for more information on data upload into the Endeca server.
-
Setting Up the Scheduler for Data Loads
After the initial data upload, depending on your organization requirements, you can determine how often the incrementally changed data from Oracle E-Business Suite must be loaded into the appropriate data domain. You can also schedule periodic full refresh which deletes all data from data domain and repopulates the required data.
To schedule a data load job in the Integrator
-
Login to the Integrator server using your Clover login.
-
Click the Scheduling tab.
-
Select the New Schedule link.
-
Enter a Description for the scheduler.
-
Select Periodic as the Type.
-
Select by interval as the Periodicity.
-
Enter a start date and time in the Not active before date/time field.
-
Enter an end date and time in the Not active after date/time field.
-
Enter a value in the Interval (minutes) field.
-
Ensure you select the Fire misfired event as soon as possible check box.
-
Select Start a graph from the Task Type list.
-
12. Select the appropriate Sandbox and the graph for schedule to run. I.e. Full.grf/Incremental.grf.
-
Click Create to set the scheduler.
Views for Oracle Contract Renewal Command Center Plus
The following views are used to load Oracle Contract Renewal Command Center data to the Data Domain:
| View Name | Purpose |
|---|---|
| OKS_K_REPRT_ENDECA_V | This is the view which retrieves Service Contract information such as the header, lines, and covered level. This feeds the primary data for the oks-crcc data domain. |
| OKS_ENDECA_CONTRACT_COMN_V | This is the view which retrieves Service Contract information such as header, lines, and invoice details. This feeds the primary data for the okl-oks-crcc data . |
| OKS_ENDECA_PARTIES_V | This view is used to obtain the service contract party related information. This is used in the okl-oks-crcc data domain. |
| OKL_ENDECA_CONTRACTS_V | This view retrieves the contract level information of Finance Contracts. This is used in both okl-oks-crcc and okl-crcc data domains. |
| OKL_ENDECA_PARTIES_V | This view is used to obtain the finance contract party related information. This is used in the okl-oks-crcc data domain. |
| OKL_ENDECA_SRS_V | This view is used to obtain Service Request information relating to customers that have either a service contract or a finance contract. This is used in the okl-oks-crcc data domain. |
| OKL_ENDECA_QUOTES_V | This view is used to obtain the information relating to Middle-of-Term and End-of-Term quotes associated with Finance Contracts. This is used in the okl-crcc data domain. |
| OKL_ENDECA_TCS_V | This view is used to load the information relating to the terms and conditions of finance contracts. This is used in the okl-crcc data domain. |
| OKL_ENDECA_REBOOK_V | This view is used to obtain the information of re-booked Finance Contracts. This is used in the okl-crcc data domain. |
| OKL_ENDECA_VENDORS_V | This view is used to obtain the cash flow information relating to vendors associated with Finance Contracts. This is used in the okl-crcc data domain. |