Observers
This section provides information to help you administer Business Transaction Management observers and includes the following subsections:
About Observers
Observers are Business Transaction Management components that you install into the application server of business applications you want to monitor. The observers monitor messages and calls between the components of your business applications.
Observers contain one or more subcomponents called probes. Each probe provides the observer with the capability of monitoring a particular type of business component. The monitoring capabilities of an observer are, therefore, dependent on the collection of probes that it contains.
The following table lists the types of observers provided by Business Transaction Management, the probes contained within each observer, and the monitoring capabilities conferred on the observer by each of the probes.
Table 11-1 Available observers, the probes they contain, and the types of components they monitor.
| Observer | Probe | Components Monitored |
|---|---|---|
|
JavaEE |
EJB |
Enterprise JavaBean (EJB) |
|
- |
JAVA |
Java (monitors local Java method calls) |
|
- |
JAXRPC |
JAX-RPC (includes monitoring of JMS traffic that uses the JAX-RPC API) |
|
- |
JAXWS |
JAX-WS (includes monitoring of JMS traffic that uses the JAX-WS API) |
|
- |
JDBC |
JDBC (monitors Java database calls) |
|
- |
JMS |
JMS (monitors traffic that uses the JMS API) |
|
- |
RMI |
Remote method invocation (RMI) |
|
- |
WEB_APP |
Java servlet application |
|
OSB |
OSB |
Oracle Service Bus Proxy and Business Services |
|
Oracle SOA Suite |
SOA_ADAPTER |
Oracle SOA Suite Adapter (this probe is provided only in the observer for Oracle Service Bus 10g) |
|
- |
SOA_BIZRULE |
Oracle SOA Suite Business Rule |
|
- |
SOA_BPEL |
Oracle SOA Suite Business Process Execution language (BPEL) |
|
- |
SOA_BPMN |
Oracle SOA Suite Business Process Modelling Notation (BPMN) |
|
- |
SOA_CALLBACK |
Callback requests of asynchronous calls |
|
- |
SOA_DIRECT |
Direct binding calls between SOA composites and between SOA and OSB |
|
- |
SOA_EDN |
Oracle SOA Suite Event Delivery Network |
|
- |
SOA_MEDIATOR |
Oracle SOA Suite Mediator |
|
- |
SOA_SPRING |
Oracle SOA Suite Spring Bean |
|
- |
SOA_WORKFLOW |
Oracle SOA Human Workflow components and notifications |
|
- |
SOA_WS |
Oracle SOA Suite web service (including Human Workflow web services) |
|
- |
SOA_WSA |
Oracle SOA Suite web service adapter |
|
- |
WEB_APP |
Java servlet application |
|
Oracle Fusion Applications (supports ADF-UI, ADF-BC and SOA deployments) |
ESS |
Oracle Enterprise Scheduling Service |
|
- |
All probes found in the JavaEE observer except for the JDBC probe |
Refer to the entry for the JavaEE observer |
|
- |
All probes found in the SOA Suite observer |
Refer to the entry for the SOA Suite observer |
|
Universal |
All probes found in the JavaEE, OSB, Oracle SOA Suite, and Oracle Fusion Applications observers |
Refer to the entries for the JavaEE, OSB, Oracle SOA Suite, and Oracle Fusion Applications observers. |
|
WCF |
WCF |
Microsoft WCF services |
|
Oracle Enterprise Gateway (OEG) |
OEG |
Web services fronted by an OEG Web Services Proxy |
Note:
For a complete and up-to-date list of the types of services and components that Business Transaction Management can discover and monitor, refer to the Business Transaction Management Certification Matrix. You can locate this document by searching for “BTM certification” online athttp://support.oracle.com.A single observer installation can monitor any number of components that are running in the application server, as long as the observer contains the appropriate probes.
Observers communicate with the Business Transaction Management sphere by way of another Business Transaction Management component called the monitor. One of the jobs of the monitor is to distribute configurations to the observers. When an observer starts up, it contacts the monitor and obtains a configuration. The observer periodically polls the monitor for updates to its configuration.
The observer configuration is generated from an Observer Communication policy. By default, a preconfigured Observer Communication policy is applied to all monitors (this default policy is named Observer Communication Policy - Default). This policy configures the monitors to which it is applied and also provides those monitors with an observer configuration that, by default, they distribute to all of their associated observers. You can edit this default policy and/or apply your own.
Once running, the observers measure various aspects of your business applications' message and/or call flow, such as throughput, fault count, and response time (for a complete list of measurements, see Chapter 5, "About Instruments"). The observers periodically send these measurements to the monitor for analysis and eventual storage in a database, as shown in the following diagram:
Figure 11-1 Example of deployed observer showing probes.
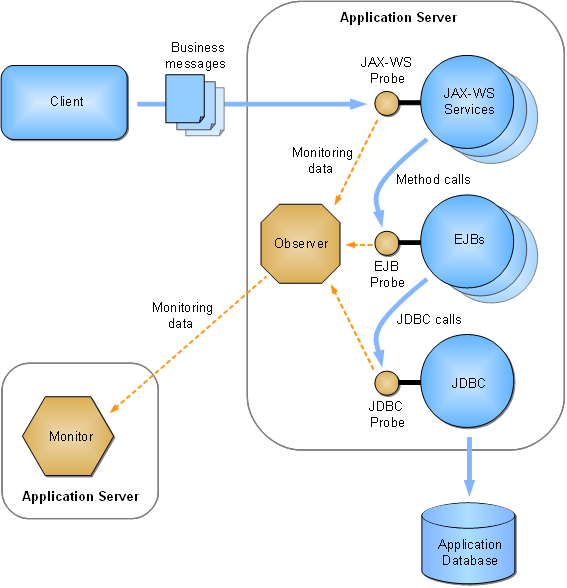
Description of "Figure 11-1 Example of deployed observer showing probes."
If configured to do so, the observers convert the various types of messages and calls into standardized XML-formatted messages for the purposes of message logging and further analysis. The observers forward these messages to the monitor. Note that these messages are copies, and that the original messages/calls are never altered or redirected.
Observers are installed into your business component's application server, and clients continue to access the business component in the same way as before the observer was installed. You can install any number of monitors and any number of associated observers per monitor, but observers are never installed in the application server hosting the Business Transaction Management central servers or monitors.
For an overview of the entire Business Transaction Management system, see Architectural Overview. For information about scaling up your monitoring system by replicating the monitors, refer to the Business Transaction Management Installation Guide.
Configuring the Observer and Monitor
The Observer Communication policy sets up communication between observers and a monitor or monitor group. By default, this policy configures both monitors and observers by:
-
setting up the observer-to-monitor communication channel
-
configuring the runtime settings for the observer
Prior to release 12.1.0.4, you could apply only a single Observer Communication policy to any one monitor, which meant that all observers associated with the same monitor would receive the same configuration. To provide greater flexibility in configuring observers, release 12.1.0.4 introduces the ability to apply multiple Observer Communication policies to a single monitor and to then target each of these policies at a different observer or set of observers. In such a scenario, you designate one (and only one) policy as being used for configuring the monitor, and you designate all of the remaining policies as being used only for configuring observers. The policy that configures the monitor can also be used for configuring observers, if you so desire. For more information on this topic, see Targeting Observers.
By default, a preconfigured Observer Communication policy is applied to all monitors registered in the system. This default policy is preconfigured to target all associated observers. If necessary, you can edit this default policy and/or create new policies.
To edit the default Observer Communication policy instance:
-
Select Administration > System Policies in the Navigator.
-
Select Observer Communication Policy - Default in the summary area (in previous releases, this policy is named Default Observer Communication Policy).
-
Choose Modify > Edit Definition for Observer Communication Policy - Default.
To create a new instance of an Observer Communication policy:
Choose Admin > Create System Policy > Observer Communication.
Common Tasks
The following are common configuration tasks you can perform using this policy:
-
Enabling/Disabling Drilldowns from Real User Experience Insight
-
Request Monitoring and Operation Modeling for the WEB_APP Probe
-
You can find information related to the following and other advanced tasks in the Advanced Settings Field Reference table in Advanced Settings Field Reference:
-
Logging observed messages and observer errors (see the Observer Troubleshooting entry)
-
Adjusting message size and queue behavior on the observer (see the Observer Message entry)
-
Adjusting message size and queue behavior on the monitor (see the Monitor Message Queue entry)
-
Controlling how SOA, OSB, JMS, and local EJB components are modeled (see the Model Configuration entry)
-
Enabling JDBC Summary Mode, in which observations of related JDBC calls are aggregated and sent to the monitor as a single observation message (see the JDBC Summary entry)
-
Activating and Deactivating Probes
Observers contain different types of probes for monitoring the various types of components that make up your business applications. You can use this policy to individually activate or deactivate probes that are installed on your system (any particular probe is considered to be installed if it is contained within an observer that is installed on your system). By default, all probes in a newly created policy except JAVA and RMI are activated.
Notes:
The JAVA probe monitors local Java calls, which in most cases is not needed and can be distracting because of the typically large number of local Java calls that occur. In order to use the JAVA probe, you must first deploy and configure it. For information about deploying and configuring the JAVA probe, enter a service request at My Oracle Support (support.oracle.com).In most situations, you should leave the RMI probe deactivated. Most applications utilize RMI by way of higher level APIs, such as JAX-RPC, JAX-WS, EJB, and JMS. In such cases, it is better to activate only the probes for these higher-level components. However, if your application makes RMI calls directly you might want to activate the RMI probe.
There is no need to explicitly deactivate probes that are not installed—neither for the sake of performance nor for any other reason (uninstalled probes are inherently not activated). The only reason to deactivate a probe is if: (1) the probe is installed, AND (2) you do not want to monitor the type of business component the probe monitors. Furthermore, you must deactivate (or activate) the SOA Suite probes as a group (the SOA Suite probes are SOA_ADAPTER, SOA_BIZRULE, SOA_BPEL, SOA_BPMN, SOA_CALLBACK, SOA_EDN, SOA_MEDIATOR, SOA_SPRING, SOA_WS, and SOA_WSA).
The Active Probes section of the policy provides an Enable Discovery and Monitor Upon Discovery checkbox for each type of probe.
Select the Enable Discovery checkbox to activate the discovery mechanism for the associated component type. Components of that type are then discovered and displayed in the Management Console the next time they receive a message or call.
Select the Monitor Upon Discovery checkbox for a component type if you want to immediately begin monitoring components of that type as they are discovered.
Note:
If you enable discovery but not monitoring and then later edit the policy and enable monitoring, the system will not begin monitoring previously discovered components. The system will begin monitoring only the components discovered after you enable monitoring. For information on enabling monitoring for previously discovered components, see Start and Stop Monitoring of Endpoints.Adding Probes
After upgrading Business Transaction Management, you might have new types of probes available for your monitoring purposes. However, the upgrade process does not automatically add these new probes to your existing Observer Communication policies. In order to use a new probe in an existing policy, you must manually add it to the policy as follows:
-
Select Administration > System Policies in the Navigator.
-
Select your policy in the summary area.
-
Choose Modify > Edit Definition for My_Policy, where My_Policy is the name of your policy.
-
Scroll to the bottom of the Active Probes section and click [add probe].
The cursor should now be inserted into an empty text field.
-
With the cursor already inserted into the empty text field, click into the text field.
A drop list opens that contains the names of all probe types.
-
Choose the probe type that you want to add.
-
Edit the settings of the Enable Discovery and Monitor Upon Discovery checkboxes as needed (refer to Activating and Deactivating Probes for descriptions of these fields).
-
Click Apply.
Setting up the Observer-to-Monitor Communication Channel
The default Observer Communication policy sets up direct communication between the observer and monitor. Direct communication allows you to use multiple singleton monitors, with each monitor collecting observations from multiple observers.
If you intend to replicate the monitor by placing a load balancer in between the observers and a group of replicated monitors, you must set the values of the following fields in the Communication Channel section as indicated:
| Field Name | Value |
|---|---|
| Communication path | If your observers will communicate through a load balancer to a monitor group, choose Through router to monitor group. This choice displays the following fields in the policy |
| Router IP address | Specify the IP address of the load balancer that will receive the observation messages. |
| Router port number | Specify the port number on which the load balancer will receive the observation messages.
Note: You must also configure this port on your router. |
| Monitor port number | Specify the port number on which the monitors will receive the forwarded observation messages. |
For more information on this topic, refer to the Business Transaction Management Installation Guide.
Configuring SSL on the Observation Message Flow
The default Observer Communication policy sets up a secure socket connection that is used for sending observation messages from the observer to the monitor. If you prefer to use a nonsecured socket for this connection, disable the policy's Enable SSL checkbox.
With SSL enabled, the monitor is required to authenticate itself to the observer. By default, the SSL connection uses built-in, preconfigured security stores. If you want to use your own security stores, disable the Use Default Stores checkbox and fill in the additional fields using information from the following table:
Note:
If you are using .NET-based observers, you must deploy a certificate to the machines hosting the observers in order to use an SSL connection. If you are using the default stores, use the preconfigured certificate located at nanoagent\config\ssl\server.cer in the observer installation directory. Refer to the Business Transaction Management Installation Guide for more information on deploying the preconfigured certificate.| Field Name (boldface denotes a section name) | Description |
|---|---|
| Protocol | Required if displayed. Select the SSL protocol. Choices are TLSv1, SSLv3, or Any. SSLv3 is not supported by the .NET observers. This field configures both monitors and observers. |
| Use Default Stores | This checkbox is enabled by default.
Leave this checkbox enabled if you want to use the built-in, preconfigured security stores. In this case, you are finished if you are using Java-based observers only. If you are using .NET-based observers, you must also deploy a preconfigured certificate to the machines hosting the observers. You can find the preconfigured certificate at nanoagent\config\ssl\server.cer in the observer installation directory. Refer to the Business Transaction Management Installation Guide for more information on deploying the preconfigured certificate. Disabling this checkbox displays additional fields and permits you to specify your own security stores. |
| Monitor | ---------- This is a section label----------
The following five fields pertain to the monitor's key store. All of the following fields are displayed only if the Use Default Stores checkbox is disabled. |
| Key Store Location | Required if displayed. Specify the location of the monitor's SSL key store. You can specify this location as either an absolute path, if the key store file is local to your monitor, or as an HTTP(S) URL, if the file is accessible by HTTP GET.
The initial value when you open a new policy is AP-MONITOR-SSL:DefaultKeyStore.ks. This value points to the built-in, preconfigured key store located at WEB-INF/ssl/DefaultKeyStore.ks in the btmmonitor.war deployment. |
| Key Store Password | Required if displayed. Specify the password for accessing the SSL key store. |
| Key Store Type | Required if displayed. Specify the type of JCE (Java Cryptographic Extensions) key store for the monitor to use, for example, JKS, JCEKS, or PKCS12. The initial value is JKS. |
| Key Name | Required if displayed. Specify the certificate and private key. You can enter a key alias or a certificate attribute of the form CN=value, UID=value, etc. |
| Key Password | Required if displayed. Specify the password for accessing the certificate and private key. If unspecified, the password for the key store is used. |
| Auto-Dispatch Trust Store to Java Observers | If this checkbox is enabled, the monitor will serialize the trust store, and automatically send it to all associated Java observers. This option is ignored for .NET observers. This checkbox is disabled by default. |
| Auto-Dispatch Java Trust Store | ---------- This is a section label ----------
The following three fields pertain to the auto-dispatched trust store and are displayed only if the Auto-Dispatch Trust Store to Java Observers checkbox is enabled. |
| Trust Store Location | Required if displayed.
Specify the location of the SSL trust store that the monitor will dispatch to Java observers. You can specify this location as either an absolute path, if the trust store file is local to your monitor, or as an HTTP(S) URL, if the file is accessible by HTTP GET The initial value when you open a new policy is AP-MONITOR-SSL:DefaultTrustStore.ks. This value points to the built-in, preconfigured trust store located at WEB-INF/ssl/DefaultTrustStore.ks in the btmmonitor.war deployment. |
| Trust Store Password | Required if displayed. Specify the password for accessing the SSL trust store that the monitor will dispatch to Java observers. |
| Trust Store Type | Required if displayed. Specify the type of JCE (Java Cryptographic Extensions) trust store that the monitor will dispatch to Java observers, for example, JKS, JCEKS, or PKCS12. The initial value is JKS. |
| Java Observer | ---------- This is a section label ----------
The following three fields pertain to manually installed trust stores and are displayed only if the Auto-Dispatch Trust Store to Java Observers checkbox is disabled. |
| Trust Store Location | Required if displayed.
Specify the location of the SSL trust store to be used by observers deployed to Java execution environments. You can specify this location as either an absolute path, if the trust store file is local to your observer, or as an HTTP(S) URL, if the file is accessible by HTTP GET. The initial value when you open a new policy is AP-OBSERVER-SSL:DefaultTrustStore.ks. This value points to the built-in, preconfigured trust store located at nanoagent\config\ssl\DefaultTrustStore.ks in the observer installation directory. |
| Trust Store Password | Required if displayed. Specify the password for accessing the SSL trust store. |
| Trust Store Type | Required if displayed. Specify the type of JCE (Java Cryptographic Extensions) trust store that the monitor will dispatch to Java observers, for example, JKS, JCEKS, or PKCS12. The initial value is JKS. |
Configuring Observer Authentication
The default Observer Communication policy requires the observer to authenticate itself to the monitor each time it establishes a connection. You can adjust this setting by way of the Observer Authentication field. You can turn observer authentication off by setting the field to None.
You can also require the observer to authenticate itself each time it sends a message to the monitor by setting the field to Use Message Authentication. Note, however, that the use of message authentication can significantly degrade performance. You should use this setting only when necessary. For example, if your observer sends its messages to a monitor group whose load balancer is configured for per-message balancing (rather than per-connection), then you cannot use connection authentication. In this case, you must set this field to either None or Use Message Authentication.
Note:
The Observer Authentication field is displayed only if the Enable SSL field is enabled. Disabling the Enable SSL field disables observer authentication as well as the SSL connection.Targeting Observers
New functionality provided with release 12.1.0.4 gives you greater flexibility in configuring observers. In prior releases, you could apply only a single Observer Communication policy to any one monitor. The monitor then generated a single observer configuration from this policy and distributed it to all of its associated observers (you associate an observer to a monitor at installation time by providing the observer with the monitor's location).
As of release 12.1.0.4, you can apply multiple Observer Communication policies to a single monitor and then target each of these policies at a different observer or set of observers (the observers you target must be associated with the monitor). The following steps describe the procedure for targeting observers:
Note:
The order of these steps is intended to help you understand the concepts involved in targeting observers. However, when you actually perform the task, it is most efficient to complete all the steps in one policy and then move on to the next policy.-
Designate one policy as the source for generating the monitor's configuration by leaving the Generate Configuration for Observers Only checkbox disabled (we'll refer to this policy as the “monitor policy”).
The “monitor policy” generates the monitor configuration and also one observer configuration.
-
Apply as many additional policies to the monitor as you require for configuring your observers (we'll refer to these policies as “observer policies”).
-
Designate each “observer policy” as a source for generating only an observer configuration by enabling the Generate Configuration for Observers Only checkbox.
-
Ensure that the values of all the other fields in the Communication Channel section of each “observer policy” matches the values in the “monitor” policy.
-
-
Target your “observer policies” at specific observers.
-
Use the Configuration Label and/or Observer Base Address fields to specify which observers you want to target with the observer configuration (for more information about these and related fields, refer to Observer Configuration Labels and Field Reference for Targeting Observers).
-
Ensure that labels and addresses specified in one “observer policy” are not specified in any other policy that is applied to the same monitor (for additional information, see Rejection of Observer Communication Policies).
-
Optional – Enable the Validate Addresses checkbox to ensure that all targeted observers are known to Business Transaction Management.
If you target an unknown observer and enable this field, the policy will be rejected. If you want to target an observer that is not currently known but will be later, you should disable this field.
-
Optional – (Do not enable this checkbox if you apply the policy to multiple monitors.) Enable the Enforce to Monitor field to validate that all the targeted observers are associated with the monitor to which you apply the policy.
-
-
Optional – Leave one policy untargeted to serve as the default observer configuration for all observers associated with the monitors to which the policy is applied.
An untargeted policy serves as the default configuration for observers that are not specifically targeted by another policy. You could, for example, leave the “monitor policy” untargeted and use it as a default observer configuration. If you attempt to create a second untargeted policy, the second policy will be rejected (for information about rejected policies, see Rejection of Observer Communication Policies).
Note:
If you configure different monitors (or groups of monitors) using different policies, you can define a different default observer configuration for each.
As in previous releases, you can use a single policy for configuring monitors and all of their associated observers, if you desire (in other words, you don't have to target specific observers). In such a scenario, you would use a “monitor policy” that is not targeted at specific observers. This policy will generate a default observer policy, and, since no specific observers are targeted, all observers associated with the monitors will receive this default configuration.
Observer Configuration Labels
An observer configuration label is a simple text string that conceptually identifies a set of observers (for example, CONFIG_LABEL_MY_OBSERVERS). You target an observer by specifying either a label or the absolute address of the application server in which the observer is deployed (for example, http://my_host.com:7011). You can specify any number of labels and/or addresses, and target any number of observers in a single policy.
Labels enable you to group observers logically rather than physically for configuration purposes. Applying a label is a two-step procedure that you can perform in either order:
-
In the application server that hosts the observer, create a system property named ap.nano.config.label and set its value to your label string (refer to the Business Transaction Management Installation Guide for details on how to do this).
-
Set the Configuration Label field of the Observer Communication policy that you will use to configure your observer to the same value as ap.nano.config.label.
Rejection of Observer Communication Policies
There are a numbers of ways, related to the targeting of observers, in which you might inadvertently cause an Observer Communication policy to be rejected. All of the following scenarios will cause a policy to be rejected:
-
Attempting to apply more than one untargeted policy (default observer configuration) to the same monitor
-
Attempting to specify the same observer configuration label in two different policies that are applied to the same monitor
-
Attempting to specify the same observer base address in two different policies that are applied to the same monitor
Labels are scoped to the monitor to which a policy is applied. This means that you can reuse a particular label name across policies if the policies are applied to different monitors, but you cannot reuse a label name across policies applied to the same monitor. This scoping principle also pertains to untargeted policies.
If a policy is rejected, select the policy in the work area of the console and display the Targets tab. This tab provides information about the cause of a rejected policy.
Order of Precedence
The order of precedence that determines which configuration an observer will receive is as follows:
-
Observer base address
If a policy specifies the observer's base address, then the observer will receive the configuration generated by that policy.
-
Observer configuration label
If a policy specifies the observer's configuration label and no policy specifies the base address, then the observer will receive the configuration generated by the policy that specifies the configuration label.
-
Untargeted policy
If a an untargeted policy exists and no policy specifies the observer's base address or configuration label, then the observer will receive the configuration generated by the untargeted policy.
Preconfigured Observer Communication Policies
Business Transaction Management provides a number of Observer Communication policies that are preconfigured for monitoring particular types of applications. You can edit any of these policies and tailor them to your monitoring needs. The name of each policy is displayed in bold, followed by a description:
-
Observer Communication Policy - Default
This policy generates both a monitor configuration and an untargeted (default) observer configuration. By default, this policy is applied to all monitors in the system. The observer configuration is distributed to all associated observers that are not specifically targeted by a different policy.
-
Observer Communication Policy - Fusion Applications
This policy generates only an observer configuration. By default, this policy is applied to all monitors in the system. The observer configuration is targeted at observers tagged with the label CONFIG_LABEL_FAPPS. This configuration activates probes and adjusts observer runtime settings for monitoring Oracle Fusion Application components.
-
Observer Communication Policy - JavaEE
This policy generates only an observer configuration. By default, this policy is applied to all monitors in the system. The observer configuration is targeted at observers tagged with the label CONFIG_LABEL_JAVAEE. This configuration activates probes and adjusts observer runtime settings for monitoring JavaEE components.
-
Observer Communication Policy - OSB
This policy generates only an observer configuration. By default, this policy is applied to all monitors in the system. The observer configuration is targeted at observers tagged with the label CONFIG_LABEL_OSB. This configuration activates probes and adjusts observer runtime settings for monitoring Oracle Service Bus components.
-
Observer Communication Policy - SOA
This policy generates only an observer configuration. By default, this policy is applied to all monitors in the system. The observer configuration is targeted at observers tagged with the label CONFIG_LABEL_SOA. This configuration activates probes and adjusts observer runtime settings for monitoring Oracle SOA components.
Field Reference for Targeting Observers
Enabling/Disabling Drilldowns from Real User Experience Insight
You can control the ability of users to perform user-interface drilldowns from Oracle Enterprise Manager Real User Experience Insight into Business Transaction Management. By default, drilldown capability is enabled. To disable or re-enable drilldown capability, set the WEB_APP probe's rueiPresent attribute as described in Request Monitoring and Operation Modeling for the WEB_APP Probe.
Request Monitoring and Operation Modeling for the WEB_APP Probe
The WEB_APP probe lets you monitor web applications that are implemented as Java servlets. This probe provides a generic form of processing that can be used with all types of Java servlets and a specialized form of processing optimized for use with Oracle Application Development Framework (ADF) applications. This section refers to these different types of processing as rulesets. The generic type of processing is referred to as the URL ruleset, and the type of processing used for ADF applications is referred to as the ADF ruleset. The probe defaults to the URL ruleset.
Unless configured otherwise, the WEB_APP probe monitors all requests to the web applications in the monitored application server. In many cases, however, you might not want to monitor all requests. For example, you might not want to monitor requests for static resources such as image and HTML files. For this reason, the default Observer Communication policy is configured not to monitor requests for resources that have the following file extensions: jpg, jpeg, html, htm, css, gif, png, ico, js, swf, cur. This selective monitoring is specified by way of a snippet of XML configuration code that appears in the default policy's WEB_APP probe configuration field.
You can edit this default XML configuration code in order to control the types of requests that are monitored. You can also add XML elements to control how your application's operation names are abbreviated for display in the Management Console (operation names are derived from request URLs). The following table describes the XML elements and attributes that you can use in your configuration code. Usage examples are provided after the table.
Note:
Ordering of the XML elements is critical. The required ordering of the elements is described in the table. Incorrect ordering will cause the policy to be rejected.| Element | Attribute | Description | Supported rulesets |
|---|---|---|---|
| servletObserver | - | Encompassing tag containing configuration information for all applications monitored by the WEB_APP probe. There is only one <servletObserver> element. | ADF URL |
| - | rueiPresent | Indicates that Oracle Enterprise Manager Real User Experience Insight is installed in front of the monitored applications. This attribute controls the ability of users to perform user-interface drilldowns from Real User Experience Insight into Business Transaction Management.
Valid values: true or false. The default setting is true. When this attribute is set to true, Business Transaction Management adds headers to the HttpResponse, thereby enabling drilldown capability. To disable drilldown capability, set this attribute to false. |
ADF URL |
| - | rueiMatches | Indicates that the Real User Experience Insight naming scheme matches the Business Transaction Management naming scheme. Valid values: true or false. | ADF URL |
| globalExcludeList | - | Use this element to globally exclude specified URLs from monitoring. You can specify URLs to exclude by file type, context root, pattern matching, or length.
Element ordering: If used, you must place this element as the first child of the <servletObserver> element. There can be only one per <servletObserver>. |
ADF URL |
| - | ext | Contains a comma-delimited list of file extensions, for example, ext="html, htm, jpg, css". Files of the specified types are excluded from monitoring. | ADF URL |
| - | contextRoot | Contains a comma-delimited list of context roots, for example, contextRoot="console, medrec, bookmart". URLs containing any of the specified context roots are excluded from monitoring.
To specify a blank context root, use "/", for example, contextRoot="console, /, bookmart". |
ADF URL |
| - | pathPattern | Contains a comma-delimited list of URL patterns. URLs that match any of the specified patterns are excluded from monitoring. Wild cards are allowed and denoted using “*”.
Notes on pattern matching (applies to both the pathPattern and pattern attributes):
|
ADF URL |
| - | pathLength | Positive integer. URLs that exceed this number of characters are excluded from monitoring.
Characters in the protocol, host name, port number, and query string are not included in the count. The section of the URL that this attribute operates on is the same as for the pathPattern attribute. |
ADF URL |
| application | - | Denotes an application to be monitored.
Element ordering: This element is a child of the <servletObserver> element. It must not precede the <globalExcludeList> or <globalAdfOptions> elements. There can be any number per <servletObserver> element. |
ADF URL |
| - | contextRoot | The context root of the monitored application. The value of this attribute is used as the service name. To specify a blank context root, use “/”, for example contextRoot=”/”. | ADF URL |
| framework | - | This element is used to specify which URLs should be handled by which ruleset by way of the <include> child element.
Element ordering: If used, you must place this element as the first child of the <application> element. There can be one for each ruleset type per <application> element. |
ADF URL |
| - | type | Specifies the ruleset that should handle the <include> URL patterns. Valid values are ADF and URL. For ADF web applications, set this attribute to ADF. For other web applications, set this attribute to URL. The requests processed by each ruleset are mutually exclusive.
If no <framework> tag is specified, the probe defaults to the URL ruleset. If a <framework> tag is specified, then there is no default value. |
ADF URL |
| include | - | This element allows you to exclude all requests except those that match the given wild card expression when mapping a request to a ruleset.
You cannot use this element to include previously excluded URLs. For example, if you used <globalExcludeList> to exclude the “png” extension, you cannot override that exclusion by specifying “*.png” in the <include> element. Element ordering: This element is a child of the <framework> element. There can be many per <framework> element. |
ADF URL |
| - | pattern | The URL pattern to match. Wild cards are allowed and denoted using “*”.
This attribute follows the same pattern matching rules as the pathPattern attribute. Refer to the <globalExcludeList> element's pathPattern attribute for information on these rules. |
ADF URL |
| excludeList | - | Use this element to specify file types within a particular application that you want to exclude from monitoring. This element overrides the <globalExcludeList> element for a specific application.
Element ordering: This element is a child of the <application> element. It must not precede any <framework> elements and must precede all <adfOptions> and <operationRule> elements. There can be only one per <application> element. |
ADF URL |
| - | ext | Contains a comma-delimited list of file extensions, for example, "html, htm, jpg, css". Files of the specified types (within the parent application) are excluded from monitoring.
If the you want to monitor all file types in the application but the ext attribute of the <globalExcludeList> element is set, then set this ext attribute to the null string (for example: ext=""). |
ADF URL |
| adfOptions | - | Use this element to partition operations within a particular application by appending property values contained in the ADF UI request parameter oracle.adf.view.rich.monitoring.UserActivityInfo to the operation name. In order to use this feature, the UserActivityInfo request parameter must be enabled (see Enabling the UserActivityInfo Request Parameter). The attributes of this element correspond to properties in the UserActivityInfo request parameter. The attributes control whether the property values are appended to the operation name. The property values are appended only if they exist in the request parameter.
Element ordering: This element is a child of the <application> element. It must not precede any <framework> or <excludeList> elements and must precede all <operationRule> elements. There can be only one per <application> element. |
ADF URL |
| - | appendRegionViewId | Set this attribute to true to append the value of the regionViewId property to the operation name using the format __regionViewId. The default setting is false. | ADF URL |
| operationRule | - | This element specifies the parts of the URL for which a unique combination of values will constitute an operation. Use this element to abbreviate the operation name that is derived from the URL.
Element ordering: This element is a child of the <application> element. It must not precede any <framework>, <excludeList>, or <adfOptions> elements. There can be only one per <application> element. |
ADF URL |
| - | excludeDirectories | Contains a comma-separated list of directory levels to exclude from the operation name. For example, you could exclude “/faces” or the session ID. Note that the context-root is not considered a directory level. Also, the excludeDirectories count starts with “1”, not “0”. | ADF URL |
| paramGroup | - | Use this element to partition operations by multiple request parameters. You specify the request parameters by adding <partitionByParam> elements as children of this element. Partitioning occurs only if all specified parameters exist in the request. The parameter names and values are appended to the operation name in this format:
_name1_value1__name2_value2__name3_value3
Notice that there are two underscore characters between each name-value pair. This element can contain a maximum of three <partitionByParam> elements. Note: Using this element to partition an operation that is used in an existing transaction definition changes the semantics of the transaction. For example, requests that contain the specified parameter will not be counted as requests for the original operation and, therefore, will not be counted as belonging to the transaction. You might need to update the definition of your transaction accordingly. Element ordering: If used, you must place this element as the first child of the <operationRule> element. There can be multiple <paramGroup> elements. This element must precede all stand-alone <partitionByParam> elements (that is, those that are not children of a <paramGroup> element). |
ADF URL |
| partitionByParam | - | This element partitions an operation based on the value of the specified request parameter. Each unique parameter value is modeled as a separate operation. The parameter can be either a URL parameter or a POST parameter.
For example, assume we have an orderApplication.jsp that takes a parameter named action. Normally, requests to orderApplication.jsp would be modeled as requests to a single operation named orderApplication.jsp. However, if we use <partitionByParam> and partition by the action parameter, all requests to orderApplication.jsp that contain an action parameter will be modeled as requests to an operation named orderApplication.jsp_action_paramValue, where paramValue is the value of the action parameter. And, importantly, requests containing an action parameter will not be counted as requests to the operation orderApplication.jsp. (See also, "Example 2 – Adding a parameter name/value pair to an operation name".) Note: Using this element to partition an operation that is used in an existing transaction definition changes the semantics of the transaction. For example, requests that contain the specified parameter will not be counted as requests for the original operation and, therefore, will not be counted as belonging to the transaction. You might need to update the definition of your transaction accordingly. Element ordering: If used, you can place this element in two positions:
There can be any number per <operationRule> element. If you want to use a single <partitionByParam> element before a <paramGroup>, place it inside of its own <paramGroup> element. Note: This element does not support ADF page input parameters. |
ADF URL |
| - | name | The name of the parameter to use for partitioning requests. Each distinct value of the given parameter corresponds to its own operation. The parameter is appended to the operation name as “_name_value”, where name is the name of the parameter and value is its value. | ADF URL |
| secureParam | - | This element represents a URL or POST parameter whose value should be kept hidden or not get stored at all (for example, a password), both in operation names and in Business Transaction Management messages.
Element ordering: This element is a child of the <operationRule> element. It must not precede any <paramGroup> or <partitionByParam> elements. There can be any number per <operationRule> element. |
ADF URL |
| - | name | The name of the parameter whose value should be hidden or not stored at all. | ADF URL |
Notes:
(1) Service and operation names are derived from the request URL. In order to conform to XML standards, the probe substitutes an underscore symbol (“_”) in place of special characters such as slashes, question marks, and equal signs (“/”, “?”, “=”).
(2) Service and operation names are shortened if they exceed 255 bytes. This shortening is performed by truncating the name to 252 bytes, and then appending “…” to it.
(3) Processing for the pathLength attribute occurs before the processing for the pathPattern attribute. Service and operation name shortening occurs at the end of processing. The complete order of execution is as follows:
-
The pathLength attribute of the <globalExcludeList> element
-
The contextRoot attribute of the <globalExcludeList> element
-
The pathPattern attribute of the <globalExcludeList> element
-
The ext attribute of the <excludeList> element if it exists
Otherwise:
The ext attribute of the <globalExcludeList> element
-
The include elements within the <framework> element
-
Service and operation name shortening
Example 1 – Abbreviating an operation name
<ap:servletObserver xmlns:ap="http://namespace.amberpoint.com/amf">
 <ap:application contextRoot="/mywebshop">
  <ap:operationRule excludeDirectories="1, 2" />
 </ap:application>
</ap:servletObserver>
The preceding configuration code applied to this request URL:
http://secure.banking.de:7001/mywebshop/shopping/s28373/basket/checkout.jsp
produces the following objects in Business Transaction Management:
| Object | Value | Explanation |
|---|---|---|
| Service | mywebshop | The service name is the value of the contextRoot attribute. |
| Endpoint | http://secure.banking.de:7001/mywebshop | The endpoint is the physical location of the monitored web application plus the service name (the value of the contextRoot attribute). |
| Operation | basket_checkout.jsp | By default, the operation name consists of the directories and filename from the request URL. In this case, the default operation name would be shopping/s28373/basket/checkout.jsp. However, because the <operationRule> element's excludeDirectories attribute is set to "1, 2", the first and second directories (shopping/s28373/) are excluded. |
Example 2 – Adding a parameter name/value pair to an operation name
<ap:servletObserver xmlns:ap="http://namespace.amberpoint.com/amf">
 <ap:application contextRoot="/physician">
  <ap:operationRule>
   <ap:partitionByParam name="lastName"/>
  </ap:operationRule>
 </ap:application>
</ap:servletObserver>
The preceding configuration code applied to this request URL:
http://stbdm02:7011/physician/physicianSection/viewRecordSummary.action
with a POST parameter of "lastName=Einstein", produces the following objects in Business Transaction Management:
| Object | Value | Explanation |
|---|---|---|
| Service | physician | The service name is the value of the contextRoot attribute. |
| Endpoint | http://stbdm02:7011/physician | The endpoint is the physical location of the monitored web application plus the service name (the value of the contextRoot attribute). |
| Operation | physicianSection_viewRecordSummary.action_lastName_Einstein | The name and value of the parameter specified by the <partitionByParam> element is appended to the default operation name. |
Example 3 – Filtering requests and applying rulesets
<ap:servletObserver xmlns:ap="http://namespace.amberpoint.com/amf">
 <ap:application contextRoot="/em">
  <ap:framework type="ADF">
   <ap:include pattern="*/faces*"/>
  </ap:framework>
  <ap:framework type="URL">
   <ap:include pattern="*/console*" />
  </ap:framework>
  <ap:operationRule excludeDirectories="1, 2" />
 </ap:application>
</ap:servletObserver>
The preceding configuration code applied to these request URLs:
 http://myhost:17861/em/faces/ocamm/managers/ocammHome
 http://myhost:17861/em/console/all/targets/search
 http://myhost:17861/em/em2go/about.jsp
produces the following objects in Business Transaction Management:
| Object | Value | Explanation |
|---|---|---|
| Service | em | The service name is the value of the contextRoot attribute. |
| Endpoint | http://myhost:17861/em | The endpoint is the physical location of the monitored web application plus the service name (the value of the contextRoot attribute). |
| Operation | managers_ocammHome | (This pertains to the first example URL)
Because the <framework> element's type is set to ADF, the ADF ruleset is used. Therefore, by default, the operation name consists of the directories and filename from the request URL. In this case, the default operation name would be faces/ocamm/managers/ocammHome. However, because the <operationRule> element's excludeDirectories attribute is set to “1, 2", the first and second directories (faces/ocamm/) are excluded. |
| Operation | targets_search | (This pertains to the second example URL)
Because the <framework> element's type is set to URL, the URL ruleset is used. Therefore, by default, the operation name consists of the directories and filename from the request URL. In this case, the default operation name would be console/all/targets/search. However, because the <operationRule> element's excludeDirectories attribute is set to "1, 2", the first and second directories (console/all/) are excluded. |
| N/A | N/A | (This pertains to the third example URL)
A <framework> element of type URL was specified with only the pattern "*/console*". This request does not fit that pattern. It also does not fit the pattern specified in the ADF <framework> element. Thus it is excluded from monitoring. |
Example 4 – Adding multiple parameter name-value pairs to an operation name
<ap:servletObserver xmlns:ap="http://namespace.amberpoint.com/amf">
 <ap:application contextRoot="/physician">
  <ap:operationRule>
   <ap:paramGroup>
    <ap:partitionByParam name="firstName"/>
    <ap:partitionByParam name="lastName"/>
   </ap:paramGroup>
  </ap:operationRule>
 </ap:application>
</ap:servletObserver>
The preceding configuration code applied to this request URL:
http://st02:7011/physician/physicianSection/viewRecordSummary.action
with POST parameters of "firstName=John" and "lastName=Doe" produces the following objects in Business Transaction Management:
| Object | Value | Explanation |
|---|---|---|
| Service | physician | The service name is the value of the contextRoot attribute. |
| Endpoint | http://st02:7011/physician | The endpoint is the physical location of the monitored web application plus the service name (the value of the contextRoot attribute). |
| Operation | physicianSection_viewRecordSummary.action_firstName_John__lastName_Doe | The name and value of the parameters specified within the <paramGroup> element are appended to the default operation name in the order they are listed. If either the firstName or lastName parameters were not available, then this <paramGroup> element would have been ignored, resulting in a value of “physicianSection_viewRecordSummary.action”. |
Example 5 – Parameter priority handling
<ap:servletObserver xmlns:ap="http://namespace.amberpoint.com/amf">
 <ap:application contextRoot="/physician">
  <ap:operationRule>
   <ap:paramGroup>
    <ap:partitionByParam name="firstName"/>
    <ap:partitionByParam name="lastName"/>
   </ap:paramGroup>
   <ap:partitionByParam name="lastName"/>
   <ap:partitionByParam name="middleName"/>
  </ap:operationRule>
 </ap:application>
</ap:servletObserver>
The preceding configuration code applied to this request URL:
http://st02:7011/physician/physicianSection/viewRecordSummary.action
with POST parameters of "lastName=Smith" and "middleName=Rodney" produces the following objects in Business Transaction Management:
| Object | Value | Explanation |
|---|---|---|
| Service | physician | The service name is the value of the contextRoot attribute. |
| Endpoint | http://st02:7011/physician | The endpoint is the physical location of the monitored web application plus the service name (the value of the contextRoot attribute). |
| Operation | physicianSection_viewRecordSummary.action_lastName_Smith | The probe first checks whether the parameters specified in the <paramGroup> element are provided in the request. Because the firstName parameter is not provided, that entire <paramGroup> element is skipped. The probe then checks the next <paramGroup> or stand-alone <partitionByParam> element. Because the next element specifies a “lastName” parameter and that parameter is provided in the request, the parameter name and value is appended to the operation name (_lastName_Smith). After finding this match, the probe stops checking for parameters, meaning that the “middleName” parameter is not appended to the operation name. |
Enabling the UserActivityInfo Request Parameter
If you want to use the operation partitioning features provided by the <adfOptions> and <globalAdfOptions> elements, then you must ensure that the UserActivityInfo request parameter is enabled for your application. Oracle Fusion Applications environments should have this enabled by default as well as environments using the ADF support in Oracle Enterprise Manager Real User Experience Insight.
To enable the UserActivityInfo request parameter in your ADF application, set the following property in the application's web.xml file:
<context-param>
  <description>
    This parameter notifies ADF Faces that the ExecutionContextProvider
    service provider is enabled. When enabled, this will start
    monitoring and aggregating user activity information for the client
    initiated requests. By default, this param is not set or is false.
  </description>
  <param-name>
    oracle.adf.view.faces.context.ENABLE_ADF_EXECUTION_CONTEXT_PROVIDER
  </param-name>
  <param-value>true</param-value>
</context-param>
Info Settings Field Reference
| Field Name | Description |
|---|---|
| Name | Required. Specifies the name of your policy. You can set this field to any unique string. |
| Version | Optional. This field is descriptive only and is provided for you to enter any pertinent information about the policy. |
| Notes | Optional. This field is descriptive only and is provided for you to enter any pertinent information about the policy. |
Advanced Settings Field Reference
| Field Name (boldface denotes a section name) | Description |
|---|---|
| Edit advanced options | Enable this checkbox to display advanced settings. The advanced settings are described below. |
| Observer Behavior | All of the following settings are displayed only if you enable the Edit advanced options setting. |
| Configuration polling interval | Required. Use this field to specify, in seconds, how often the observer checks for a new configuration. |
| Instrument update interval | Required. Use this field to specify, in seconds, how often the observer sends measurement data to the monitor. |
| Number of connections | Use this field to specify the number of socket connections that the observer opens. Using multiple connections improves throughput of observations. |
| Mapping Algorithm | Specifies the algorithm used to modify the host name-port number portion of the request and WSDL URLs. Choose from these values:
As sent - The observer does not rewrite the URL and forwards it unchanged to the monitor. Use hostname - The observer replaces the host name portion of the URL with the fully qualified name of the server's host. It replaces the port number portion of the URL with the port number on which the server is listening. The host name and port number are obtained from the deployment environment. This algorithm is useful for clustered servers fronted by a load balancer. In this scenario, the original request URL is that of the load balancer, with the load balancer's host name and port number. If the observer passes the original request URL to the monitor, the entire cluster of servers is modelled as a single server. With the algorithm set to useHostname, each server is modelled separately. Use IP address - The observer converts the URL's host name into an IP address and leaves the port number unchanged. The IP address is obtained from the deployment environment. This algorithm can be useful if the monitor cannot resolve hostnames to valid IP addresses. You should not use this algorithm if the server has multiple IP addresses. Use fully qualified name (FQN) - The observer converts the URL's host name into a fully qualified name and leaves the port number unchanged. This algorithm can be useful for a server that has multiple IP addresses. Use alternate - This algorithm lets you provide specific values for the host name, port number, and protocol. Use the following three fields to input the values. If you do not specify a value in any one of the fields, the corresponding portion of the URL is left unchanged. Note: In the case of the OSB observer, the target service URL is always set to FQN in the observer configuration, but this setting is not visible in this policy. |
| Alternate host | The value to use as the host portion of the URL. |
| Alternate port | The value to use as the port number portion of the URL. |
| Alternate protocol | The value to use as the protocol portion of the URL. |
| Discovery processing interval | Specifies the regular interval (in minutes) at which the observer attempts to discover new components. The default value is 3 minutes. Any value over 1440 minutes (one day) is interpreted as 1440 minutes. Any negative value is interpreted as 3 minutes. |
| Observer Troubleshooting | - |
| Enable trace logging | Trace logging is always enabled and is set to Info by default. Use this checkbox to enable the Trace logging level field so that you can edit the setting.
For information on other types of observer error logging, location of error log files, and configuring the location of error logs, see Logging Observer Errors and Debugging Information. |
| Trace logging level | Use this field to specify the level of information you want written to the log file. The possible values, in order from least to most information, are:
Info, Fine, Finer, Finest |
| Trace file size | This field specifies, in kilobytes, the size of the trace log files. |
| Trace files count (rotation) | This field specifies the maximum number of trace log files. When the maximum number of trace log files are full, rotation occurs, whereby the oldest file is overwritten with a new file.
In general, you will change this setting only when asked to do so by the Oracle support team. |
| Log observed messages to file | Enable this checkbox if you want observed messages written to a file. |
| Observation log directory | The path to the directory containing the observation log files. For WebLogic, OC4J, WebSphere, and JBoss servers, you can specify an absolute path or a relative path. For other servers, you can specify only an absolute path. Relative paths are relative to the default location. The default locations are:
Note: The default log location for WCF and ASP.NET is not a true default. It is simply the default setting of the AmberPoint:NanoLogBaseDir key. If you set this key to null, log files will not be created. |
| Observer Message Queue | The fields in this section affect the behavior of the observer's observation queue. The observer copies observed, service-bound messages to this outgoing queue. These observations are then pulled off the queue and sent to the monitor. |
| Queue size | Required. This field specifies the maximum number of messages the observer's observation queue can hold. A larger number allocates more memory for the queue. |
| Maximum message size | Optional. This field specifies, in kilobytes, the maximum size of a message that can be placed on the observer's observation queue. Messages larger than the specified size are first truncated and then placed on the queue.
You can use this field to reduce the load on the network and monitor. The truncation applies only to the body of the message. The message envelope is left intact. Note: If your service is a client to other services, you must set this setting to the same value for the observers monitoring those services. Failure to do so will disrupt the dependency tracking mechanism and cause the appearance of nonexistent clients in dependency diagrams. |
| If queue is full | Caution: Leave this field at its default setting unless you are instructed by the Oracle support team to edit it. The default setting for this field is Forward service-bound messages without copying them onto queue.
The If queue is full field specifies the behavior of the observer's observation queue if it fills up. Choose between these options: Delay service-bound messages until there is room to copy them onto queue - If the queue is full, the observer waits until the queue frees up enough space to hold the observation before forwarding the original message on to the service. This setting ensures that copies of all messages are forwarded to the monitor. Choosing this option together with the Delay receipt of observed messages over socket until queue has room option in the Monitor Configuration section of the policy ensures that all observations are logged. However, in high-traffic situations, such a setting might result in the slowing down of message processing by the monitored application. Forward service-bound messages without copying them onto queue - If the queue is full, the observer forwards the original message on to the service without copying it to the queue. Choosing this option ensures that the observer does not slow down the monitored application's message processing in order to log observations. However, in high-traffic situations, this setting might result in a loss of observations. Note: In no case, does the observer discard the original service-bound messages. |
| Monitor Message Queue | The fields in this section affect the behavior of the monitor's observation queue. As observations arrive at the monitor, they are placed on this incoming queue. The monitor then pulls the observations off the queue and processes them in order to gather data on performance, transactions, and so forth. |
| Queue size | Required. This field specifies the maximum number of messages the monitor's observation queue can hold. A larger number allocates more memory for the queue. |
| Maximum message size | Optional. This field specifies, in kilobytes, the maximum size of messages that are accepted on the monitor's observation queue. You can use this field to reduce the load on the monitor by constraining the processing of large messages.
By specifying a value in this field, you instruct Business Transaction Management to drop both the request and response message (or fault message, in case of a fault) if either message in the pair is larger than the specified value. Oversized messages are dropped without being processed and are not used in calculating performance measurements such as throughput or average response time. |
| Idle socket timeout | Required. This field specifies the maximum number of milliseconds that the socket on which the monitor receives observations remains open in the absence of traffic. |
| Retain request messages for a maximum of | Optional. This setting specifies the number of seconds the monitor holds on to a request message before assuming that no response will arrive. Once this time has been exceeded, the request is processed as if the response message timed out. The default value of 60 seconds is used if you leave this field blank or set it to 0. |
| Number processing threads handling messages | Optional. This field specifies the number of threads the monitor allocates for processing observation messages. The default value of 5 is used if you leave the field blank or set it to 0. |
| Number processing threads handling endpoint discovery | Optional. This field specifies the number of threads the monitor allocates for processing endpoint discovery messages. The default value of 2 is used if you leave the field blank or set it to 0. |
| If queue is full | Required. This field specifies the behavior of the monitor's observation queue if it fills up. Choose between these options:
Delay receipt of observed messages over socket until queue has room - If full, the queue rejects incoming observations (message copies) until it has freed up space for them. In this case, the observer resends observations until they are successfully placed on the queue. Choosing this option together with the Delay service-bound messages until there is room to copy them onto queue option in the Observer Configuration section of the policy ensures that all observations are logged. However, in high-traffic situations, such a setting might result in the slowing down of message processing by the monitored application. Discard incoming observed messages - If full, the queue discards incoming observations. Choosing this option together with the Forward service-bound messages without copying them onto queue option in the Observer Configuration section of the policy ensures that the observer does not slow down the monitored application's message processing. However, in high-traffic situations, this setting might result in a loss of observations. Note: In no case, does the monitor discard the original application messages. |
| Servlet Observer Configuration | - |
| Specify WEB_APP probe configuration | This checkbox pertains to the WEB_APP probe and allows you to configure the selective monitoring of requests and modeling of operations. Enable this checkbox to display the WEB_APP probe configuration field, where you can input configuration code for these options. This field is enabled by default.
Note: If you provide a custom observer configuration in the Custom observer configuration field, do not enable this checkbox. Instead, you must add your filtering/modeling code to your custom observer configuration in the Custom observer configuration field. This code must be contained in a <servletObserver> element and added as the last child of the custom configuration's <nanoAgentConfigurations> element (the root element in the custom configuration.) |
| WEB_APP probe configuration | This field is displayed only if the Specify WEB_APP probe configuration checkbox is enabled.
Use this field to input a <servletObserver> element into the configuration for the WEB_APP probe. This element provides control over the selective monitoring of requests and the modeling of operations. By default, this field contains the following code, which instructs the probe not to monitor requests for files with the specified extensions. <ap:servletObserver rueiPresent="true" rueiMatches="false" xmlns:ap="http://namespace.amberpoint.com/amf"> <ap:globalExcludeList ext="jpg, jpeg, html, htm, css, gif, png, ico, js, swf, cur"/> </ap:servletObserver> For information on coding the <servletObserver> element, see Request Monitoring and Operation Modeling for the WEB_APP Probe. |
| Custom Observer Configuration | - |
| Use custom configuration | If you require observer configuration options that are not available in this policy, enable this checkbox and input your observer configuration in the following field. With this checkbox enabled, your custom configuration overrides all other fields in this policy. |
| Custom observer configuration | Use this field to input a custom observer configuration. This field is displayed only if the Use custom configuration checkbox is enabled. |
| Model Configuration | The fields in this section control how Business Transaction Management models particular types of components.
Warning: You should adjust these fields to the proper setting before the observer is installed and discovers components. If you edit these settings for components that have already been discovered, you might have to modify your existing transaction definitions or reset your model (see deleteAll for information on how to reset your model). |
| SOA | This field controls how SOA components are modeled. Choose between these options:
Model All - Model all SOA components. Model Edge of Flow - Model only the first component of each SOA composite application, for example, a web service interface. This is the default setting. |
| Local EJB | This field controls how local EJB components are modeled. It does not affect the modeling of remote EJB components (all remote EJBs are always monitored). Choose between these options:
Model All - Model all local EJB components. Model None - Do not model local EJB components. This is the default setting. Model Edge of Flow - Model only the first local EJB component of each local request flow. Model ORA-WS - Model only those local EJB components that implement business logic for Oracle Web Services (ORA-WS) web services based on the presence of any of the following annotations on their EJB implementation classes:
This option is designed specifically for ORA-WS, which is primarily used in Oracle packaged applications like Fusion Applications. |
| OSB | This field controls how Oracle Service Bus components are modeled. Choose between these options:
Model All - Model all Oracle Service Bus components, including OSB business services, proxy services, split-join tasks, and the parallel flow of messages issuing from split-joint tasks. Model Edge of Flow - Model only proxy services. This is the default setting. |
| JMS | This field controls how JMS topics, queues, and message listeners are modeled. Choose between these options:
Model All - Model all JMS topics, JMS queues, and their associated message listeners. Model Edge of Flow - Model only the message listeners associated with JMS topics. This is the default setting. |
| JDBC Summary | The fields in this section control JDBC Summary Mode. When JDBC Summary Mode is enabled, observations of related JDBC calls are aggregated and sent to the monitor as a single summary observation message. Enabling Summary Mode can improve your BTM system's performance and reduce its database disk space requirements, particularly if your monitored services make heavy use of JDBC calls and you have enabled message logging on these operations. These gains are achieved both by reducing the volume of observation messaging and by constraining the number of JDBC calls written to the message log database. Options are provided that allow you to control the constraints on message logging.
Note: JDBC Summary Mode does not affect the collection, recording, or display of performance measurements, such as response time. |
| Enable Summary Mode | Use this field to enable or disable JDBC Summary Mode. This setting is enabled by default. |
| Number of Slowest JDBC Calls to Log | Specify how many of the slowest JDBC calls should be logged. For example, if you specify 2, only the two slowest calls will be included in the summary observation message and then logged to the message log database (assuming that message logging is enabled for the operation). The default value is 3 calls. |
| Time Limit for JDBC Calls | Specify in seconds the longest period of time you think any JDBC call should require for completion. If any JDBC call surpasses the time limit, the summary observation message is sent immediately. This incomplete summary observation message serves as a warning that queries are taking longer to complete than you expected (the uncompleted JDBC call is indicated by a value of time out as its response time). If an incomplete JDBC call later completes, or other related calls are observed, then a follow-up summary observation message is sent that combines the information from the previous summary message with the information from the now completed and/or newly observed call or calls. The default value is 10 seconds. |
| Number of Fault Messages to Log | Specify how many fault messages should be logged. For example, if you specify 1, only the first fault message received will be included in the summary observation message and then logged to the message log database (assuming that message logging is enabled for the operation). If you specify 2, the first and last will be logged. If you specify 3, the first, second, and last will be logged (and so on). The default value is 2 faults. |
Logging Observer Errors and Debugging Information
The observer writes error and debugging information to the following log files:
-
NanoAgentErrorTrace.log – contains single occurrences of all errors and warnings logged to the other log files. Each error and warning entry is referenced by a unique identifier within a <Ref> element, for example:
<Ref: Dq/QGNWqOmbdXPigC+vsO40eXgs=>
You can use this identifier to search for all occurrences of the error or warning in the other log files, typically within NanoAgent.log. This is generally the first log file you should check when a problem occurs.
The default size of this log file is 10M and it is recreated on each restart of the server. However, because its default rotation is set to 2, the previous log file is retained after a server restart.
-
NanoAgent.log – contains runtime errors, configuration-related errors, and debugging information (you can adjust this logger's settings using the Enable trace logging option in the Observer Communication policy.)
-
NanoAgentPreprocessTrace.log – contains information about bytecode instrumentation errors and debugging, class-loading, and preprocessing. This file is regenerated on each restart of the server. The maximum size of this log file is 10 MB.
This file was renamed for release 12.1.0.2.2. For observers of previous releases, the file was named AWTrace.log.
Note:
You can also configure the observer to log observed messages. For information on this topic, refer to the Log observed messages to file entry in Advanced Settings Field Reference.The default location of the log files is as follows:
-
WebLogic – the domain_root_directory/nanoagent/logs/server_name directory (if that directory cannot be determined, then it defaults to the domain root directory)
-
OC4J – the j2ee\home directory inside your SOA Suite installation directory
-
Enterprise Gateway – the home directory (top-level installation directory) of the Enterprise Gateway server.
-
WebSphere – the profile directory
-
JBoss – the JBOSS_HOME/bin directory
-
WCF and ASP.NET – the C:/temp/NanoAgentBaseDir directory
Note:
The default log location for WCF and ASP.NET is not a true default. It is simply the default setting of the AmberPoint:NanoLogBaseDir key. If you set this key to null, log files will not be created.If you want the log files generated in a different directory, set the AP_NANO_LOG_BASEDIR Java property or AmberPoint:NanoLogBaseDir Windows key. For Java application servers, you can set the property to either an absolute path or a path that is relative to the default log directory. For Enterprise Gateway, WCF and ASP.NET, you must set the property or key to an absolute path. The following examples illustrate how to set this property or key:
-
On WebLogic, if you configure your server by editing local scripts, edit the nanoEnvWeblogic script located in WL_HOME/nanoagent/bin directory. In the options section of the file, add -DAP_NANO_LOG_BASEDIR="my_log_dir" to the end of the NANOAGENT_JAVA_OPTIONS. This relative path would generate the log files in the directory my_log_dir under your domain directory.
If you configure you WebLogic server using the Node Manager, open the WebLogic Administration Console, select your server, and display the Configuration / Server Start tab. Then add -DAP_NANO_LOG_BASEDIR=my_log_dir to the Arguments field. This relative path would generate the log files in the directory my_log_dir under your domain directory.
-
On OC4J, add -DAP_NANO_LOG_BASEDIR=my_log_dir to the Java startup options. This relative path would generate the log files in the directory my_log_dir under the j2ee\home directory inside your SOA Suite installation directory.
-
On Enterprise Gateway, open OEG_HOME/system/conf/jvm.xml in a text editor and add <SystemProperty name="AP_NANO_LOG_BASEDIR" value="C:\OEG\my_log_dir"/> as a child of the <JVMSettings> element. This absolute path would generate the log files in the directory C:\OEG\my_log_dir.
-
On WebSphere, in the WebSphere Administrative Console, navigate to Servers > Application servers > server1 > Server Infrastructure > Java and Process Management > Process Definition > Java Virtual Machine > Custom Properties (you might have to substitute a different server name for server1). Create a custom property named AP_NANO_LOG_BASEDIR and set it's value to my_log_dir. This relative path would generate the log files in the directory my_log_dir under your profile directory.
-
On JBoss, edit your server startup script JBOSS_HOME/bin/run. In the options section of the file, add set JAVA_OPTS=-DAP_NANO_LOG_BASEDIR="my_log_dir". This relative path would generate the log files in the directory JBOSS_HOME/bin/my_log_dir.
-
For WCF or ASP.NET, edit the application configuration file (for example, Web.config) and set the value for the AmberPoint:NanoLogBaseDir key to C:/Inetpub/wwwroot/my_log_dir. This absolute path would generate the log files in the directory my_log_dir under your default web site directory, for example:
<configuration>
 <configSections>
  ...
 </configSections>
 <AmberPoint>
  <NanoAgentDataSection>
   <add key="AmberPoint:NanoConfig" value="c:/temp/NanoAgentLogBaseDir/nanoagentDiscovery.CONFIGURATION"/>
   <add key="AmberPoint:NanoLogBaseDir" value="c:/Inetpub/wwwroot/my_log_dir"/>
   <add key="AmberPoint:NanoCreateLogBaseDir" value="false"/>
  </NanoAgentDataSection>
 </AmberPoint>
 <system.web>
  ...
 </system.web>
</configuration>
In order for the observer to generate the log files, ensure that the user under which the observer is running has permission to write to the log directory. For Java observers, the user is the user that is running the application server. For IIS observers (WCF and ASP.NET), the user is as follows:
-
IIS 5.x – the observer user is ASPNET
-
IIS 6.x and 7.x – the observer user is NETWORK SERVICE
By default, the directory specified by the AP_NANO_LOG_BASEDIR property is automatically created if it does not exist. If you do not want this directory to be automatically created, set the property AP_NANO_CREATE_LOG_BASEDIR to false. In this case, you must create the directory yourself. Set this property in the same way you set AP_NANO_LOG_BASEDIR.
Notes:
For Java application servers – If the log directory does not exist and AP_NANO_CREATE_LOG_BASEDIR is set to false, runtime errors might occur and the observer might not initialize.For IIS – If the NanoLogBaseDir Windows key is set to null, log files are not created.