20 Oracle Engineered Systems
The following information is included in this section:
20.1 Introduction to Oracle Engineered Systems
Traditionally, IT departments have been required to install and configure software that is hosted on hardware that was itself installed and configured separately. Oracle Engineered Systems relieve this burden from the IT department by providing a pre-defined combination of hardware and software. Oracle Engineered System is a complete set of integrated hardware and software designed to reach a predetermined level of capability, capacity, and scale. This relatively new concept of an integrated hardware and software solution dedicated to provide a specific service, changes the way one must think about architecture in IT environments.
In addition to removing the burden of installation and configuration, Oracle Engineered Systems provide significant cost savings, this is one of the many advantages delivered by Oracle Engineered Systems. An even larger advantage is the optimization that pre-defined hardware and software enables. As the hardware and software are engineered together to form a complete system, there are multiple opportunities to improve the overall system performance. The unified and integrated monitoring and management of the Engineered System also provides cost savings through simplification of the overall environment. Thus, Oracle engineered systems allow datacenter services to be delivered more efficiently via modular, dedicated systems. This greatly simplifies the entire purchase, deploy, configure, monitor, and manage lifecycle of the provided services.
The whole impetus for cloud computing is to provide specific services (whether IaaS, PaaS, or SaaS) as efficiently as possible; therefore, the increased efficiency delivered by Oracle Engineered Systems make them ideal candidates for the building blocks of a cloud computing environment.
In addition to creating a cloud computing environment, these building blocks address a variety of enterprise architecture requirements to provide a path for enterprise maturation alongside the move to cloud adoption. Each building block can be selected as needed to meet specific maturation needs, and thus ultimately they provide an increase in overall architectural flexibility. For example, an architect may choose to integrate an Exadata Storage Server and SPARC SuperCluster or Oracle VM Blade Cluster early on to begin the process of consolidation into a scalable architecture, and then expand the system later to meet future demand. Shifting the overall environment into a standardized architecture opens possibilities for future shift into cloud adoption and/or continuation down the traditional enterprise computing maturation continuum while providing for future scale.
The Oracle Exalogic Elastic Cloud and SPARC SuperCluster T4-4 Engineered Systems are described in detail in the following sections.
The Oracle Exalogic Elastic Cloud comprises of a complete stack of hardware and software, computing, storage, and network, all engineered to work optimally together to provide a private cloud leveraging fusion middleware. Oracle Enterprise Manager Ops Center is a key part of the Exalogic appliance control system and serves as the operating system of the Exalogic platform.
The SPARC SuperCluster T4-4 comprises of a complete stack of hardware and software, computing, storage, and network, all engineered to work optimally together to provide a consolidated platform for running database, middleware, or third party applications. Oracle Enterprise Manager Ops Center is closely integrated with SPARC SuperCluster and provides hardware management, provisioning, and virtualization management.
20.1.1 Datacenter Management
Using Oracle Enterprise Manager Ops Center, you can discover and manage Oracle Engineered Systems. You can view and access multiple Engineered Systems from a single datacenter through Oracle Enterprise Manager Ops Center. You can also view the Engineered System's assets, incidents reported from the Engineered Systems, and Service Requests from the same UI. You can generate reports for all datacenter assets, including Engineered Systems.
The discovery and management process is performed using one of the following methods:
20.1.1.1 Finding Assets
You can find assets using their service tags. Service tags are small XML files containing product information. Many Oracle systems come equipped with service tags. If you have hardware assets equipped with service tags, you can discover them using the Find Assets Wizard. This method lets you discover large numbers of assets quickly.
The Find Assets Wizard searches IP ranges or networks for service tags, then uses credentials that you specify to discover and manage the discovered assets.
Products without service tags cannot be discovered using this method.
To find assets, perform the following steps:
-
On the Navigation pane, under Assets, select All Assets.
-
In the Actions pane, click Find Assets. The Find Assets Wizard opens.
-
Select Find Assets Now and click Next.
When the initial discovery is complete, select the assets in each category (hardware, operating systems, and engineered systems) that you want to manage and provide necessary credentials.
Note:
When adding a network range, enter the values without any space between the IP addresses. Use the format start_ip-end_ ip. -
Click Finish. The manage asset job is launched.
See Discovering and Managing Assets for more information.
20.1.1.2 Creating a Discovery Profile
To discover an asset, a discovery profile has to be created. After it has been created, you run a discovery job using the profile.
To create a discovery profile, perform the following steps:
-
On the Navigation pane, select Plan Management.
-
Under Profiles and Policies, select Discovery.
-
In the Actions pane, click Create Profile.
-
Enter a name for the discovery profile and select the type as Oracle Engineered Systems. Click Next.
-
If the service tag parameters have been modified for the target assets, enter the Service Tag parameters:
-
Service tag passphrase - Necessary if a service tag has been configured to be encrypted.
-
Service tag port - Necessary if a service tag has been configured to use a port other than the default of 6481.
-
Service tag timeout - The default value is 20 seconds.
-
-
Enter the information for the target assets.
-
Host names or IPs - Enter a comma-separated list of host names or IP addresses. If you want to target an IP range, use the IP Ranges field instead.
-
Network - The managed network associated with the host names or IP addresses to route the discovery to the correct Proxy Controller. Select Automatic to route the job to the most appropriate Proxy Controller. The IP address of a target must resolve to only one known network for automatic routing to succeed.
-
IP ranges - Click the plus icon to add one or more IP ranges. Enter a name, description (optional), network, and IP range for each. If you want to target specific host names or IP addresses, you must enter them when you run the discovery profile.
-
-
Enter credentials for each selected discovery profile.
-
View the summary and click Finish to create the discovery profile.
20.1.1.3 Adding Assets Using a Discovery Profile
After you have created a discovery profile, you run a discovery job and manage Engineered System's assets. This lets you discover assets using a pre-existing set of protocols and credentials, and manage assets consistently.
To declare unconfigured assets for service processor configuration, perform the following steps:
-
On the Navigation pane, under Assets, select All Assets.
-
In the Actions pane, click Add Assets. The Add Assets Wizard opens.
-
Select the option, Add and manage various types of assets via discovery probes. The Discovery profile window opens.
-
Select a discovery profile.
-
Add or edit the IP addresses, host names, and credentials for the targets.
-
Click Add Now.
20.1.1.4 Viewing the Asset Content Pane
You can view Engineered System's assets in the Datacenter Enterprise Controller BUI.
To view the Engineered System's assets in the Datacenter Enterprise Controller BUI, perform the following steps:
-
On the Navigation pane, under Assets, select Oracle Engineered Systems.
-
Select the Engineered System. The Dashboard, Details, Rack Info, Incidents, Service Request, and Monitoring tabs are displayed in the center pane.
-
Dashboard Tab – Displays the summary of the selected Engineered System, its membership graph, and the status of the system.
-
Details Tab – Displays the name of the selected Engineered System, description, master subnet manager address, number of racks, compute nodes, storage nodes, switches, and PDUs in the system.
-
Rack Info Tab – Displays a photorealistic view of the selected Engineered System.
-
Incidents Tab – Displays all incidents reported from the selected Engineered System.
-
Service Request Tab – Displays the service request for the selected Engineered System.
-
Monitoring Tab – Displays the alert monitoring rules and service dependencies of the selected Engineered System.
-
To perform active management actions on any asset of Engineered Systems, launch the web interface of the selected Engineered System by clicking Launch Web Interface on the Actions pane.
20.1.1.5 Relayed Incidents
Relayed Incidents are datacenter incidents that are reported from Oracle Engineered Systems attached to Datacenter Enterprise Controller. You can only view and delete the relayed incidents. No actions can be performed on these incidents.
When you close the relayed incidents from the Datacenter Enterprise Controller, the incident is closed in the respective Engineered System as well.
To view all datacenter incidents, do the following:
On the Navigation pane, under Message Center, select Relayed Incidents.
All the relayed incidents are displayed.
See Incidents for more information.
20.1.1.6 Relayed Service Requests
You can view the relayed service requests related to the Oracle Engineered Systems. You can also file service requests.
To view the relayed service requests, do the following:
On the Navigation pane, under Message Center, select Relayed Service Requests.
All the relayed service requests are displayed. Details such as summary of the request, SR number, serial number, severity, status, contact person, and last updated date are displayed.
See Oracle Services and Service Requests for more information.
20.1.2 Baseline Check
Baseline Check is a feature in Oracle Enterprise Manager Ops Center Engineered Systems in which the factory default configuration of eighth, quarter, half, and full rack configurations are considered as a normal or baseline setup. When the assets are discovered and associated with the rack, this setup is compared with the default factory configuration. For any discrepancy, the baseline check reports a question mark at the slot in the rack where the local configuration differs from the factory default configuration.
Hover the cursor over the question mark to view details of the warning, for example, missing asset, asset mismatch, or unknown asset. Based on the warning, you can decide to adjust the assets.
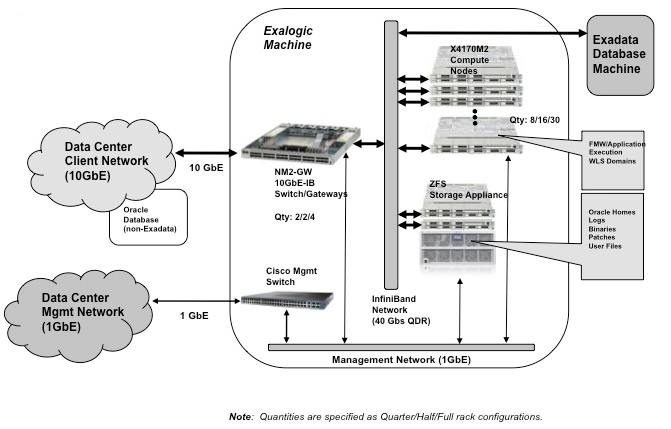
20.2 Oracle Exalogic Elastic Cloud
The Oracle Exalogic Elastic Cloud Engineered System delivers a standalone Oracle Enterprise Manager Ops Center that is preinstalled on a factory packaged Exalogic system. The embedded Oracle Enterprise Manager Ops Center is an integral part of Exalogic Control software and offers full set of Oracle Enterprise Manager Ops Center built-in functionality to provide Exalogic platform administration operations. It also provides features to view the Exalogic machine as an appliance, monitor and manage the Exalogic hardware, and cover the replacement part of the fault management lifecycle.
Figure 20–4 is a pictorial representation of the Exalogic System.
20.2.1 Oracle Enterprise Manager Ops Center Configuration
The Exalogic Control software components are deployed in HA configuration to ensure that the platform management system is reliable and available.
To conserve the limited Exalogic resources and simplify the deployment model, Exalogic Control deploys a single database in HA configuration that is shared among other Exalogic Control software components such as Oracle Enterprise Manager Ops Center, Oracle VM Manager, and LDAP.
20.2.2 Understanding User Roles
In Oracle Enterprise Manager Ops Center, users can be assigned several roles such as Asset Admin, Cloud Admin, Exalogic System Admin, and many more. Each role grants the user a set of permissions. A particular permission can be granted by more than one role such as Asset Management, Network Management, and so on.
You can add users to Oracle Enterprise Manager Ops Center from the local authentication subsystem of the Enterprise Controller's operating system. Each user can be given a different role which grants or denies access to the different functions of Oracle Enterprise Manager Ops Center. You can view the existing users from the Users tab of the Administration section.
20.2.2.1 Exalogic System Admin Role
The Exalogic System Administrator is responsible for overall monitoring and management of the engineered system, including hardware subsystems, network management, and user management. The Exalogic System Administrator also has privileges to manage Oracle VM Servers.
The Exalogic System Admin role is a default role for the management of the Exalogic appliance and tasks related to the above functionality. As an Exalogic System Admin, you can perform most of the operations that are allowed in the context of the Exalogic system, except tasks related to cloud management.
For tasks related to cloud management, the Cloud Admin and Cloud User roles are available.
Prerequisites: The user must be familiar with the use of Oracle Enterprise Manager Ops Center and be familiar with hardware management and OS management.
20.2.2.2 Cloud Administrator
The Cloud Administrator's responsibilities include setting up of infrastructure and resource allocation so that cloud users can deploy their application onto authorized accounts. They also manage the cloud users accessing the accounts and their authorization.
Prerequisites: The user must be trained on Oracle Enterprise Manager Ops Center, installation and configuration, and the continual maintenance of the product.
20.2.2.3 Cloud User
Cloud users create virtual servers and deploy applications. Cloud users are restricted to virtual datacenter infrastructure activities and are presented only with the required options on the Oracle Enterprise Manager Ops Center UI.
Prerequisites: The user must be familiar with the use of Oracle Enterprise Manager Ops Center and be familiar with hardware management and OS management in general.
20.2.3 Adding a User
Users with the User Admin role can add other users. New user information, such as passwords for new users are retrieved from the local authentication subsystem.
Perform the following steps to add a user:
-
Select Administration in the Navigation pane.
-
Click Local Users. The Users page is displayed.
-
Click the Add User icon. The Add User window is displayed.
-
Enter the user name.
-
Add one or more roles to the list of Selected Roles.
-
Click Add User. The new user is created.
20.2.4 Viewing the Exalogic System
Viewing the Exalogic system basically means how you view the virtual Exalogic system using the four tabs on the Center pane, namely Dashboard, Details, Controls, and Networks. You can also perform relative actions by clicking the respective actions on the Actions pane. The actions that are allowed to be performed from the Actions pane are context sensitive to the selected assets on the Navigation pane. The actions are also role based, not all users are allowed to perform all actions. For more information on Roles, see Understanding User Roles.
To view the Exalogic system, perform the following steps:
-
Log in to Oracle Enterprise Manager Ops Center using the Exalogic Admin Role.
-
On the Navigation pane, under Assets, select Exalogic Systems from the drop-down list.
-
Select the Exalogic system that you want to view.
The Dashboard, Details, Controls, Networks, and Incidents tabs are displayed in the center pane.
Figure 20-6 Center Pane With Dashboard Tab Selected
Description of "Figure 20-6 Center Pane With Dashboard Tab Selected"
-
Click the tab on the Center pane to view more details.
-
Dashboard Tab displays the summary of the Exalogic system, its membership graph, and the status of the system.
-
Details Tab displays the name of the Exalogic system, description, master subnet manager address, number of racks, compute nodes, storage nodes, switches, and PDUs present in the system.
-
Controls Tab displays the Exalogic Control Software details such as name of the software, version number, description, name of the virtual machine, and server name.
-
Networks Tab displays the infrastructure network table and network connectivity table.
-
Incidents Tab displays all the incidents and alerts reported in the Exalogic System.
-
20.2.4.1 Dashboard Tab
The dashboard has three sections - Summary, Membership Graph, and Status.
In the Dashboard Tab, the following panes are displayed:
20.2.4.1.1 Summary Pane
The Summary section displays the name of the Exalogic system, description or name of the system identifier, number of racks that are part of the system, and also the number of unassigned incidents. The Unassigned Incidents icon in the summary pane includes incidents resulting from hardware faults. The three icons depict Critical Incidents, Warnings, and Information Incidents respectively. These incidents are from the assets that belong to all Exalogic racks.
20.2.4.1.2 Membership Graph Pane
The Membership Graph pane displays the Exalogic system as a hierarchy of its components showing the relationship between the Oracle VM Manager, physical InfiniBand fabric, and the hardware that is grouped in the rack. You can navigate to any asset by double- clicking on the asset in the membership graph.
Using the controls on the top right of the graphic pane, you can change the view of the graph to either a horizontal or a vertical orientation. You can also refresh the view by clicking the Refresh icon. You can also change the graph depths or size of the images.
20.2.4.1.3 Status Pane
The Status Pane displays the total unassigned incidents in chart format as well as the recent incidents encountered by the Exalogic system. In the Recent Incidents section, the following details are displayed:
-
Severity – Displays the severity of the incident.
-
State – Displays the state of the incident.
-
ID – Displays the incident ID.
-
Description – Displays the incident description.
-
Source – Displays the source of the incident.
-
Owner – Displays the name of the owner who reported the incident.
-
Creation Date – Displays the date on which the incident was created.
20.2.4.2 Details Tab
In the Details Tab, the following details are displayed:
-
Exalogic Name
-
Description
-
Model
-
Number of Racks
-
Number of Compute Node
-
Number of Storage Nodes
-
Number of Switches
In the Tags pane, the tag names and their respective values are displayed. You can search for a particular tag using the Search feature.
20.2.4.3 Controls Tab
The Controls tab displays the Exalogic Control Software details including the database, Oracle VM Manager, Proxy Controllers, and Enterprise Controller. The table displays the name of the control component, version number of the control component, description, virtual machine name, and server name.
You can select a control component from the table and double-click it to view the Dashboard of the respective control component. The values in the table give an idea as to where the Exalogic control stack runs so that the user can quickly navigate to that compute node just by clicking on it.
Use the Refresh icon on the Exalogic Control Software pane to refresh the list as and when needed.
20.2.4.4 Networks Tab
The Networks Tab displays the Infrastructure Networks table and Network Connectivity table.
The Infrastructure Networks table displays the infrastructure networks that are used inside the Exalogic system for communication between the Exalogic control components and cloud virtual machines.
-
Network Name - displays the name of the managed network.
-
Network CIDR - displays the type of the asset.
-
Partition Key - displays the partition of the port.
-
IP Range - specifies the minimum and maximum boundaries of the IP addresses assigned to the network.
-
Roles - displays the role.
The Network Connectivity Table displays the infrastructure networks with IPs assigned to the individual hardware components of Exalogic system.
-
Network Name
-
Asset Type
20.2.4.5 Incidents Tab
The Incidents Tab displays all the unassigned incidents and alerts reported in the Exalogic system.
20.2.4.6 Permitted Actions in the Exalogic System View
The following are the permitted actions that can be performed in the Exalogic system view. Refer to Oracle Enterprise Manager Ops Center Feature Reference Guide for steps on how to perform these actions.
-
Create Rack
-
Edit Tags
-
Add Assets
-
Find Assets
20.2.5 Viewing the Exalogic System Rack
This section describes how to view the Exalogic System rack, visualization of the rack physical layout, aggregated rack components, energy data, and other rack details. As an administrator, you can drill down to an asset contained in the rack (server, storage node, switch, PDU) or even further.
To view the Exalogic system rack, perform the following steps:
-
On the Navigation pane, under Assets, select Exalogic Systems.
-
Select a rack that you want to view.
The Dashboard, Details, Firmware, Incidents, Charts, Energy, and Jobs tabs are displayed in the center pane.
Figure 20-12 Tabs of the Exalogic System Rack

Description of "Figure 20-12 Tabs of the Exalogic System Rack"
-
Dashboard Tab – Displays the summary, membership graph, and status of the rack.
-
Details Tab – Displays the rack info with a photorealistic view of the rack.
-
Firmware Tab – Displays the name, description, and version of the firmware for each component and the slot for each component
-
Incidents Tab – Displays all unresolved incidents in the rack.
-
Charts Tab – Provides more ways to display the power utilization data. You can change the graphed data to a bar chart or an area chart. You can also export the data for either the current view or all available data to a file in either CSV or XML format.
-
Energy Tab – Reports power consumption as the current value and for a period of time, as well as attributes of the fan and power supplies.
-
Jobs Tab – Displays the current and historical jobs.
-
-
Select any of the tabs to view more details.
Refer to Hardware Monitoring for information on the Tabs and Views of the rack.
20.2.5.1 Photorealistic View of the Rack
The photorealistic view represents the physical rack so that you can see the placement of the rack and its components.. The front and rear views of the rack are displayed in this view. All slots and the respective assets are displayed. Positions within the rack are displayed in a 3-dimensional view.
Each asset in the rack is represented by an image. The health status of assets such as OK, Warning, or Critical is displayed in the form of colored lights as seen on the physical rack itself. OK status is identified by the green color. Warning and critical status are identified by the yellow color. Hover the mouse over the slots in the rack and view details about the assets such as slot number, asset name and description, type of asset, model number of the asset, and its health status.
A question mark in any of the slots indicates a discrepancy from the baseline check. See Baseline Check for more information.
To see the photorealistic view of the rack, perform the following steps:
-
On the Navigation pane, under Assets, select Exalogic Systems.
-
Select a rack that you want to view.
-
In the Center pane, click the Details tab.
A photorealistic view of the rack is displayed.
Figure 20-13 Photorealistic View of the Rack
Description of "Figure 20-13 Photorealistic View of the Rack"
20.2.5.2 Permitted Actions in Rack View
The following are the permitted actions that can be performed in the Exalogic system Rack view. Refer to Oracle Enterprise Manager Ops Center Feature Reference Guide for steps on how to perform these actions.
-
Create Rack
-
Delete Rack
-
Place/Remove Assets in Rack
-
Place/Remove PDUs in Rack
-
Edit Tags
-
Add Asset to Group
-
Add Assets
-
Find Assets
20.2.6 Creating and Viewing Reports
In general, using reports, you can view the configuration for each rack, including the asset details related to the firmware. Reports provide information about your assets, such as job history, firmware, OS updates, and problems. Reports are created in PDF and CSV formats. Reports can be exported or used to launch jobs on targeted assets.
To create a Report, see How to Create an Exalogic Report in the How To library at http://docs.oracle.com/cd/E27363_01/nav/howto.htm.
You can either view existing reports that have been created or you can create a new report for yourself and view it.
In this section, the Exalogic System Report is described in detail. The following sections of the report are described below:
Report Parameters displays the name and model of the Exalogic system. It also displays the number of assets in the rack by their types, such as compute nodes, switches, and storage nodes in the system.
The Summary Table is a table of all tables in the report. It displays the number of records for each table.
The System Control Software Table lists the name of the software (control components – Proxy Controller, Enterprise Controller, LDAP, Oracle VM Manager, and database), version, description, server name, and virtual machine name. These are the same attributes as seen on the UI of control components.
The Compute Nodes Table displays the setup of the racks such as the type of asset, name of the asset (compute node), firmware version (such as BIOS, service processor, and HCA adaptor), Oracle VM Server version, and the location of the asset in the rack with the slot number where it is placed.
The Switches Table displays the name of the switch node, type of switch, firmware version, and location of the switch in the rack with the slot number where it is placed.
The Storage Appliances Table displays the name of the compute node, version of the service processor firmware, and the location of the appliance with the slot number where it is placed in the rack.
Power Distribution Units Table
The Power Distribution Units Table displays the PDUs and their firmware version.
The Validation Table displays the validity result of the rack. A baseline check is performed against the known schema for the rack. See Baseline Check for more information. The Expected Component column in the table displays the expected component if the placed component in the slot does not match the schema when the baseline check is performed.
20.3 SPARC SuperCluster T4-4
SPARC SuperCluster is an Oracle Engineered System which integrates SPARC compute nodes, a Sun ZFS Storage Appliance, InfiniBand switches, PDUs, and Exadata Storage Servers into a multi-rack system.
The SPARC SuperCluster hardware comprises of two or four SPARC T4-4 servers, three Sun Datacenter InfiniBand Switch 36 switches as InfiniBand backplane, a Cisco 4948 48-port 1Gb Ethernet Switch for external connectivity, and a Sun Rack II.
SPARC SuperCluster is available in two configurations, half rack and full rack. The half rack includes three Exadata Storage Servers and the full rack includes six Exadata Storage Servers. In addition, for additional storage capacity, connecting to an Oracle Exadata Storage Expansion Rack is supported.
Note:
Oracle Sun ZFS Storage 7320 and 7420 Appliances provide a two-node cluster configuration. To discover the storage appliance, the administrative interfaces of both nodes must be private so that each node has a different static IP address. To verify that the appliance's nodes are using private administrative interfaces, you must use the appliance's user interface. For steps on how to determine if the interface is private, see Verify the Administrative Interfaces.20.3.1 SPARC SuperCluster Configuration
The SPARC SuperCluster uses logical domains (LDOMs) so that you can create specialized virtual systems within a single hardware platform. The logical domains have direct access to storage and network resources..
LDOM configurations supported on SPARC SuperCluster have the following types:
-
11gR2 Database (DB) Domains
-
Oracle Solaris 10 General Purpose Domains
-
Oracle Solaris 11 General Purpose Domains
There are nine basic configuration options to choose from for the SPARC SuperCluster (Configurations A - I), with each configuration option containing one or more of the LDOM configurations listed above. Each configuration is based on a mirrored two-server model, so any one of the nine basic configuration options can be used in a SPARC SuperCluster Half Rack, with some restrictions. For a SPARC SuperCluster Full Rack, you can use different combinations of these nine basic configuration options, with some restrictions.
Note:
In this document, it is assumed that the SPARC SuperCluster system is configured and discovered in Oracle Enterprise Manager Ops Center.20.3.2 Understanding User Roles
In Oracle Enterprise Manager Ops Center, users can be assigned several roles such as Asset Admin, Cloud Admin, SuperCluster System Admin, and many more. Each of such role grants the user a set of permissions; a particular permission can be granted by more than one role such as Asset Management, Network Management, and so on.
You can add users to Oracle Enterprise Manager Ops Center from the local authentication subsystem of the Enterprise Controller's operating system. Each user can be given a different role which grants or denies access to the different functions of Oracle Enterprise Manager Ops Center. You can view the existing Users from the Users tab of the Administration section.
SuperCluster System Admin Role
The SuperCluster System Administrator is responsible for overall monitoring and management of the SPARC SuperCluster system. The SuperCluster System Administrator also has privileges to manage the Oracle Solaris Cluster, Virtual Pools, and Storages. As a SuperCluster System Administrator, you can perform most of the operations which are allowed in the context of the SPARC SuperCluster appliance system.
The SuperCluster System Administrator role is a default role highly recommended for the management of the SPARC SuperCluster appliance and tasks related to the above functionality.
Prerequisites: The user must be familiar with the use of Oracle Enterprise Manager Ops Center and be familiar with hardware management and OS management in general.
20.3.3 Viewing the SPARC SuperCluster System
Viewing the SPARC SuperCluster system means how you view the virtual SPARC SuperCluster system using the tabs on the center pane, namely Dashboard, Details, Networks, and Incidents. You can also perform actions by clicking the respective actions on the Actions pane. The actions available on the Actions pane depend on the selected asset on the Navigation pane. The actions are also role based, not all users are allowed to perform all actions. For more information on Roles, see Understanding User Roles.
To view the SPARC SuperCluster system, perform the following steps:
-
Login to Oracle Enterprise Manager Ops Center using the SuperCluster System Admin role.
-
On the Navigation pane, under Assets, select SuperCluster Systems from the drop-down list.
-
Select the Oracle SPARC SuperCluster system that you want to view.
The Dashboard, Details, Controls, Networks, and Incidents tabs are displayed in the center pane.
-
Click a tab to view more details.
-
Dashboard Tab displays the summary of the SPARC SuperCluster system, membership graph, and the status of the system.
-
Details Tab displays the name of the SPARC SuperCluster system, description, master subnet manager address, number of racks, compute nodes, storage nodes, Exadata Storage Servers, switches, and PDUs in the rack.
-
Networks Tab displays the Infrastructure Network Table and Network Connectivity Table.
-
Incidents Tab displays all the incidents and alerts reported in the SPARC SuperCluster System.
-
20.3.3.1 Dashboard Tab
The dashboard comprises of three sections - Summary, Membership Graph, and Status.
20.3.3.1.1 Summary Pane
The Summary section displays the name of the SPARC SuperCluster system, description or the name of the system identifier, number of racks that are part of the system, and the number of unassigned incidents. The Unassigned Incidents icon in the summary pane includes incidents resulting from hardware faults. The three icons depict Critical Incidents, Warnings, and Information Incidents respectively. These incidents are from the assets that belong to all SPARC SuperCluster systems.
20.3.3.1.2 Membership Graph Pane
The Membership Graph pane displays the SPARC SuperCluster system as a hierarchy of its components showing the relationship between the SPARC SuperCluster system and fabrics that are grouped in the rack. You can instantly navigate to any asset by double-clicking on the asset in the membership graph.
Using the controls on the top right of the graphic pane, you can change the view of the graph to either a horizontal or a vertical orientation. You can also refresh the view by clicking the Refresh icon. You can also change the graph depths or size of the images.
20.3.3.1.3 Status Pane
The Status Pane displays the total unassigned incidents in chart format as well as the recent incidents encountered by the SPARC SuperCluster system. In the Recent Incidents section, the following details are displayed:
-
Severity - displays the severity of the incident.
-
State – Displays the state of the incident.
-
ID – Displays the incident ID.
-
Description – Displays the incident description.
-
Source – Displays the source of the incident.
-
Owner – Displays the name of the owner who reported the incident.
-
Creation Date – Displays the date on which the incident was created.
20.3.3.2 Details Tab
In the Details Tab, the following details are displayed:
-
SPARC SuperCluster System Name
-
Description
-
Master Subnet Manager
-
Number of Racks
-
Number of Compute Nodes
-
Number of Storage Nodes
-
Number of Exadata Storage Servers
-
Number of Switches
-
Number of PDUs
In the Tags pane, the tag names and their values are displayed. You can search for a particular tag using the Search feature.
20.3.3.3 Networks Tab
The Networks Tab displays the Infrastructure Networks Table and Network Connectivity Table.
The Infrastructure Networks Table displays the infrastructure networks that are defined and used inside the SPARC SuperCluster system for communication between the SPARC SuperCluster control components.
-
Network Name - displays the name of the managed network.
-
Network CIDR - displays the type of the asset.
-
Partition Key - displays the partition of the port.
-
IP Range - specifies the minimum and maximum boundaries of the IP addresses assigned to the network.
-
Roles - displays the role.
The Network Connectivity Table displays the infrastructure networks with IPs assigned to the individual hardware components of the SPARC SuperCluster system.
-
Network Name
-
Asset Type
20.3.3.4 Incidents Tab
The Incidents Tab displays all the unresolved incidents and alerts reported in the SPARC SuperCluster System.
20.3.3.5 Permitted Actions in the SPARC SuperCluster System View
You can perform the following actions.
To see the procedures for completing these tasks, refer
Oracle Enterprise Manager Ops Center Feature Reference Guide
-
Create Rack
-
Edit Tags
-
Add Assets
-
Find Assets
20.3.4 Viewing the SPARC SuperCluster System Rack
This section describes how to view the SPARC SuperCluster System rack, visualization of the rack physical layout, aggregated rack components, energy data, and other rack details. As an administrator, you can drill down to an asset contained in the rack (server, storage node, switch, Exadata Cells) or even further.
To view the SPARC SuperCluster System rack, perform the following steps:
-
On the Navigation pane, under Assets, select SuperCluster Systems.
-
Select a rack that you want to view.
The Dashboard, Details, Firmware, Incidents, Charts, Energy, and Jobs tabs are displayed in the center pane.
Figure 20-22 Tabs of the SuperCluster System Rack

Description of "Figure 20-22 Tabs of the SuperCluster System Rack"
-
Dashboard Tab – Displays the summary, membership graph, and status of the rack.
-
Details Tab – Displays the rack info with a photorealistic view of the rack.
-
Firmware Tab – Displays the name, description, and version of the firmware for each component and the slot for each component
-
Incidents Tab – Displays all unresolved incidents in the rack.
-
Charts Tab – Provides more ways to display the power utilization data. You can change the graphed data to a bar chart or an area chart. You can also export the data for either the current view or all available data to a file in either CSV or XML format.
-
Energy Tab – Reports power consumption as the current value and for a period of time, as well as attributes of the fan and power supplies.
-
Jobs Tab – Displays the current and historical jobs.
-
-
Select any of the tabs to view more details of the rack.
Refer To Hardware Monitoring section in the Hardware Management Guide for information on the Tabs and Views of the rack.
20.3.5 Photorealistic View of the SPARC SuperCluster System Rack
The photorealistic view represents the physical rack so that you can see the placement of the rack and its components.. The front and rear views of the rack are displayed in this view. All slots and the respective assets are displayed. Positions within the rack are displayed in a 3-dimensional view.
Each asset in the rack is represented by an image. The health status of assets such as OK, Warning, or Critical is displayed in the form of colored lights as seen on the physical rack itself. OK status is identified by the green color. Warning and critical status are identified by the yellow color. Hover the mouse over the slots in the rack and view details about the assets such as slot number, asset name and description, type of asset, model number of the asset, and its health status.
A question mark in any of the slots indicates a discrepancy from the baseline check. See Baseline Check for more information.
To see the photorealistic view of the rack, perform the following steps:
-
On the Navigation pane, under Assets, select SuperCluster Systems.
-
Select a rack that you want to view.
-
In the center pane, click the Details tab.
A photorealistic view of the SPARC SuperCluster System rack is displayed.
Figure 20-23 Photorealistic view of SPARC SuperCluster
Description of "Figure 20-23 Photorealistic view of SPARC SuperCluster"
20.3.6 Viewing the Exadata Storage Server
The Exadata Storage Server provides storage for the SPARC SuperCluster system. It is a sub-type of the Linux server installed to be a database node.The Exadata Storage Servers are grouped together in the Navigation pane. In the same way that you view the SPARC SuperCluster system and its rack, you can also view the Exadata Storage Servers.
To view the Exadata Storage Server, do the following:
-
On the Navigation pane, under Assets, select SuperCluster Systems from the drop-down menu.
-
Expand Exadata Storage Servers, and select an Exadata Storage Server. The server details are displayed on the center pane. Select the respective tabs on the center pane to view or perform actions.
Refer To
Hardware Monitoringsection in the Hardware Management Guide for information on the different views and tasks that can be performed on the server cells.
20.3.7 Discovering a SPARC SuperCluster Component
Manual discovery is necessary if a component has been replaced or some properties of a component has changed autonomously. The component can either be a compute node, storage, or switch.
To manually discover a SPARC SuperCluster component, do the following:
-
On the Navigation pane, select Plan Management.
-
Select Profiles and Policies, then select Discovery.
The available discovery profiles are listed in the center pane.
-
Select the required stored discovery profile and edit the profile and metadata if required.
-
Click Finish. The job is run and the component is discovered.
Add Assets to the SPARC SuperCluster Rack
After the asset is discovered, the new asset moves to the available asset poll. The asset must be added to the SPARC SuperCluster rack.
To add an asset to the SPARC SuperCluster rack, perform the following steps:
-
On the Navigation pane, under Assets, select SuperCluster Systems from the drop-down list.
-
Select the rack to which you want to add the asset.
-
On the center pane, click the Details tab. A photorealistic view of the rack is displayed.
-
Click the Add/Remove Asset in the rack.
-
Search for the right type of asset.
-
Assign or Remove the asset in the rack.
-
Save the rack changes. A rack modification job is created.
After the rack modification job is successful, the manually discovered asset appears in the SPARC SuperCluster rack.
20.3.8 Creating and Viewing Reports
In general, using reports, you can view the rack setup for each of the rack within the system including the asset details related to the rack. Reports provide information about your assets, such as job history, firmware, OS updates, and incidents. Reports are created in PDF and CSV formats. You can export reports or use reports to launch jobs on targeted assets.
To create a Report, see the How To library at http://docs.oracle.com/cd/E27363_01/nav/howto.htm.
You can either view existing reports that have been created or you can create a new report for yourself and view it.
In this section, the SPARC SuperCluster System Report is described in detail. The following sections of the report are described below:
Report Parameters displays the name and model of the SPARC SuperCluster system. It also displays the number of assets in the rack by their types, such as compute nodes, switches, storage nodes, and Exadata Storage Servers present in the system.
The Summary Table represents a table of contents of all tables in the report. It displays the number of records for each table.
The Compute Nodes Table displays the setup of the racks such as name of the asset (compute node), firmware version, hypervisor version, OBP version, LDOM manager version, and the location of the asset in the rack with the slot number where it is placed.
The Switches Table displays the name of the switch node, type of switch (infiniband or ethernet), firmware version, and location of the switch in the rack with the slot number where it is placed.
The Storage Appliances Table displays the name of the compute node, version of the service processor firmware, and the location of the appliance with the slot number where it is placed in the rack.
The Exadata Storage Servers table displays the name of the compute node, version of the service processor firmware, and the location of the appliance with the slot number where it is placed in the rack.
Power Distribution Units Table
The Power Distribution Units Table displays the name and firmware version of the PDUs.
The Validation Table displays the location, type, name, validation result, and expected components of the rack. A baseline check is performed against the known schema for the rack. See Baseline Check for more information. The expected component column in the table displays the expected component if the placed component in the slot does not match the schema when the baseline check was performed.
20.4 Related Resources
For instructions on performing actions or to learn more about Oracle Engineered Systems, see the following resources.
-
Enabling Single Root Input Output Virtualization in Exalogic Elastic Cloud at
http://docs.oracle.com/cd/E27363_01/doc.121/e35262/toc.htm. -
Discovering and Managing a Power Distribution Unit at
http://docs.oracle.com/cd/E27363_01/doc.121/e27338/toc.htm. -
Creating a SPARC SuperCluster Report at
http://docs.oracle.com/cd/E27363_01/doc.121/e29308/toc.htm.