30 Verifying Your Analytics Installation
This chapter contains procedures for verifying the operation of your newly installed Analytics application and its components.
This chapter contains the following sections:
30.1 Verification Steps
In this section, you will start Hadoop, the HDFS Agent, and Hadoop Jobs and then complete the following steps:
-
Verify that the Analytics reporting interface can be displayed:
-
Verify that the Analytics administrator interface can be displayed:
To verify your Analytics installation
-
Start Hadoop.
-
Start the HDFS Agent (execute
run.sh, located in thebinfolder):cd ${ANALYTICS_HOME}/hdfsagent/bin chmod +x run.sh ./run.sh
where
ANALYTICS_HOMEis the Analytics installation directory. -
Before starting Hadoop Jobs, do the following to ensure uninterrupted operation of Hadoop Jobs:
-
Edit the file
/etc/security/limits.conf -
Change the value of
soft nofileandhard nofileto65536. -
Open a new shell where Hadoop will be run. Make sure
ulimit -nis at least1024.
-
-
Start Hadoop Jobs (execute
run.sh, located in thebinfolder):Note:
The JVM must have at least 512MB of memory in order for the Hadoop Job scheduler to run when Hadoop starts. If memory is insufficient, add the memory parameter-Xmx512mto therun.shfile in Hadoop Jobs.As the Hadoop Job scheduler is the master of the HDFS, all HDFS Agents must be restarted when you restart the scheduler.
cd ${ANALYTICS_HOME}/hadoop-jobs/bin
chmod +x run.sh
./run.sh
-
Verify that data capture works:
-
Make sure that the application server is running on the server where the Analytics Sensor is installed.
-
Run the
verify_installutility to access the URL of the Analytics Sensor. On a multi-server installation, run theverify_installutility on all the data capture servers. (Theverify_installutility contains a sample object impression for testing Hadoop Jobs.)-
UNIX:
./analytics_install.sh verify_install
-
Windows:
analytics_install.bat verify_install
The system returns a preview thumbnail (as a 1x1-pixel
giffile). The incoming raw data is written by the Analytics Sensor to thedata.txt.tmpfile (see Figure 30-1). -
The
data.txt.tmpfile is stored in the local file system, in a folder. The folder is specified in thelogwriterelement (rootpathattribute) inglobal.xml(see Table 28-3). The sensor will rotate thedata.txt.tmpfile todata.txtwhen either the threshold interval is reached (see thesensor.thresholdproperty in Table 28-1), or the application server is restarted.For example, if the folder is specified as
<logwriter type="LFS" name="LFS" rootpath="C:/analytics/data"/>, then the raw captured data will be written to the folder structure shown in Figure 30-1, starting with the/analytics/data/folder. The raw data is collected intodata.txt.tmpand, after rotation, stored indata.txt. The folders namedoirawdataandsesrawdataare system defaults. -
-
Verify the HDFS Agent:
-
Make sure that the HDFS Agent has successfully copied
data.txt(and its directory structure) from the local file system to HDFS. The HDFS Agent handlesdata.txtas follows:-
Copies the
data.txtfile from the local file system to a folder in HDFS. The HDFS folder is specified by thehadoop.hdfs.defaultfsparameter inglobal.xml(see Table 28-1). -
When
data.txtis successfully copied, it is removed from the local file system.
-
-
To verify the actions of the HDFS Agent and inspect the file system, open the Hadoop HDFS web interface, running on your master node (
http://<hostname_MasterNode>:50070/) and browse the folder.
-
-
Verify Hadoop Jobs:
Hadoop Jobs processes the data that is copied by HDFS Agent from the local file system to HDFS. To view the status of the jobs, open the JobTracker web interface URL:
http://<hostname_MasterNode>:50030/
In the JobTracker web interface, the "RUNNING Jobs" section displays the
OIProcessorjobs. After theOIProcessorjobs are completed,OIInjectionjob will start and will insert the data into the Analytics database.Note:
A series of session and visitor jobs will also run. When the jobs are completed, their status will be reported in the "Status Summary" panel of the Analytics Administrator application. You will verify the jobs in 9, when you log in to the Administrator application. -
Verify that the Analytics reporting interface can be displayed:
Log in to the Analytics reporting application at the following URL, with user name
csuserand passwordcsuser:http://<hostname:port>/analytics
where
<hostname>is the host name of the server on which the reporting application is installed.Note:
Thecsuser(passwordcsuser) is a default that ships with Analytics. This user has administrative rights in Analytics. Log in ascsuser/csuserwhen you need to work in the Analytics administration interface (for example, in the Integrating Oracle WebCenter Sites: Analytics with Oracle Web Center Sites chapter in the Oracle Fusion Middleware WebCenter Sites: Analytics Administrator's Guide you will integrate Analytics with WebCenter Sites).If the database connection fails, the system will display a message denoting that fact.
-
Verify that the Analytics administrator interface can be displayed:
Log in to the Analytics Administrator application at the following URL, with user name
csuserand passwordcsuser:http://<hostname:port>/analyticsadminwhere
<hostname>is the host name of the server on which the administrator application is installed.The opening screen (Figure 30-2) displays the "Status Summary" panel of locations and processors.
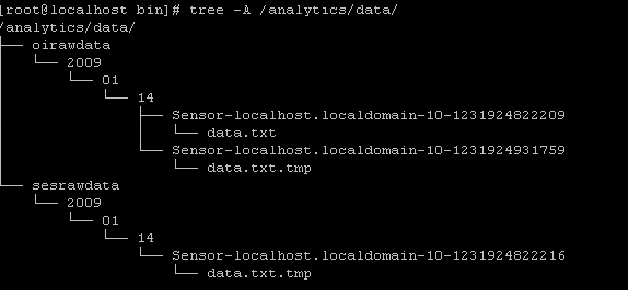
Figure 30-2 Analytics Administrator Interface (In the Components tab, the Overview option)
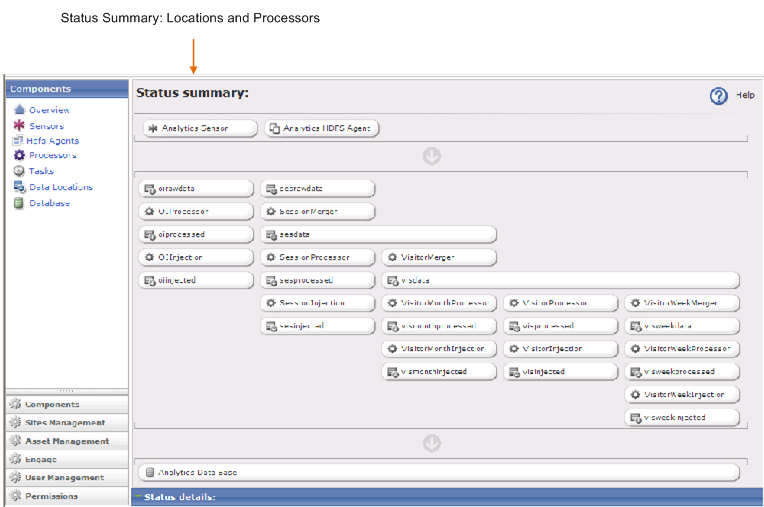
Description of ''Figure 30-2 Analytics Administrator Interface (In the Components tab, the Overview option)''
Here, you can monitor the status of various components. For example:
-
You can monitor the Analytics Sensor to ensure that it is functioning and responding properly to site traffic. (For more information about monitoring the Sensor and responding to alerts, see Sensor Overload Alerts.)
-
You can stop the Analytics Sensor.
-
You can verify Hadoop Jobs by clicking on a location or processor to view its status. (For more information about Hadoop Jobs and the "Status Summary" panel, see the chapter "Reference: Hadoop Jobs Processors and Locations" in the Oracle Fusion Middleware WebCenter Sites: Analytics Administrator's Guide.
30.2 Recommended Configurations
30.2.1 Installer Files
When you have verified your Analytics installation, keep the installer files on their respective hosts. Should you need to modify operating parameters at a later time, you can rerun the installer. Modifying operating parameters manually is not recommended.
Installer files are the following:
-
libis the folder that contains all the additionaljarfiles needed to support the silent installer when it runs. -
analytics-build.propertiescontains all the properties that define how the Analytics product should be installed on your system. -
analytics-build.xmlis the Ant build script to perform the silent installation. -
analytics_install.batis the batch file that runs the silent installer in a Windows command window. -
analytics_install.shis the UNIX/Linux shell script that runs the silent installer. -
analytics-silent-install.jarcontains all the custom Java classes that are required by the silent installer. -
log4j.propertiesis used to configure logging behavior such as output target, type and level of message, and the format of messages at runtime.
30.2.2 Sensor Overload Alerts
During heavy site traffic, the Analytics Sensor can become overloaded with incoming data and stop responding normally. The Analytics Sensor will stop writing to the file system and will instead store incoming data in memory, until an out-of-memory condition is reached.
The Analytics Administrator interface (Figure 30-2) alerts you to an "overload" condition by displaying the Analytics Sensor button in either yellow or red. Yellow indicates a WARNING condition. Red indicates a CRITICAL condition (assuming the sensor is running).
Note:
A stopped or non-functional Analytics Sensor is also displayed in red.30.2.2.1 Setting an 'Overload Alert' Threshold
Properties in global.xml determine the threshold that triggers a WARNING or CRITICAL condition. The properties are sensor.requestqueue.warnsize and sensor.requestqueue.maxsize. Set these properties to a threshold that is compatible with the configuration of your Analytics installation and the volume of site traffic. For more information about these properties, see Table 28-1.
30.2.2.2 Responding to a "red" Condition
If you are monitoring the "Status Summary" panel (in the Administration interface, Figure 30-2) and you notice that the Analytics Sensor button is displayed in red, you need to determine whether the Sensor has stopped, has failed, or is overloaded. In case of overload, you will need to clear the memory in order to reset the system and resume normal functioning. Data cleared from memory cannot be retrieved and will be lost.
To respond to a "red" condition
Click the Analytics Sensor button and note the main panel.
-
If you see
"No data available", the Analytics Sensor has either stopped or failed. -
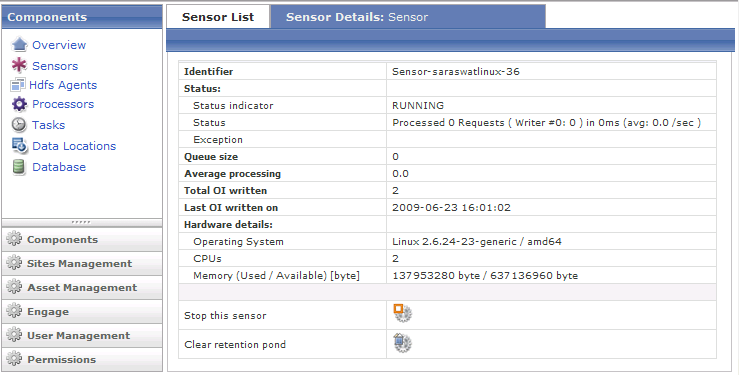
If you see the "Sensor Details" panel, the Analytics Sensor is running, but it is overloaded. Click the icon labeled "Clear retention pond" to clear the memory (Figure 30-3).
30.2.3 Geolocation Database
GeoLite City is a highly optimized geolocation database provided by MaxMind. GeoLite City is in binary format for performing fast lookups. It is used by Analytics for the information it contains: country, region, area code, metro code, city, and postal code. The GeoLite City database is updated monthly, at the beginning of each month, by MaxMind.
To install the latest GeoLite City database
-
Download the GeoLite City database in binary format from the following location:
http://geolite.maxmind.com/download/geoip/database/GeoLiteCity.dat.gz -
Uncompress the file:
-
On Windows: Use the winzip or zip program to unzip the file.
-
On UNIX: Use the
tarcommand to uncompress the file:tar xvzf GeoLiteCity.dat.gz
-
-
Copy the
GeoLiteCity.datfile to theCACHEfolder under the analytics installation folder on the server where the Hadoop Jobs application is installed:On UNIX:
cp GeoLiteCity.dat <ANALYTICS_INSTALL_DIR>/CACHE
30.3 Next Step
If you have successfully completed all the steps in this chapter, then Analytics is ready to be integrated with WebCenter Sites and enabled for data capture as well as report generation.
Integrating and enabling Analytics is a collaborative process among administrators and developers.
-
An administrator registers pages and other asset types with Analytics to enable their recognition and inclusion in reports. An administrator also grants users permissions to generate reports.
-
Developers ensure that reports are filled with data by enabling data capture on published pages and verifying that the set of default Hadoop Jobs processes raw data and stores the results for retrieval into reports.
For more information about integration, data capture, and data processing, see the Oracle Fusion Middleware WebCenter Sites: Analytics Administrator's Guide and the Oracle Fusion Middleware WebCenter Sites: Analytics Developer's Guide.