30 System Tools
The System Tools node on the Admin tab provides a range of diagnostic utilities that general administrators can use to troubleshoot directly from the WebCenter Sites administrator's interface. Features include configuring log4j loggers, accessing various types of system information, managing caches, searching the contents of the WebCenter Sites log, and testing the performance of the shared file system.
This chapter contains the following sections, each covering a sub-node of System Tools:
30.1 Configure log4j
If WebCenter Sites is set up to use the Apache log4j logging system, the Configure log4j tool enables you to view current logger levels, change logger levels, and add new loggers directly from the administrator's interface. In addition, since changes to logger levels and added loggers remain in effect only until WebCenter Sites is restarted, you can retain your changes by copying a test version of the logger properties to the log4j.properties file.
This section contains the following topics:
30.1.1 Setting Up Apache log4j
If WebCenter Sites was not set up to use log4j during the upgrade process, you can manually switch to log4j by configuring the commons-logging.properties and log4j.properties files in the WEB-INF/classes directory.
-
In the
commons-logging.propertiesfile, update the following property to set log4j as WebCenter Sites' logging system:org.apache.commons.logging.Log= org.apache.commons.logging.impl.Log4JLogger
-
Open the
log4j.propertiesfile and do the following:-
Add the
FWDefaultAppenderfile appender properties:log4j.rootLogger=INFO, FWDefaultAppender log4j.appender.FWDefaultAppender.File=<path to futuretense.txt>/futuretense.txt
Note:
Thefuturetense.txtfile is typically located in the WebCenter Sites installation directory.log4j.appender.FWDefaultAppender.Append=true log4j.appender.FWDefaultAppender.BufferSize=256 log4j.appender.FWDefaultAppender.MaxFileSize=10MB log4j.appender.FWDefaultAppender.encoding=UTF-8 log4j.appender.FWDefaultAppender.layout.ConversionPattern=[%d] [%c{4}] %m%n log4j.appender.FWDefaultAppender=org.apache.log4j.RollingFileAppender log4j.appender.FWDefaultAppender.MaxBackupIndex=15 log4j.appender.FWDefaultAppender.layout=org.apache.log4j.PatternLayout log4j.appender.FWDefaultAppender.bufferedIO=false -
Copy the loggers in the
commons-logging.propertiesfile to thelog4j.propertiesfile. Prependlog4j.logger.to each logger name. For example:com.fatwire.logging.cs.authbecomeslog4j.logger.com.fatwire.logging.cs.auth.
-
For information about the file appender properties and other log4j-specific properties, refer to the Apache log4j documentation. For information about WebCenter Sites loggers, see the commons.logging-properties documentation in the Oracle Fusion Middleware WebCenter Sites Property Files Reference.
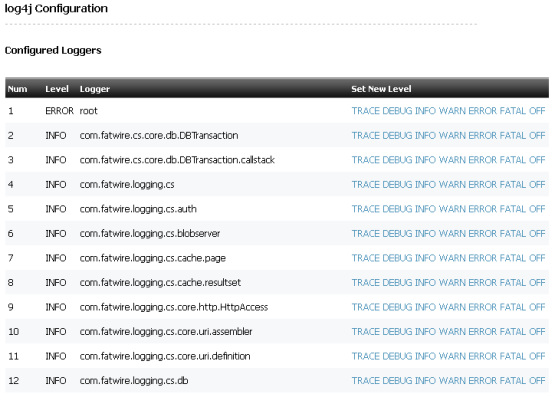
30.1.2 Viewing Loggers
You can view a list of WebCenter Sites loggers and their verbosity levels. The list includes the following:
-
Loggers that are registered in the
log4j.propertiesfile, in theWEB-INF/classesdirectory. The file is read only on system startup. If, during runtime, you make changes to thelog4j.propertiesfile and save them, your changes will not be displayed in the log4j Configuration form. They will be applied and displayed when WebCenter Sites is restarted. -
Loggers that are detected during runtime. The loggers are detected when:
-
System features or add-on components are accessed for the first time.
-
The loggers are added to the system manually by developers using the Add Logger feature, as shown in Section 30.1.4, "Adding New Loggers."
-
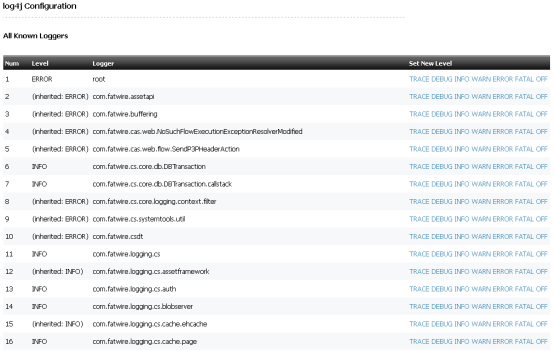
The collapsed view of the list shows the root logger and parent loggers, all of which are explicitly assigned verbosity levels. If you require a more granular view, you can expand the list to also show loggers that inherit levels from the root logger or parent loggers.
-
On the Admin tab, expand System Tools and double-click Configure log4j.
The list of loggers with explicitly assigned levels is displayed.
-
To expand the list to include loggers that inherit levels, click Show All Known Loggers at the bottom of the form.
Loggers that inherit levels are listed below their parent loggers.
-
To view only loggers with explicitly assigned levels once again, click Show Configured Loggers at the bottom of the form.
30.1.3 Changing Logger Levels
You can temporarily change logger levels to define the type and number of statements that get written to the WebCenter Sites log specified in the log4j.properties file. Your changes are applied right away; as soon as the loggers are executed, you can track the impact of their new levels in the log. The new levels remain in effect only until WebCenter Sites is restarted, but if you wish to retain the changes, you can copy a text version of the logger properties to the log4j.properties file in the WEB-INF/classes directory on your application server.
This option is particularly useful when you want to temporarily override inherited logger levels. For example, if a parent logger is set to a high-verbosity level such as TRACE and you want to prevent one of its child loggers from inheriting that level, you can assign the child logger a different level.
The following logger levels are available, listed in order of decreasing verbosity:
TRACE, DEBUG, INFO, WARN, ERROR, FATAL, OFF
OFF indicates that a logger does not write any statements to the log. For more information about logger levels, refer to the Apache log4j documentation.
-
On the Admin tab, expand System Tools and double-click Configure log4j.
The list of loggers with explicitly assigned levels is displayed. If you require a more granular view, you can click Show All Known Loggers at the bottom of the form to expand the list to include loggers that inherit levels from parent loggers.
-
Find the logger that you want to change and select a new logger level in the Set New Level column.
The new level is displayed in the Level column. As soon as the logger is executed, you can track the impact of the new level in the log (see Section 30.8, "Log Viewer").
-
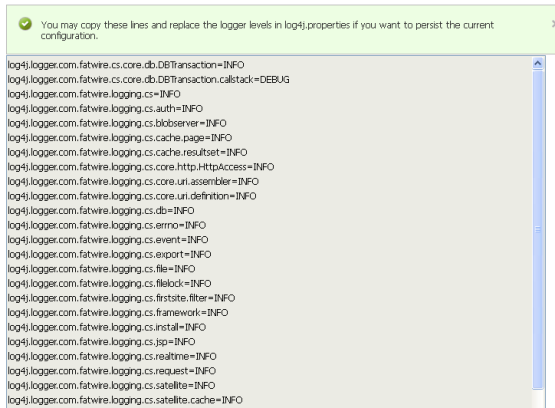
If you want the new logger level to remain in effect after WebCenter Sites is restarted, do the following:
-
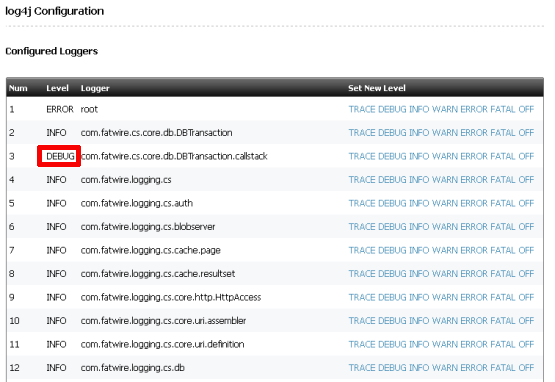
Click Show Current Logger Levels As .properties at the bottom of the form.
The loggers with explicitly assigned levels are displayed as text.
Figure 30-4 Form Showing Loggers with Explicitly Assigned Levels
Description of ''Figure 30-4 Form Showing Loggers with Explicitly Assigned Levels''
-
Copy the changed logger to the
log4j.propertiesfile in theWEB-INF/classesdirectory on your application server. -
Save the log4j.properties file.
-
30.1.4 Adding New Loggers
If you wish to add new loggers to the log4j framework in your WebCenter Sites system and you do not want them to inherit verbosity levels from the root logger or parent logger, you can add the loggers via the administrator's interface and assign each of them a verbosity level. (If you add your own custom loggers, be sure to deploy the supporting class and jar files.)
Assigned verbosity levels remain in effect only until WebCenter Sites is restarted, but if you wish to apply the levels permanently, you can copy a text version of the logger properties to the log4j.properties file in the WEB-INF/classes directory on your application server.
-
On the Admin tab, expand System Tools and double-click Configure log4j.
The list of loggers with explicitly assigned levels is displayed.
-
In the field below the list of loggers, enter the name of the logger you want to add and select its verbosity level.
-
Click Add Logger.
The new logger is added to the list. As soon as the logger is executed, you can track the impact of the assigned level in the log (see Section 30.8, "Log Viewer").
-
If you want the added logger to remain in effect after WebCenter Sites is restarted, do the following:
-
Click Show Current Logger Levels As .properties at the bottom of the form.
The loggers with explicitly assigned levels are displayed as text.
Figure 30-5 Form Showing Loggers with Explicitly Assigned Levels
Description of ''Figure 30-5 Form Showing Loggers with Explicitly Assigned Levels''
-
Copy the added logger to the
log4j.propertiesfile in theWEB-INF/classesdirectory on your application server. -
Save the
log4j.propertiesfile.
-
30.2 System Information
The System Information tool provides immediate access to various types of WebCenter Sites, database, and thread information for troubleshooting and checking the health of your application. You can download information to a file or view information directly in the administrator's interface.
This section contains the following topics:
-
Section 30.2.3, "Thread Information"
Note:
You can download all available system information and a list of all WebCenter Sites directories and files on the application server by right-clicking the System Information tool and selecting Download. If Sigar is configured, you can also download Sigar information to send to Technical Support by right-clicking the tool and selecting System Details (Sigar).
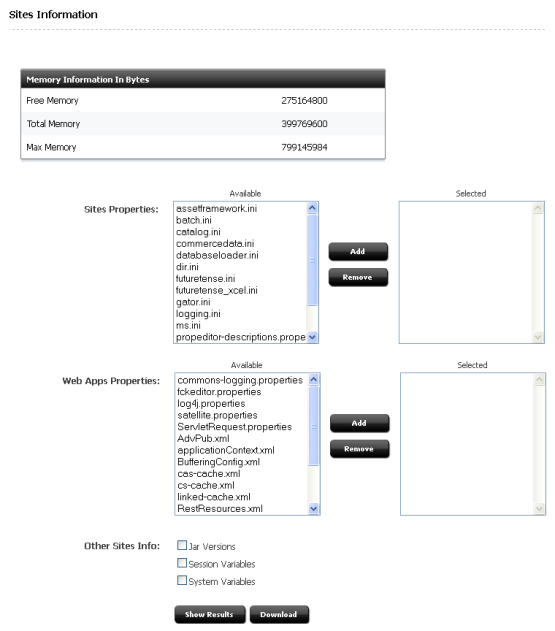
30.2.1 WebCenter Sites Information
You can download or view the following types of WebCenter Sites information:
-
Memory Information – The amount of free memory in the application server Java Virtual Machine, the total amount of memory free and in use, and the maximum amount of memory that the Java Virtual Machine will attempt to use.
-
Sites Properties – The
ini,xml, andpropertiesfiles in the WebCenter Sites installation directory. -
Web Apps Properties – The
xmlandpropertiesfiles in theWEB-INFandWEB-INF/classesdirectories on the application server. -
Other Sites Info – The
jarfiles in theWEB-INF/libdirectory on the application server, the session variables for the user currently logged in to WebCenter Sites, and the Java run-time properties.
To download or view WebCenter Sites information
-
On the Admin tab, expand System Tools, then expand System Information, and double-click Sites Info.
The WebCenter Sites Information form shows memory information as well as additional information that you can select to download or view.
-
In the Sites Properties and Web Apps Properties sections, select the files that you are interested in and click Add.
-
In the Other Sites Info section, do the following:
-
To obtain information about the
jarfiles in theWEB-INF/libdirectory on the application server, select the Jar Versions check box. -
To obtain the session variables for the user currently logged in to WebCenter Sites, select the Sites Session Variables check box.
-
To obtain Java run-time properties, select the System Variables check box.
-
-
To download the selected WebCenter Sites information as a text file, click Download and then open or save
SysInfo.zip. The text file is insideSysInfo.zip. -
To view the selected WebCenter Sites information in the administrator's interface, click Show Results.
-
The selected files and information are displayed directly in the administrator's interface.
-
To view the details of a file or type of information, click its "plus" icon.
For
iniandpropertiesfiles, as well as WebCenter Sites session variables and system variables, the properties and values are displayed.Figure 30-7 Properties and Values for batch.ini
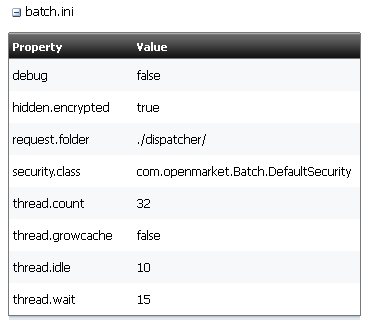
Description of ''Figure 30-7 Properties and Values for batch.ini''
For
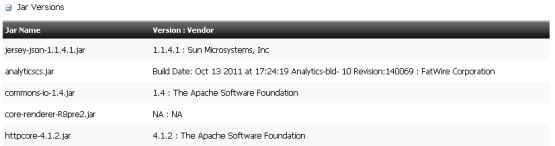
xmlfiles, the code is displayed.For Jar Versions, the
jarnames, versions, and implementation vendors are displayed.NA : NAindicates that ajarfile does not provide its version and vendor.
-
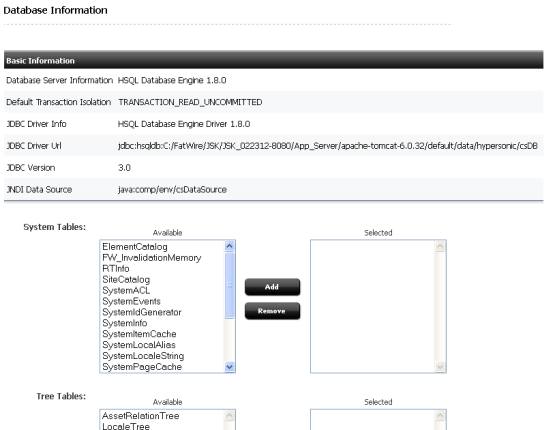
30.2.2 Database Information
You can download or view the following types of database information:
-
Basic Information – The database engine and version, default transaction isolation level, JDBC driver, URL, and version, and JNDI data source.
-
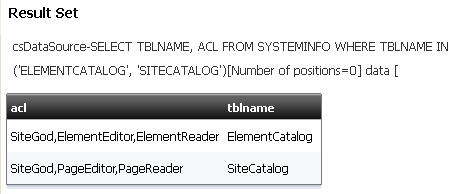
System Tables – Tables that store core WebCenter Sites data. The ElementCatalog table, for example, lists all of the XML or JSP elements used in your system.
-
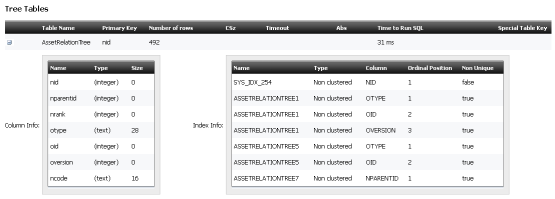
Tree Tables – Tables that store parent-child relationships between objects. The AssetRelationTree, for example, stores information about the associations between assets.
-
Sites Object Tables – Tables that store uniquely identified objects, such as asset types, asset attributes, and asset definitions.
-
Other Sites Tables – Tables that store flat data that cannot be organized into parent-child relationships and the foreign tables that WebCenter Sites does not manage.
Note:
You have permission to access a database table if at least one of the Access Control Lists (ACLs) assigned to the table is assigned to your user. For more information about database permissions, see Section 4.2, "ACLs." For more information about the different types of WebCenter Sites database tables, see the Oracle Fusion Middleware WebCenter Sites Developer's Guide.
To download or view database information
-
On the Admin tab, expand System Tools, then select System Information and double-click DB Info.
The Database Information form shows basic information about your database as well as the tables that you can select to download or view.
-
In the System Tables, Tree Tables, Sites Object Tables, and Other Sites Tables sections, select the tables that you want to view and click Add.
-
To download the selected database information as a spreadsheet file, click Download and then open or save
SysInfo.zip. The spreadsheet file is insideSysInfo.zip. -
To view the selected database information in the administrator's interface, click Show Results.
-
For each selected table that you have permission to access, the following information is displayed:
-
Table Name
-
Primary key
-
Number of rows
-
CSz (number of resultsets to cache in memory)
-
Timeout (number of minutes to keep a resultset cached in memory)
-
Abs (how to calculate the expiration time for resultsets)
-
Time to run SQL
-
Special table key
-
-
To view a table's column and indices, click its "plus" icon. If an index is listed more than once, it extends across multiple columns.
-
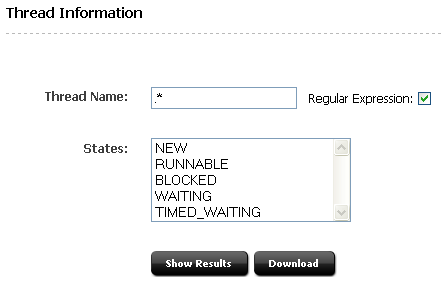
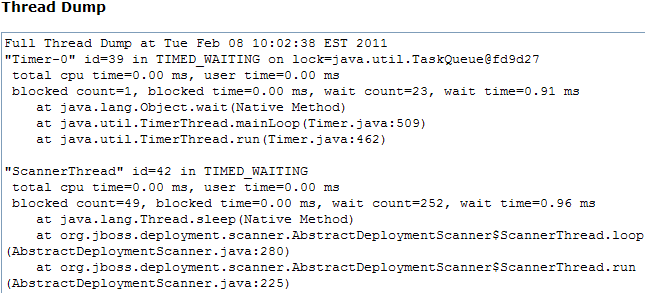
30.2.3 Thread Information
You can download or view thread dumps to analyze the runtime state of the application server. This can be especially useful when trying to detect problems that might result in resource starvation or thread hangs.
To download or view thread information
-
On the Admin tab, expand System Tools, then expand System Information and double-click Thread Info.
The Thread Information form is displayed.
-
The Regular Expression check box is selected by default. This option enables you to use Java regular expressions to search for thread names.
Examples:
-
Thread.* to find
Thread-0,Thread-1, andThread-3 -
.*thread.* to find
pool-6-thread-1,pool-8-thread-1, andpool-14-thread-2
If you deselect the check box, you must search for exact thread names.
-
-
In the Thread Name field, enter the thread name or text string that you want to search for.
-
If you want to limit your search to one or more thread states, select the state(s) in the States field. If you do not select a state, all states will be searched.
-
To download the selected thread information as a text file for use with a thread dump analyzer, click Download and then open or save
SysInfo.zip. The text file is insideSysInfo.zip.Note:
Downloading thread information is possible only in the following cases:-
WebCenter Sites' JDK includes a compatible
jstackutility. -
The first JDK listed in your operating system's library path includes a
jstackutility that is compatible with WebCenter Sites' JDK.
If a compatible
jstackis not found, the following message displays: "Thread dump feature is not supported for this platform." -
-
To view the selected thread information in the administrator's interface, click Show Results. For each thread matching the search, the following information is displayed:
-
Name
-
ID
-
State
-
Total time the CPU executed the thread
-
Total time the thread was in user mode
-
Number of times it was blocked and waited
-
How long it was blocked and waited
-
Object for which it is waiting
-
Stack trace
-
30.3 Cache Management
If the inCache framework is set up for page caching, asset caching, or both, the Cache Management tool enables you to monitor the caching processes on WebCenter Sites cluster members and their co-resident Satellite Servers. Features include cache searching, force writing to disk, and flushing individual pages, assets, dependencies, and entire caches. For information about setting up the inCache framework, see Chapter 28, "inCache for Page Caching" and Chapter 29, "inCache for Asset Caching."
Note:
The Cache Management tool provides caching information only for WebCenter Sites cluster members and their co-resident Satellite Servers. To access cache information for remote Satellite Servers, use the following URL:http://<server>:<port>/<application_context_path>/Inventory?username=<SatelliteServer>&password=<password>&detail=debug
30.4 Cache Management - CAS Cache
This section includes the following topics:
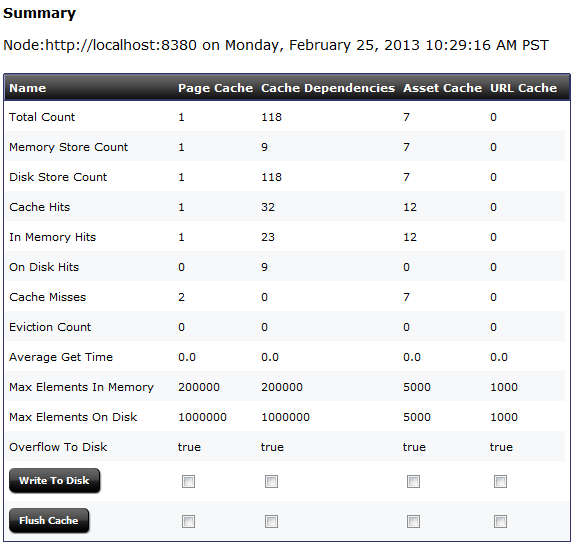
30.4.1 Summary
This form lists the following basic data for each cache (values are estimates):
-
Total Count (total number of cached elements)
-
Memory Store Count (number of cached elements in memory)
-
Disk Store Count (number of cached elements on disk)
-
Cache Hits (number of cached elements retrieved from both memory and disk)
-
In Memory Hits (number of cached elements retrieved from memory)
-
On Disk Hits (number of cached elements retrieved from disk)
-
Cache Misses (number of times elements were not found in the cache)
-
Eviction Count (number of elements evicted from the cache)
-
Average Get Time (average number of milliseconds for retrieving an element)
-
Max Elements In Memory (maximum number of elements allowed in memory)
-
Max Elements On Disk (maximum number of elements allowed on disk)
-
Overflow to Disk (whether elements are written to disk when memory is full)
This form also provides the following options. They should be used with caution, especially on a delivery system, as they can impact the performance of your site.
-
Writing a cache's entire memory store to disk – This option can be particularly useful if WebCenter Sites is not set up to automatically write a cache's memory store to disk before shutting down.
-
Flushing a cache's entire memory and disk stores.
Note:
If legacy page caching is enabled, cached page data is stored in theSystemPageCache table and information about the stored data is not displayed in the Summary window.To view and work with summary cache information
-
On the Admin tab, expand System Tools, then select Cache Management, then expand CAS Cache and double-click Summary.
The Summary page displays.
-
Select the checkbox for the Ticket Cache or the Session Cache (or both) and click Write To Disk to write the selected cache's entire memory store to disk.
-
Select the checkbox for the Ticket Cache or the Session Cache (or both) and click Flush Cache to flush the memory and disk stores for the selected caches.
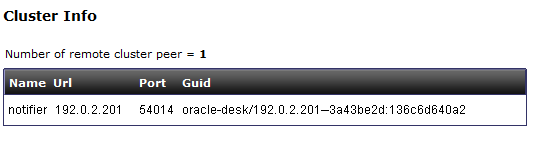
30.4.2 Cluster Info
If Sigar is configured, this form lists the name, URL, port, and GUID of each additional WebCenter Sites cluster member.
To view the cluster information, expand System Tools on the Admin tab, then select Cache Management, then expand CAS Cache and double-click Cluster Info.
30.5 Cache Management - Resultset Cache
Oracle WebCenter Sites caches resultsets to help optimize system performance. Caching prevents overloading the database with repeated queries for the same information, and serving from cache is always faster than performing another database lookup.
By default, Oracle WebCenter Sites stores resultsets within the inCache framework, instead of hash tables. Both caching frameworks use Java memory. You can switch between frameworks by setting the rsCacheOverInCache property in futuretense.ini to either true or false.
When resultset caching over inCache is enabled, the System Tools node displays the Resultset Cache tool, which provides statistical information about the caches and their contents as described in this section. Additional information about resultset caching is available in the Oracle Fusion Middleware WebCenter Sites Developer's Guide.
This section contains the following topics:
30.5.1 Enabling and Configuring Resultset Caching over inCache
If you do not enable resultset caching over inCache, caching in hash tables is enabled by default.
To enable and configure resultset caching
-
Enable resultset caching:
-
Make sure the
linked-cache.xmlconfiguration file is present in the application server's classpath (WEB-INF/classesdirectory). -
In the
futuretense.inifile, set thersCacheOverInCacheproperty totrue.
-
-
Configure resultset caching:
In the
futuretense.inifile, set values for the following resultset caching properties:-
cc.cacheResults– Specify the default number of resultsets to cache. -
cc.cacheResultsTimeout– Specify the number of minutes to keep a resultset cached. -
cc.cacheResultsAbs– Specify how expiration time will be calculated for cached resultsets.
For detailed information about configuring resultset caching properties, see the Oracle Fusion Middleware WebCenter Sites Property Files Reference.
-
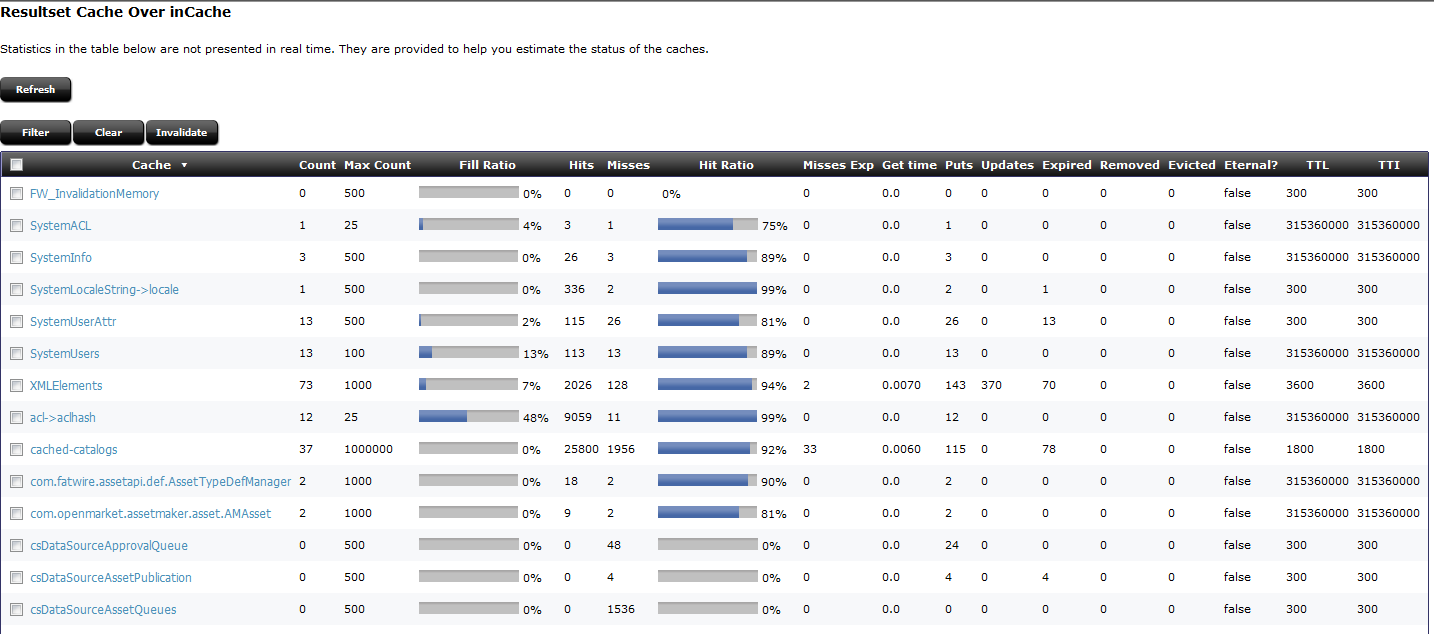
30.5.2 Summary
The summary view of resultset cache displays statistical information about all caches. You can select a cache from the summary table to view the database queries it contains. You can further view the resultset elements of the database queries contained in a cache.
-
On the Admin tab, expand System Tools then select Cache Management, then expand Resultset Cache and double-click Summary.
The summary table displays.
Figure 30-16 Resultset Cache over InCache Summary
Description of ''Figure 30-16 Resultset Cache over InCache Summary''
-
Click one of the following options, located above the summary table:
-
Refresh refreshes the results of the summary table.
-
Filter (caches) narrows down the results shown in the summary table to only selected caches.
-
Clear clears selected caches.
-
Invalidate invalidates selected caches. All invalidated resultset elements are purged by the cleaning thread, which runs periodically.
Each resultset element contains a list of tables on which it depends. When an invalidated resultset element is requested, it will be read from the database and reloaded into cache.
Table 30-1 Descriptions of Columns in the Summary Table
Column Name Description Cache
Name of the cache.
Count
Number of resultset elements in the cache. A resultset element is a key-value pair, where the key is the query and the value is the result returned by the query.
MaxCount
Capacity of the cache (maximum number of resultset elements allowed in the cache).
Fill Ratio
Percentage of cache filled:
(Count / MaxCount) x 100Hits
Total number of times all resultset elements were read from the cache.
Misses
Number of times the resultset element was not found in cache.
Hit ratio
Percentage of hits: [
Hits / (Hits + Misses)] x 100Misses Exp
Number of misses due to resultset elements that are expired but not removed.
Get time
Average time (in ms) for
getoperations.Puts
Number of times resultset elements were placed in the cache following a database query.
Updates
Number of times individual resultset elements in the cache have been updated.
Expired
Number of expired resultset elements. They are removed by a cleaning thread that runs periodically in the background.
Removed
Number of resultset elements removed for any reason (such as a manual clear operation or cleaning thread).
Evicted
Number of evicted resultset elements. Eviction occurs when the capacity of the cache is exceeded.
Eternal
Indicates whether all resultset elements in the cache have infinite expiration time.
TTL
Time to live. Length of time (in seconds) that resultset elements will remain in cache.
TTI
Time to idle. If a resultset element is not hit (read from cache) within this time period, it is marked as idle.
-
-
To view detailed information about the contents of a cache, click the cache name in the summary table.
The detail view opens to show the keys (queries), their related statistics, and a search field for locating the cache's content by key, expiration time, and dependency.
To refresh your form, click Search.
Figure 30-17 Detail View for Cache Contents
Description of ''Figure 30-17 Detail View for Cache Contents''
Table 30-2 Descriptions of Columns in the Cache Detail Table
Column Name Description Key
Key (query) for the resultset element.
Dependencies
List of tables against which the query was run.
Created time
When this resultset element was placed in the cache.
Last accessed time
When this cached resultset element was last accessed.
Expired time
When this resultset element will expire.
-
To view the resultset element for a key, click the desired key (query).
Columns in the table that opens are dynamic and depend on your site's data model and how the query is set up.
30.5.3 Cluster Info
If Sigar is configured, this form lists the name, URL, port, and GUID of each additional WebCenter Sites cluster member.
To view the cluster information, expand System Tools on the Admin tab, then select Cache Management, then expand Resultset Cache and double-click Cluster Info.
30.6 Cache Management - Sites Cache
Sites Cache Cache management.
This section contains the following topics:
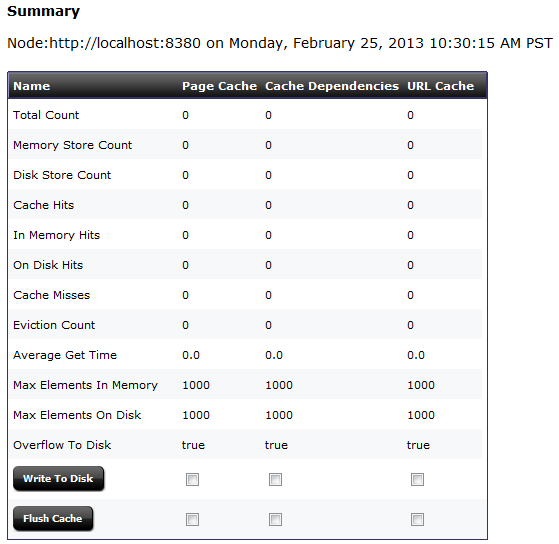
30.6.1 Summary
This form lists the following basic data for each cache (values are estimates):
-
Total Count (total number of cached elements)
-
Memory Store Count (number of cached elements in memory)
-
Disk Store Count (number of cached elements on disk)
-
Cache Hits (number of cached elements retrieved from both memory and disk)
-
In Memory Hits (number of cached elements retrieved from memory)
-
On Disk Hits (number of cached elements retrieved from disk)
-
Cache Misses (number of times elements were not found in the cache)
-
Eviction Count (number of elements evicted from the cache)
-
Average Get Time (average number of milliseconds for retrieving an element)
-
Max Elements In Memory (maximum number of elements allowed in memory)
-
Max Elements On Disk (maximum number of elements allowed on disk)
-
Overflow to Disk (whether elements are written to disk when memory is full)
This form also provides the following options. They should be used with caution, especially on a delivery system, as they can impact the performance of your site.
-
Writing a cache's entire memory store to disk – This option can be particularly useful if WebCenter Sites is not set up to automatically write a cache's memory store to disk before shutting down.
-
Flushing a cache's entire memory and disk stores
Note:
If legacy page caching is enabled, cached page data is stored in theSystemPageCache table and information about the stored data is not displayed in the Summary window. In addition, this window displays the Clear Page Cache button which allows you to flush the stored data in System Page Cache and Co-Res SS Cache.
As System Page Cache is legacy, it must be enabled for use. This is done by disabling ehcache by including the following as a JVM parameter of appserver:
-Dcs.useEhcache=false
To view and work with summary cache information
-
On the Admin tab, expand System Tools, then select Cache Management, then expand Sites Cache and double-click Summary.
The Summary page displays.
-
Select the checkbox for the PageCache, Cache Dependencies, Asset Cache, or URL Cache and click Write To Disk to write the selected cache's entire memory store to disk.
-
Select the checkbox for the PageCache, Cache Dependencies, Asset Cache, or URL Cache and click Flush Cache to flush the memory and disk stores for the selected caches.
If you have enabled System Page Caching, a button labeled Clear Page Cache will appear underneath the Flush Cache button. Click Clear Page Cache to flush the SystemPageCache table and Co-Res SS Cache.
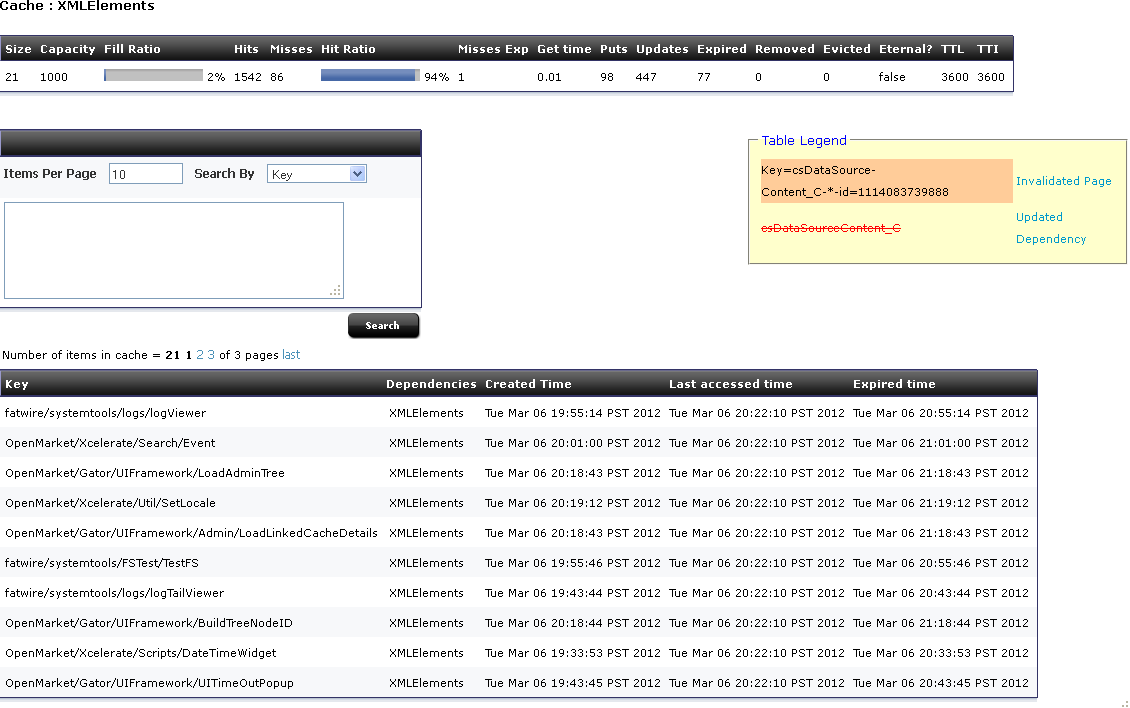
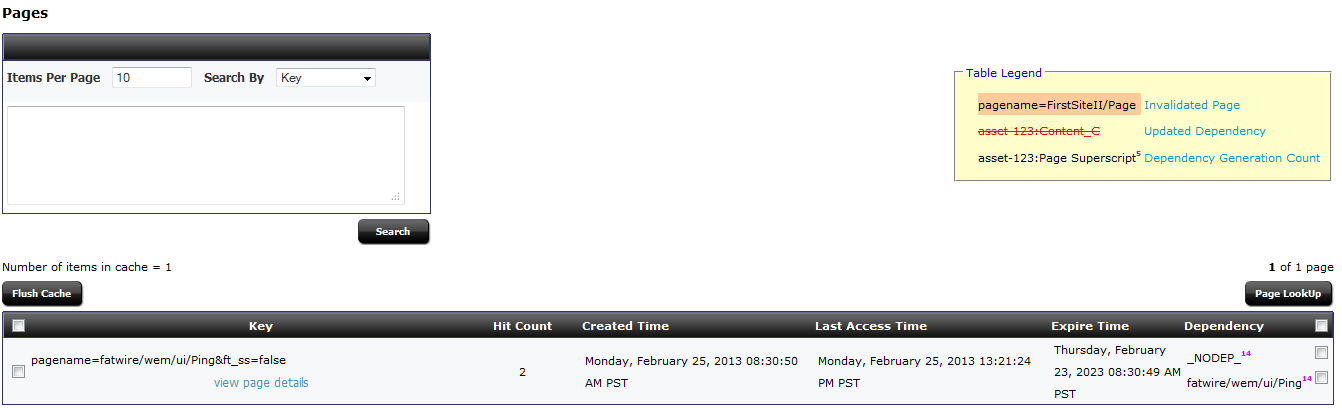
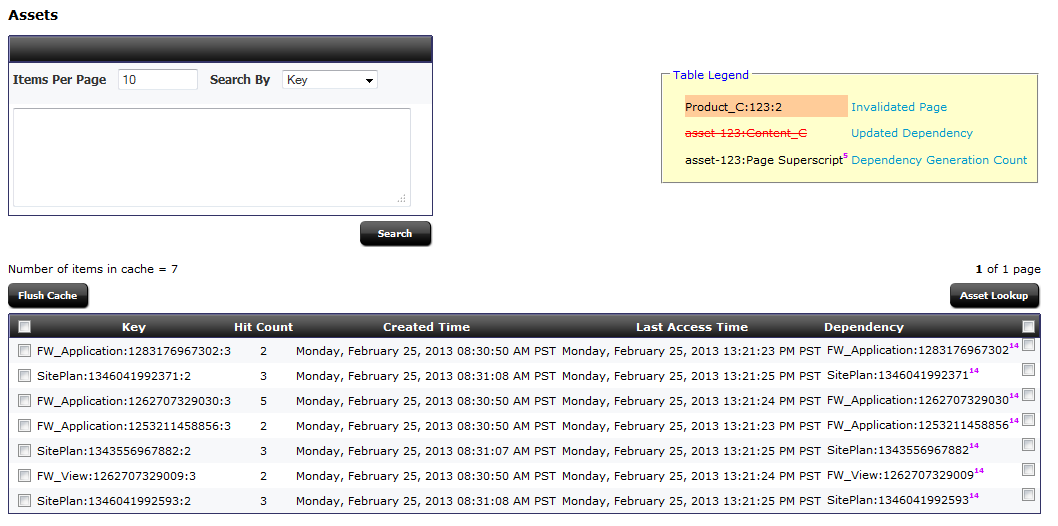
30.6.2 Page Cache
This form lists statistics for each cached page, such as hit count, time of creation/last access/expiration, and dependencies. The table legend identifies which types of information are tracked: invalidated pages, updates to dependencies, and changes to the dependency generation count. The form also provides the following options:
-
Searching the cache for specific pages – Searches are CPU intensive and should be used with caution on a delivery system.
-
Flushing pages from the cache
-
Viewing html information for pages
-
Looking up page dependencies
The view and work with items in the Page Cache
-
On the Admin tab, expand System Tools, then select Cache Management, then expand Sites Cache and double-click Page Cache.
The Pages form displays.
-
At the top of the form is the Search area. Select to search by Key, Expired Time, or by Dependency. If you enter an expired time to search by, use the forms mm/dd/yyyy or mm/dd/yyyy hh:mm:ss to enter a date and time. Click Search.
-
In the displayed items in the cache, click the header title to sort the items by that criteria.
All items are shown when initially loading the Pages form. The Search form limits what is displayed, making it easier to find items in the cache.
-
Underneath each item in the Key column, a view page details link appears. Click view page details to open a new window that displays the page's HTML information.
-
To flush selected assets from the cache, mark the checkbox on the left side of each asset. Mark the checkbox in the header to select all displayed assets. Click Flush Cache to flush the memory and stores of the assets.
-
To view the pages for a specific item within the cache, mark the checkbox on the right side of each item. Mark the checkbox in the header to mark all displayed dependencies. Click Page Lookup to show the pages for the dependency or dependencies.
Note that each item in cache can have multiple checkboxes on the right side, reflecting multiple dependencies.
Note:
After WebCenter Sites is restarted, this form does not show page cache information until the cache engine is initialized. The cache engine is initialized when the first page or asset is requested.30.6.3 Dependency
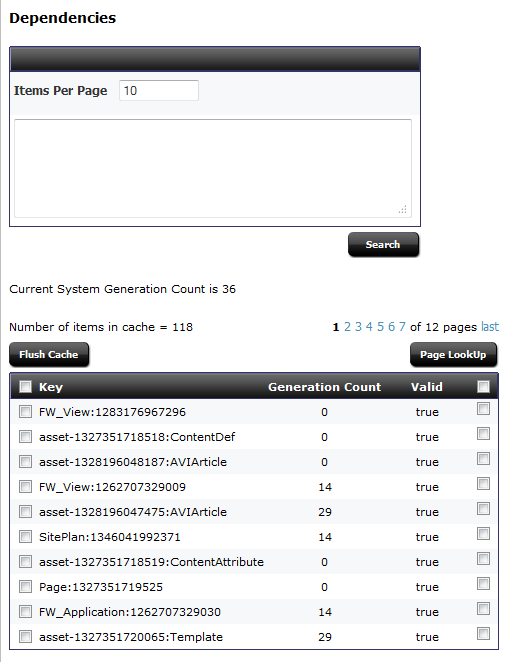
This form lists the contents of the dependency cache and the generation count for each dependency. In addition, it provides the following options:
-
Searching the cache for specific dependencies – Searches are CPU intensive and should be used with caution on a delivery system.
-
Flushing dependencies from the cache
-
Looking up page dependencies
The view and work with items in the Dependency Cache
-
On the Admin tab, expand System Tools, then select Cache Management, then expand Sites Cache and double-click Dependency.
The Dependencies form displays.
-
In the displayed items in the cache, click the header title to sort the items by that criteria.
All items are shown when initially loading the Dependencies form. The Search form limits what is displayed, making it easier to find items in the cache.
-
To flush selected assets from the cache, mark the checkbox on the left side of each asset. Mark the checkbox in the header to select all displayed assets. Click Flush Cache to flush the memory and stores of the assets.
-
To view the pages for a specific item within the cache, mark the checkbox on the right side of each item. Mark the checkbox in the header to mark all displayed dependencies. Click Page Lookup to show the pages for the dependency or dependencies.
Note:
After WebCenter Sites is restarted, this form does not show dependency cache information until the cache engine is initialized. The cache engine is initialized when the first page or asset is requested.30.6.4 Asset Cache
This form lists statistics for each cached asset, such as hit count, time of creation/last access, and dependencies. The table legend identifies which types of information are tracked: invalidated assets, updates to dependencies, and changes to the dependency generation count. The form also provides the following options:
-
Searching the cache for specific assets – Searches are CPU intensive and should be used with caution on a delivery system.
-
Flushing assets from the cache
-
Looking up asset dependencies
The view and work with items in the Asset Cache
-
On the Admin tab, expand System Tools, then select Cache Management, then expand Sites Cache and double-click Asset Cache.
The Asset Cache form displays.
-
At the top of the form is the Search area. Select to search by Key or by Dependency, and to show All or Any assets with the entered search value. Click Search.
-
In the displayed items in the cache, click the header title to sort the items by that criteria.
All assets are shown when initially loading the Assets form. The Search form limits what is displayed, making it easier to find items in the cache.
-
To flush selected assets from the cache, mark the checkbox on the left side of each asset. Mark the checkbox in the header to select all displayed assets. Click Flush Cache to flush the memory and stores of the assets.
-
To view the assets for a specific dependency within the cache, mark the checkbox on the right side of each asset. Mark the checkbox in the header to mark all displayed assets. Click Asset Lookup to show the dependencies.
Note:
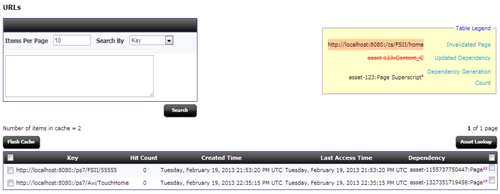
After WebCenter Sites is restarted, this form does not show asset cache information until the cache engine is initialized. The cache engine is initialized when the first page or asset is requested.30.6.5 URL Cache
All the Vanity URLs are cached after the resolution is done in a web page in inCache. The cache can be looked up and managed in the Cache Management node under System Tools.
The view and work with items in the URL Cache
-
On the Admin tab, expand System Tools, then select Cache Management, then expand Sites Cache and double-click URL Cache.
The URLs form displays.
-
The Search area is at the top of the form. Select to search by Key or by Dependency with the entered search value. Click Search.
-
In the displayed items in the cache, click the header title to sort the items by that criteria.
All items are shown when initially loading the URL form. The Search form limits what is displayed, making it easier to find items in the cache.
-
To flush selected URLs from the cache, mark the checkbox on the left side of each URL. Mark the checkbox in the header to select all displayed URLs. Click Flush Cache to flush the memory and stores of the URLs.
-
To view the URL for a specific dependency within the cache, mark the checkbox on the right side of each URL. Mark the checkbox in the header to mark all displayed URLs. Click Asset Lookup to show the dependencies.
30.6.6 Cluster Info
If Sigar is configured, this form lists the name, URL, port, and GUID of each additional WebCenter Sites cluster member.
To view the cluster information, expand System Tools on the Admin tab, then select Cache Management, then expand Sites Cache and double-click Cluster Info.
30.7 Cache Management - Co-Res Cache
Co-Res Cache Cache Management
This section includes the following topics:
30.7.1 Summary
This form lists the following basic data for each cache (values are estimates):
-
Total Count (total number of cached elements)
-
Memory Store Count (number of cached elements in memory)
-
Disk Store Count (number of cached elements on disk)
-
Cache Hits (number of cached elements retrieved from both memory and disk)
-
In Memory Hits (number of cached elements retrieved from memory)
-
On Disk Hits (number of cached elements retrieved from disk)
-
Cache Misses (number of times elements were not found in the cache)
-
Eviction Count (number of elements evicted from the cache)
-
Average Get Time (average number of milliseconds for retrieving an element)
-
Max Elements In Memory (maximum number of elements allowed in memory)
-
Max Elements On Disk (maximum number of elements allowed on disk)
-
Overflow to Disk (whether elements are written to disk when memory is full)
This form also provides the following options. They should be used with caution, especially on a delivery system, as they can impact the performance of your site.
-
Writing a cache's entire memory store to disk – This option can be particularly useful if WebCenter Sites is not set up to automatically write a cache's memory store to disk before shutting down.
-
Flushing a cache's entire memory and disk stores
Note:
If legacy page caching is enabled, cached page data is stored in theSystemPageCache table and information about the stored data is not displayed in the Summary window.To view and work with summary cache information
-
On the Admin tab, expand System Tools, then select Cache Management, then expand Co-Res SS Cache and double-click Summary.
The Summary page displays.
-
Select the checkbox for the PageCache, Cache Dependencies, or URL Cache and click Write To Disk to write the selected cache's entire memory store to disk.
-
Select the checkbox for the PageCache, Cache Dependencies, or URL Cache and click Flush Cache to flush the memory and disk stores for the selected caches.
30.7.2 Page Cache
This form lists statistics for each cached page, such as hit count, time of creation/last access/expiration, and dependencies. The table legend identifies which types of information are tracked: invalidated pages, updates to dependencies, and changes to the dependency generation count. The form also provides the following options:
-
Searching the cache for specific pages – Searches are CPU intensive and should be used with caution on a delivery system.
-
Flushing pages from the cache
-
Viewing html information for pages
-
Looking up page dependencies
The view and work with items in the Page Cache
-
On the Admin tab, expand System Tools, then select Cache Management, then expand Co-Res SS Cache and double-click Page Cache.
The Pages form displays.
-
At the top of the form is the Search area. Select to search by Key, Expired Time, or by Dependency. If you enter an expired time to search by, use the forms mm/dd/yyyy or mm/dd/yyyy hh:mm:ss to enter a date and time. Click Search.
-
In the displayed items in the cache, click the header title to sort the items by that criteria.
All items are shown when initially loading the Pages form. The Search form limits what is displayed, making it easier to find items in the cache.
-
Underneath each item in the Key column, a view page details link appears. Click view page details to open a new window that displays the page's HTML information.
-
To flush selected assets from the cache, mark the checkbox on the left side of each asset. Mark the checkbox in the header to select all displayed assets. Click Flush Cache to flush the memory and stores of the assets.
-
To view the pages for a specific item within the cache, mark the checkbox on the right side of each item. Mark the checkbox in the header to mark all displayed dependencies. Click Page Lookup to show the pages for the dependency or dependencies.
Note that each item in cache can have multiple checkboxes on the right side, reflecting multiple dependencies.
Note:
After WebCenter Sites is restarted, this form does not show page cache information until the cache engine is initialized. The cache engine is initialized when the first page or asset is requested.30.7.3 Dependency
This form lists the contents of the dependency cache and the generation count for each dependency. In addition, it provides the following options:
-
Searching the cache for specific dependencies – Searches are CPU intensive and should be used with caution on a delivery system.
-
Flushing dependencies from the cache
-
Looking up page dependencies
The view and work with items in the Dependency Cache
-
On the Admin tab, expand System Tools, then select Cache Management, then expand Co-Res SS Cache and double-click Dependency.
The Dependencies form displays.
Figure 30-28 Co-Res SS Cache Dependencies
Description of ''Figure 30-28 Co-Res SS Cache Dependencies''
-
In the displayed items in the cache, click the header title to sort the items by that criteria.
All items are shown when initially loading the Dependencies form. The Search form limits what is displayed, making it easier to find items in the cache.
-
To flush selected assets from the cache, mark the checkbox on the left side of each asset. Mark the checkbox in the header to select all displayed assets. Click Flush Cache to flush the memory and stores of the assets.
-
To view the pages for a specific item within the cache, mark the checkbox on the right side of each item. Mark the checkbox in the header to mark all displayed dependencies. Click Page Lookup to show the pages for the dependency or dependencies.
Note:
After WebCenter Sites is restarted, this form does not show dependency cache information until the cache engine is initialized. The cache engine is initialized when the first page or asset is requested.30.7.4 URL Cache
All the Vanity URLs are cached after the resolution is done in a web page in inCache. The cache can be looked up and managed in the Cache Management node under System Tools.
The view and work with items in the URL Cache
-
On the Admin tab, expand System Tools, then select Cache Management, then expand Co-Res SS Cache and double-click URL Cache.
The URLs form displays.
-
At the top of the form is the Search area. Select to search by Key or by Dependency with the entered search value. Click Search.
-
In the displayed items in the cache, click the header title to sort the items by that criteria.
All items are shown when initially loading the URLs form. The Search form limits what is displayed, making it easier to find items in the cache.
-
To flush selected URLs from the cache, mark the checkbox on the left side of each URL. Mark the checkbox in the header to select all displayed URLs. Click Flush Cache to flush the memory and stores of the URLs.
-
To view the URLs for a specific dependency within the cache, mark the checkbox on the right side of each URL. Mark the checkbox in the header to mark all displayed URLs. Click Asset Lookup to show the dependencies.
30.7.5 Cluster Info
If Sigar is configured, this form lists the name, URL, port, and GUID of each additional WebCenter Sites cluster member.
To view the cluster information, expand System Tools on the Admin tab, then select Cache Management, then expand Co-Res SS Cache and double-click Cluster Info.
30.8 Log Viewer
The Log Viewer tool enables you to view, tail, download, and search the contents of the WebCenter Sites log specified in the log4j.properties file directly from the WebCenter Sites administrator's interface. Since the total size of the log affects the tool's performance, if the log size exceeds 100 megabytes, you are informed and given the choice to proceed or cancel.
This section contains the following topics:
-
Section 30.8.4, "Searching the Log"
Note:
The Log Viewer tool is available only if WebCenter Sites is set up to use the Apache log4j logging system and thelog4j.propertiesfile includes the file appenderFWDefaultAppender. For information about setting up log4j, see Section 30.1.1, "Setting Up Apache log4j."
30.8.1 Viewing the Log
You can browse the entire contents of the WebCenter Sites log, starting with statements written most recently or written at a specific time.
To view the contents of the log
-
On the Admin tab, expand System Tools and double-click Log Viewer.
The Log Viewer form shows the most recent 100 lines in the log.
-
To jump to statements written at a specific time, do the following:
-
Click the calendar icon and select a date and time, or enter the date and time manually in the "yyyy-mm-dd hh:mm:ss" format.
Note:
This feature takes into consideration only log statements that were written with the timestamping pattern currently specified in the log4j.properties file. -
Click View Logs.
The Log Viewer form shows the statements written at and/or after the specified date and time.
-
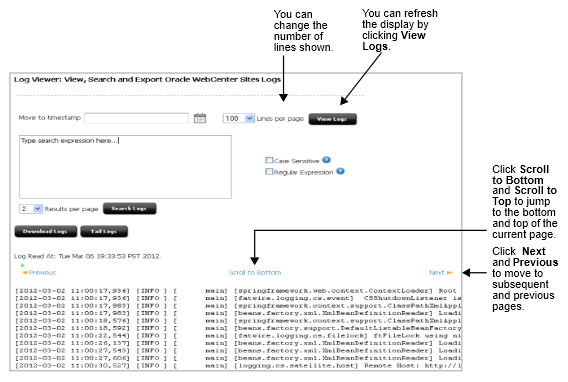
30.8.2 Tailing the Log
You can tail the WebCenter Sites log in a separate window. This option is particularly useful when you want to keep track of the statements written to the log while executing an action that causes an exception.
To tail the contents of the log
-
On the Admin tab, expand System Tools and double-click Log Viewer.
-
Click Tail Logs.
The most recent 100 lines in the log are displayed in a new window and are refreshed every five seconds.
30.8.3 Downloading the Log
You can download a compressed file containing the entire contents of the WebCenter Sites log.
To download the contents of the log
-
On the Admin tab, expand System Tools and double-click Log Viewer.
-
Click Download Logs.
-
Open or save the compressed file containing the WebCenter Sites log. If the log is spread over several files, each file is included.
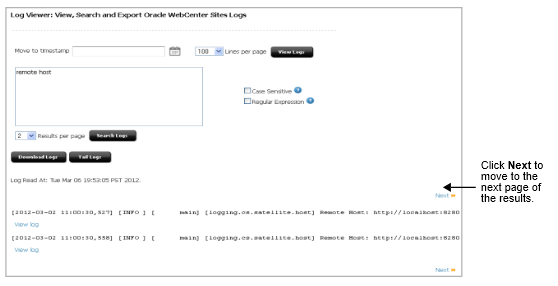
30.8.4 Searching the Log
You can search the contents of the WebCenter Sites log for specific information.
To search the contents of the log
-
On the Admin tab, expand System Tools and double-click Log Viewer.
The Log Viewer form shows the most recent 100 lines in the log.
-
If you want to enable case-sensitive matching, select the Case Sensitive check box. By default, case-sensitivity covers only US-ASCII characters. If you want case-sensitivity to apply to Unicode characters, select the Unicode Case check box as well. The Unicode Case check box appears once the Case Sensitive check box is selected.
-
If you want the search to allow the usage of Java regular expressions, select the Regular Expression check box. Once the Regular Expression check box is selected, the Dot All and Multi Line check boxes appear. Use these to refine the regular expression settings:
-
If you want a dot (
.) to match any characters and line terminators, select the Dot All check box. If this check box is not selected, a dot matches only characters. -
If you want a caret (
^) to match the beginning of a line and a dollar sign ($) to match the end of a line, select the Multi Line check box.Note:
If you search with regular expressions, a single search result is restricted to a maximum of 40 lines of the log.
-
-
In the search field, enter the expression that you want to find in the log.
-
In the Results per page field, select the number of results that you want to list on each page.
-
Click Search Logs.
The Log Viewer form shows the lines in the log that match your search.
Figure 30-33 Log Viewer Form, After Search
Description of ''Figure 30-33 Log Viewer Form, After Search''
-
To view a search result in its larger context, click View log below the result line.
100 lines of the log, starting with the line matching the search, are displayed in a new window.
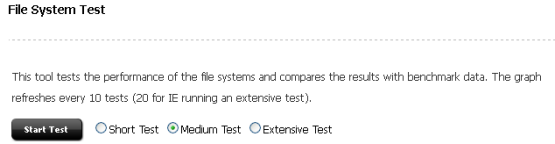
30.9 File System Test
The File System Test tool enables you to test the local application server directory and the central directories in the shared file system (<cs_install_dir>/Shared) in order to compare their performance with provided benchmarks.
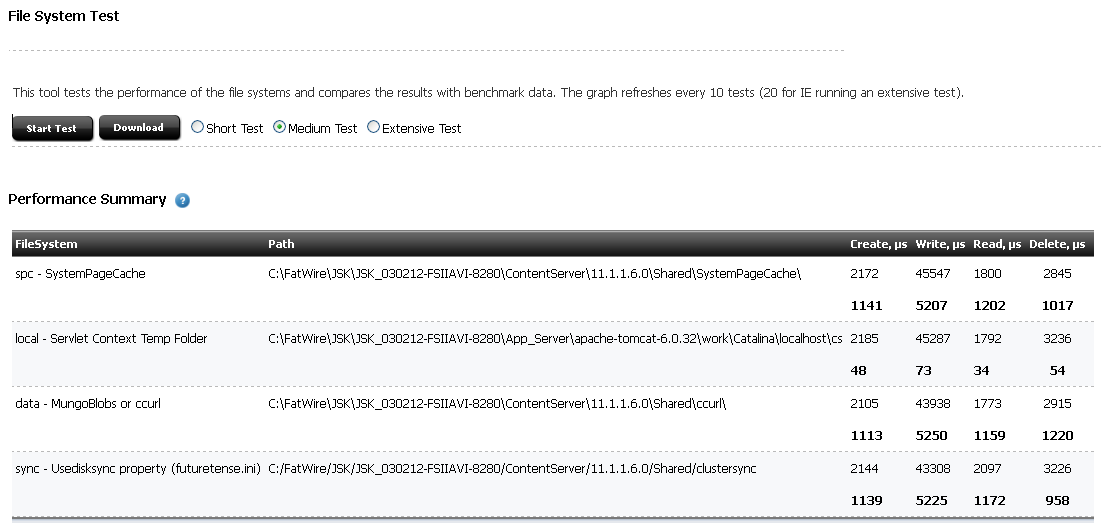
Table 30-3 Tested File Systems
| FileSystem | Description |
|---|---|
|
spc |
Shared page cache directory for all WebCenter Sites cluster members. Sample path:
|
|
local |
Temporary directory for servlet context information. Sample path:
|
|
data |
Shared blob data directory for all WebCenter Sites cluster members. Sample path:
|
|
sync |
Shared synchronization directory for all WebCenter Sites cluster members. Sample path:
|
A test suite is composed of a number of unique tests which are performed on the local application server directory and the shared file system directories. Each of these tests executes multiple threads. Each thread creates an empty file and then writes to, reads, and deletes the file. The following test suites are available:
-
Short Test – runs a total of 16 tests (4 tests are performed on each of the directories listed in Table 30-3).
-
Medium Test – runs a total of 64 tests (16 tests are performed on each of the directories listed in Table 30-3).
-
Extensive Test – runs a total of 384 tests (96 tests are performed on each of the directories listed in Table 30-3).
-
On the Admin tab, expand System Tools and double-click File System Test.
-
In the File System Test form, select the type of test you want to perform and click Start Test.
The test is executed on the directories named in the Performance Summary table shown in step 3. You can follow the results of the file system test as it progresses.
Note:
If the test takes too long or affects performance more than is acceptable, you can click Stop Test. The results of a file system test can be compared with the provided benchmark only when the test is completed. -
Once the test is complete, review the overall results in the Performance Summary table.
The following information is shown for each directory:
-
Numbers displayed in bold are benchmarks. The benchmarks were calculated by running standard tests on an Oracle Secure Linux 5.4 system connected to a 10K RPM SAS300 HD via NFS version 4. Both the client and server were on the same network switch and there was no additional traffic at the time of the test.
-
FileSystem specifies the directory on which the test was performed.
-
Path specifies the path to the directory on which a file system test was performed.
-
Create specifies the average number of microseconds in which a create operation was performed.
-
Write specifies the average number of microseconds in which a write operation was performed.
-
Read specifies the average number of microseconds in which a read operation was performed.
-
Delete specifies the average number of microseconds in which a delete operation was performed.
-
-
For detailed information about each test, review the graph (located under the Performance Summary table) and the test results table (located under the graph).
-
To view the results of a single test, either hover over a point on the graph or navigate to the desired row in the test results table.
Figure 30-36 Test Results Graph and Table
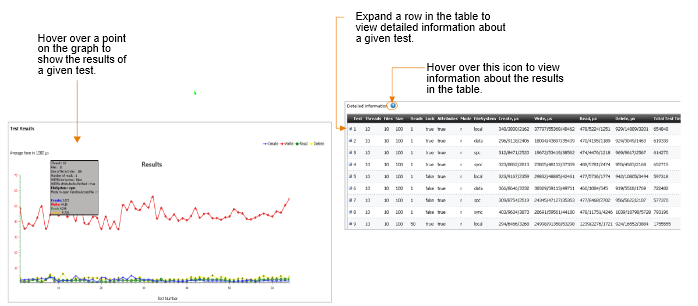
Description of ''Figure 30-36 Test Results Graph and Table''
Note:
Each point on the graph and row in the table shows information about a single test. However, to view the details of a single test when you hover over a point in the graph, you must be using a browser other than Internet Explorer.The following information is shown in the table for each test:
-
Test specifies a serial number for each test.
-
Threads specifies the number of threads created during the test.
-
Files specifies the number of files created per thread.
-
Size specifies the number of bytes per file.
-
Reads specifies the number of times each file was read by a test.
-
Lock specifies whether each file was locked (random access lock operation).
-
Attributes specifies whether each file's attributes were read during the test.
-
Mode specifies the Java I/O random access mode for accessing the files in the thread.
-
FileSystem specifies the directory on which the test was performed.
-
Create specifies the minimum, maximum, and average number of microseconds in which the test performed a create operation.
-
Write specifies the minimum, maximum, and average number of microseconds in which the test performed a write operation.
-
Read specifies the minimum, maximum, and average number of microseconds in which the test performed a read operation.
-
Delete specifies the minimum, maximum, and average number of microseconds in which the test performed a delete operation.
-
Total Test Time specifies the total number of microseconds in which a test was completed.
-
-
In the test results table, expand a row to view detailed information about each thread that was created during a specific test.
The following information is shown in the thread detail table:
-
Thread specifies a serial number for each thread.
-
Create specifies the total number of microseconds in which the thread created an empty file.
-
Write specifies the total number of microseconds in which the thread finished writing to the file.
-
Read specifies the total number of microseconds in which the thread read the file it created.
-
Delete specifies the total number of microseconds in which the thread deleted the file.
-
-
-
To download the test results as a spreadsheet, go to the top of the File System Test form and click Download.
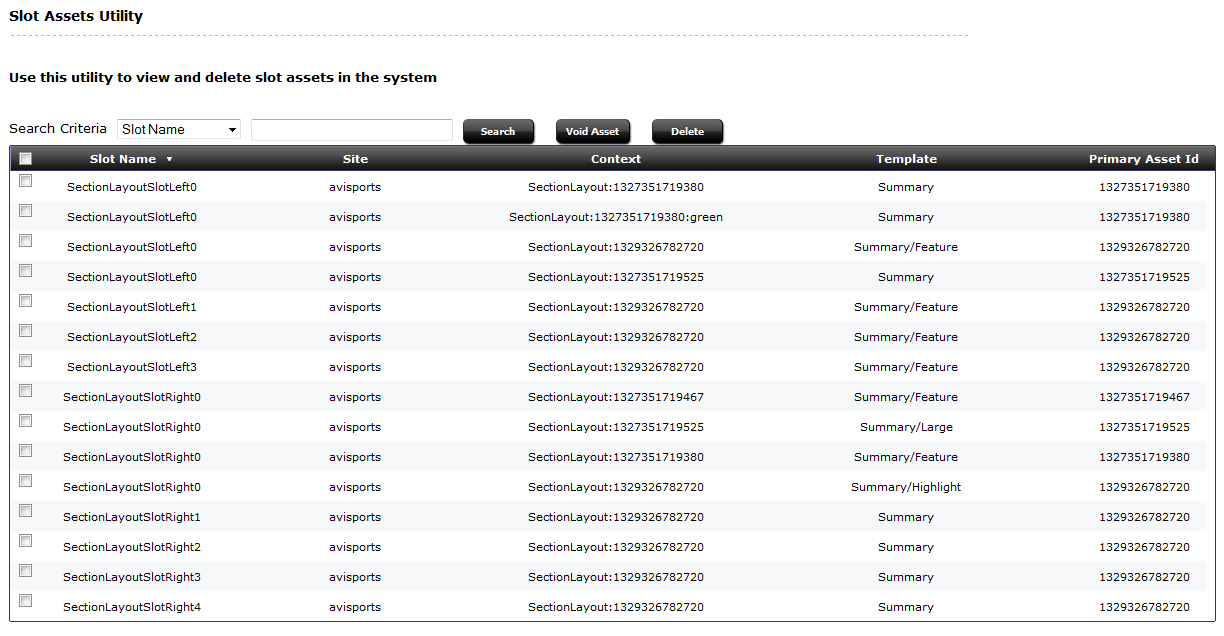
30.10 Slots
Slots assets are used to store presentation changes made when editing a web site in context. Slots assets are managed in a transparent way, that is, they are not available in the user interfaces. The Slots node in the System Tools is the location to void or delete existing slot data.
A deleted slot asset has its rows removed from the database table. A voided slot asset is an asset that has had its status changed to VO. It is not removed from the database, however, it will also not show up in any searches and similar inquiries. Voided assets can be physically removed in a purge. For more information on purging voided assets, see Section 30.12, "Purge Voided Assets."
To Void Assets or Delete Assets
-
On the Admin tab, expand the System Tools node. Double-click the Slots node.
The Site Assets Utility form is displayed.
-
The Site Assets Utility form displays the slot assets. Click one of the table headings to re-organize based on that criteria (that is, by Slot Name, by Site, by Context, by Template, or by Primary Asset Id). Alternately, you can search by selecting one of those criteria as a search parameter and entering a value to search.
-
Select one or more assets by marking the checkboxes.
-
Click Void Asset to void the selected assets (for a later purge), or click Delete to delete the assets.
Note:
When either deleting or voiding the slot assets, no confirmation message is displayed. The list of remaining assets will redisplay.
Once an asset is voided, it doesn't appear in any lists of assets or searches for assets. However, it is still taking space in the database. In some cases, the space taken up by voided assets must be reclaimed; this is handled through purging voided assets. For information on how to purge voided assets, see Section 30.12, "Purge Voided Assets."
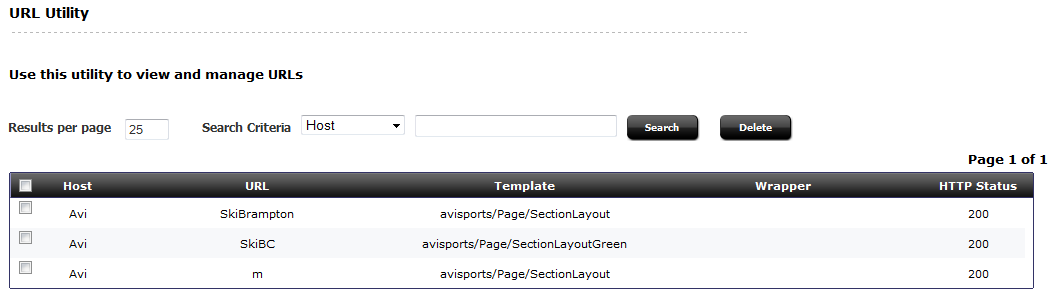
30.11 URL
The URL node allows you to search, view, and delete custom URLs, also known as vanity URLs. These URLs are domains used to redirect to a certain section of your website, which may or may not be accessible to the rest of the hosted website. Often these vanity URLs are used to prevent a long URL that has coded strings within it, making it easier for the web user to view your page.
To view and manage vanity URLs
-
On the Admin tab, expand System Tools and double-click URL.
The URL Utility form will display, showing all vanity URLs including auto-generated URLs.
-
You can limit the list by entering the search criteria for Host, URL, Template, Wrapper, or HTTP Status, then click Search.
-
The displayed vanity URLs can be sorted by clicking the column headers - Host, URL, Template, Wrapper, and HTTP Status.
-
To delete a vanity URL, mark the checkbox and click Delete.
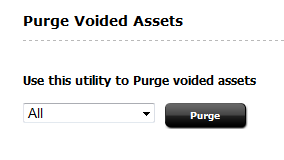
30.12 Purge Voided Assets
The Purge Voided Assets node allows you to remove those assets which have been marked void. You can choose between purging all voided assets or purging those voided assets of a specific asset type.
-
Expand the System Tools node, then double-click Purge Voided Assets.
The Purge Voided Assets page opens.
-
In the Purge Voided Assets page, select the asset type, or all asset types, to purge the voided assets.
-
Click Purge.
If assets were purged, a confirmation message will display:
Purgednassets of typeasset typeIf no assets were purged, a message will display:
No voided Assets of typeasset typefoundIf All was selected, then a message will display for each type, stating if assets were purged or if no assets were available to purge for that type.