2 Configuring Oracle WebCenter Sites: Analytics
Analytics operating conditions can be configured in several files. This chapter discusses configuring the sensor overload threshold in particular, and lists various configuration files where other types of parameters can be set.
This chapter contains the following sections:
2.1 Sensor Overload Alerts
During heavy site traffic, the Analytics Sensor can become overloaded with incoming data and stop responding normally. The Analytics Sensor will stop writing to the file system and will instead store incoming data in memory, until an out-of-memory condition is reached.
The Analytics Administrator interface (Figure 2-1) alerts you to an overload condition by displaying the Analytics Sensor button in either yellow or red. Yellow indicates a WARNING condition. Red indicates a CRITICAL condition (assuming the sensor is running).
Note:
A stopped or non-functional Analytics Sensor is also displayed in red.
This section contains the following topics:
2.1.1 Setting an 'Overload Alert' Threshold
Properties in global.xml determine the threshold that triggers a WARNING or CRITICAL condition. The properties are sensor.requestqueue.warnsize and sensor.requestqueue.maxsize. Set these properties to a threshold that is compatible with the configuration of your Analytics installation and the volume of site traffic. For more information about these properties, see the Oracle Fusion MIddleware WebCenter Sites Installation Guide.
2.1.2 Responding to a Red Condition
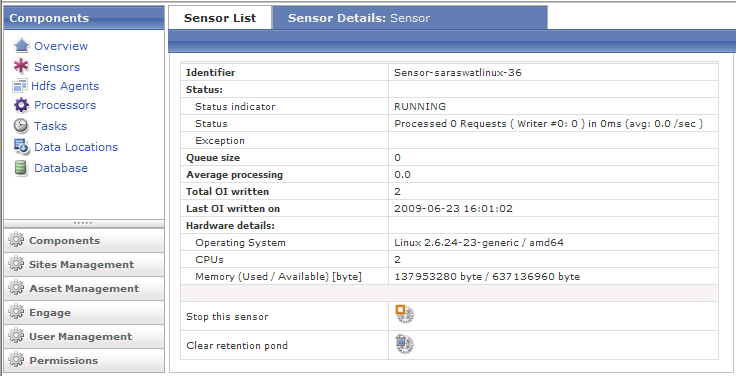
If you are monitoring the Status Summary panel (in the Administration interface, Figure 2-1) and you notice that the Analytics Sensor button is displayed in red, you need to determine whether the Sensor has stopped, has failed, or is overloaded. In case of overload, you will need to clear the memory in order to reset the system and resume normal functioning.
Note:
Data cleared from memory cannot be retrieved and will be lost.
Figure 2-1 Analytics Administrator Interface, Status Summary Panel

Description of "Figure 2-1 Analytics Administrator Interface, Status Summary Panel"
Click the Analytics Sensor button and note the main panel.
-
If you see
"No data available", the Analytics Sensor has either stopped or failed. -
If you see the Sensor Details panel, the Analytics Sensor is running, but it is overloaded. Click the icon labeled Clear retention pond to clear the memory.
2.2 Configuration Files
Analytics operating conditions are defined in the following files:
-
global.xml, an Analytics file that defines installation directories, the handling of raw data, data processing conditions, and system administrators' contact information. -
log4j.properties, which defines logging for the Hadoop Job scheduler -
futuretense_xcel.ini, a WebCenter Sites property file that contains Analytics properties defining, for example, URLs of the Analytics servlet and generated reports.
For more information about the configuration files, see the Oracle Fusion MIddleware WebCenter Sites Installation Guide.