4 Content Information Reports
"Content Information" reports display usage statistics on published assets. The "Content Information" reports are:
4.1 'Internal Searches' Report
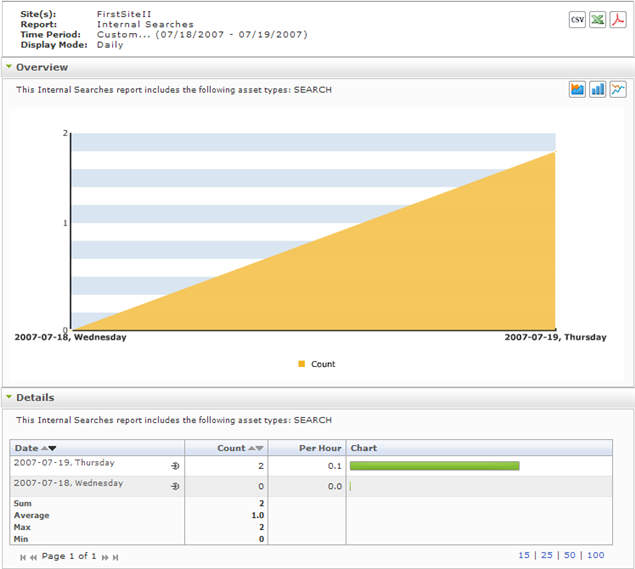
The internal searches report displays statistics on the search words and phrases that visitors entered into the site's native search function during the reported time range. This report can be generated in six display modes: daily, weekly, monthly, sum by hours, sum by weekdays, and asset mode.
Note:
If you do not see an internal searches report listed in the Content Information report group, keep in mind that this report is optional and is only made available to users if the Analytics administrator configures the report.
Also note that the internal searches report is named at your Analytics administrator's discretion. Therefore, the display name of an internal searches report will not necessarily be "Internal Searches."
If you do not know what name the internal searches report was given, or if you do not see an internal searches report listed in the "Content Information" report group, then contact your Analytics administrator.
4.1.1 'Overview' Chart
The "Overview" chart plots the number of times that queries were entered into the site's native search function versus the date (or time interval) when the number was observed.
4.1.2 'Details' List
The "Details" list tabulates statistics on queries in the site's native search function. For a description of each statistic, see Table 4-1.
| Mode | Column Title: Description |
|---|---|
|
Daily, Weekly, Monthly |
Date column: The x-axis of the "Overview" chart in this mode. Displays the day (week or month) on which the internal search was performed.
Clicking the Drill down icon opens the report in "Assets" mode (see the "Assets" row of this table). Count column: The y-axis of the "Overview" chart in this mode. Displays the number of times that internal searches were performed on the given date. Per Hours column: Average number of times that internal searches were performed per hour on the given site, on the given date. Chart column: Horizontal bar whose length expresses the value in the "Count" column (or the value in the "Per Hour" column), for the given date. When two or more line items are displayed, the bars in the "Chart" column define a histogram (Count [or Per Hour] vs. Date). |
|
Sum by Hours |
Hour column: The x-axis of the "Overview" chart in this mode. Represents the hour in which internal searches were performed. "00 hours" is defined as 12:00 a.m. Count column: The y-axis of the "Overview" chart in this mode. Displays the average number of internal searches that were performed during the given hour. The average is computed over the reported time range. |
|
Sum by Weekdays |
Weekday column: The x-axis of the "Overview" chart in this mode. Displays the day of the week (Monday, Tuesday, etc.) on which internal searches on this site were performed. Count column: The y-axis of the "Overview" chart in this mode. Displays the average number of times that internal searches were performed on the given weekday, during the reported time range. Per Hour column: Average number of internal searches that were performed hour on the given site, on the given weekday. The average is computed over the reported time range. Chart column: Horizontal bar whose length expresses the value in the "Count" column (or the value in the "Per Hour" column), for the given date.When two or more line items are displayed, the bars in the "Chart" column define a histogram (Count [or Per Hour] vs. Weekday). |
|
Search Keyword column: Search word or phrase that was entered during the reported time range (specified in the report header). Count column: Number of times that the query was entered during the reported time range. Asset Type column: Asset types tracked by the report. The only value displayed in this column is Min. Results column: The smallest number of results that were returned for the given query in the reported time range. (The number of results varies as the content of the site is changed.) Max Results column: The greatest number of results that were returned for the given query in the reported time range. (The number of results varies as the content of the site is changed.) |
4.2 'Page Views' Report
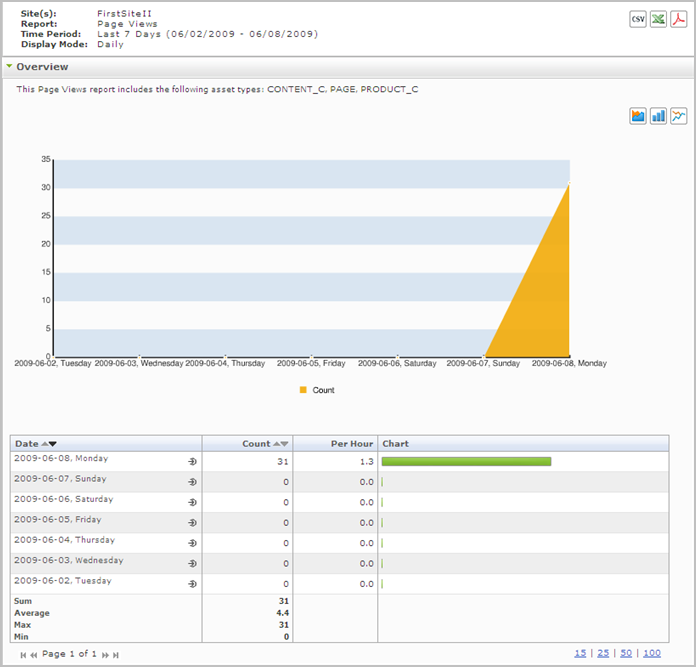
The "Page Views" report displays usage statistics on a site's page view and the assets it specifies. This report can be generated in six display modes: daily, weekly, monthly, sum by hours, sum by weekdays, and asset mode.
Note:
The "Page Views" report returns statistics on the Pageview object. The object is defined by the WebCenter Sites administrator. A Pageview object can be either a single asset type or multiple asset types on a given content management site. The "Page Views" report is generated for assets of those types. For more information about the Pageview object, see your Analytics administrator. (A definition for the Pageview object is available in the Glossary.)
4.2.1 'Overview' Chart
The "Overview" chart plots the number of times a site's page view was accessed versus the date (or time interval) when the number was observed.
4.2.2 'Overview' Details List
The "Overview" details list tabulates statistics on the usage of a site's page view during the reported time period. For a description of each statistic, see Table 4-2.
Table 4-2 "Overview" Details List
| Mode | Column Title: Description |
|---|---|
|
Daily, Weekly, Monthly |
Date column: The x-axis of the "Page Views" chart in this mode. Displays the day (week or month) for which page view statistics are being reported.
Clicking the Drill down icon opens the report in "Assets" mode. The report identifies which assets in the site's page view were visited on the given date. In the "Assets" mode, clicking the clickstream icon in an asset's "Clickstream" column opens the Clickstream report with the selected asset as the starting point. For more information, see Section 3.1, "'Clickstream' Report." Count column: The y-axis of the "Page Views" chart in this mode. Displays the number of times that the site's page view was accessed on the given date. Per Hour column: Average number of times that the site's page view was accessed per hour on the given site, on the given date. Chart column: Horizontal bar whose length expresses the value in the "Count" column (or the value in the "Per Hour" column), for the given date. When two or more line items are displayed, the bars in the "Chart" column define a histogram (Count [or Per Hour] vs. Date). |
|
Sum by Hours |
Hour column: The x-axis of the "Page Views" chart in this mode. Displays the hour in which the site's page view was accessed. "00 hours" is defined as 12:00 a.m. Count column: The y-axis of the "Page Views" chart in this mode. Displays the average number of times that the site's page view was accessed during the given hour. The average is computed over the reported time period. |
|
Sum by Weekdays |
Weekday column: The x-axis of the "Page Views" chart in this mode. Displays the day of the week (Monday, Tuesday, etc.) on which the site's page view was accessed. Count column: The y-axis of the "Page Views" chart in this mode. Displays the average number of times that the site's page view was accessed on the given weekday during the reported time period. Per Hour column: Average number of times that the site's page view was accessed per hour on the given site, on the given weekday. The average is computed over the reported time period. Chart column: Horizontal bar whose length expresses the value in the "Count" column (or the value in the "Per Hour" column), for the given date. When two or more line items are displayed, the bars in the "Chart" column define a histogram (Count [or Per Hour] vs. Date). |
|
Assets |
Asset Name column: Name of the asset that was accessed during the reported time period. Note: Mousing over the asset name displays the Object ID. Objectdetail column: Provides detailed information about a specific asset, along with its page view information, when the Drill down icon (shown below) is clicked for that asset. Asset Type column: Type of asset that was accessed during the reported time period. Count column: Number of times that the asset was accessed during the reported time period (displayed in the report header). Clickstream column: View the page views for a specific asset in Clickstream mode when you click the Clickstream icon (shown below). |

