3 General Information Reports
"General Information" reports display the latest full day's traffic statistics, along with historical traffic statistics for a given site.
"General Information" reports are described in this chapter. They are:
3.1 'Clickstream' Report
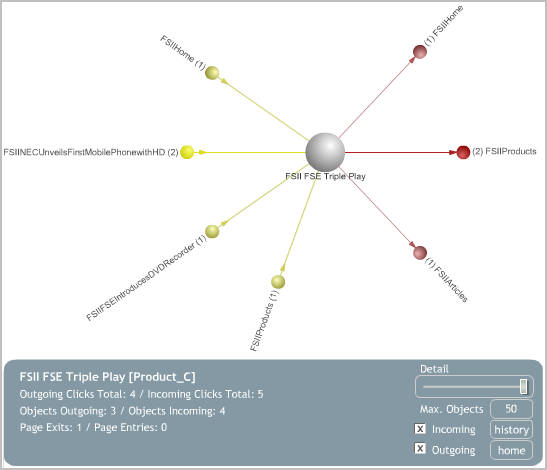
Analytics collects and analyzes data describing which pages visitors visit and in what order. The clicks each visitor makes to move from one page to the next form a clickstream – the path that the user takes through the site to arrive at a page. The "Clickstream" report depicts this path for each page on your site that has been enabled for data capture (through the Pageview object) in an interactive map. You navigate the map to obtain clickstream data for different pages on your site. An example of the "Clickstream" report is shown below:
When you access this report, a node representing the page on your site with the highest number of visits registered by Analytics is displayed in the center of the map – in most cases, this would be your site's home page.
The pages which users can access from the home page (through outgoing clicks), and pages from which users can access the home page (through incoming clicks) are depicted as stem nodes connecting to the center node (the home page). (See Table 3-1 for information on how to choose which data will be shown in the map).
The number next to each stem node indicates how many clicks have been registered for this page (in other words, how many times the page has been accessed by a visitor following a link on the home page.)
Clicking a stem node places it in the center of the map, and the display is updated to reflect the way the pages are linked to one another. If there is no link leading back to the home page, no number is displayed next to the home page node (which has become a stem node).
When interacting with the report map, the following functions are available:
Table 3-1 "Clickstream" Map Display Options
| Function | Description |
|---|---|
|
Incoming check box |
Shows or hides pages from which incoming clicks to the currently selected page originated. (An incoming click is registered when a user follows a link leading to the target page from another page.) |
|
Outgoing check box |
Shows or hides pages to which outgoing click data originated from the currently selected page. (An outgoing click is registered when a user follows a link leading from the target page to another page.) |
|
Detail slider |
Adjusts the level of detail shown in the clickstream map. The level of detail is the minimum number of recorded clicks required for a page to appear in the map for the selected mode (incoming or outgoing). The higher the level of detail, the less recorded clicks are required for a page to appear in the map. |
|
Max. Objects button |
Set the maximum number of pages to display in the clickstream map. Do not set this too high, or the map will become too crowded to be readable. The default value is 50. |
|
History button |
Shows a history of the pages you have selected in the map. |
|
Home button |
Resets the map to display your site's home page as the center node. |
In addition to the graphical depiction of the clickstream, the report displays the following information:
Table 3-2 Fields displayed in the "Clickstream" report
| Field | Description |
|---|---|
|
Page Name |
The name of the page currently selected as the center node of the clickstream map. |
|
Incoming Clicks Total |
Total number of incoming clicks recorded for all pages displayed in the map. |
|
Outgoing Clicks Total |
Total number of outgoing clicks recorded for all pages displayed in the map. |
|
Objects Incoming |
Number of links that lead from other pages to the currently selected (center node) page. |
|
Objects Outgoing |
Number of links that lead from the currently selected (center node) page to other pages. |
|
Page Entries |
Number of times visitors have entered the currently selected (center node) page (in other words, how many incoming clicks have been recorded for that page). |
|
Page Exits |
Number of times visitors have left the currently selected (center node) page (that is, how many outgoing clicks have been recorded for that page). |
3.2 'Overview' Report
The "Overview" report analyzes visits to a site's page view during the reported time period.
3.2.1 'Page Views Summary by Site' List
The "Page Views Summary by Site" list displays usage statistics on the site's page view during the weeks or months in the reported time period. For a description of each statistic, see Table 3-3.
Table 3-3 "Page Views Summary by Site" List
| Row Title | Description |
|---|---|
|
Site Name |
Name of the content management site for which the report was generated. Clicking the site name opens the online site. |
|
Country |
Country from which the site's page view was accessed during the reported time period (displayed in the report header). |
|
Page Views (PV) within Time Period |
Total number of times the site's page view was accessed by visitors in the given country during the reported time period (displayed in the report header). |
|
PV/ MIO |
Number of times the site's page view was accessed by one million of the country's population. "PV" is the "Page Views within Time Period" statistic (described in the preceding row). "MIO" is the population of the given country in millions of inhabitants. |
|
PV Total |
Total number of times that the site's page view was accessed by visitors in the given country since the time data capture began. |
3.3 'Site Information' Report
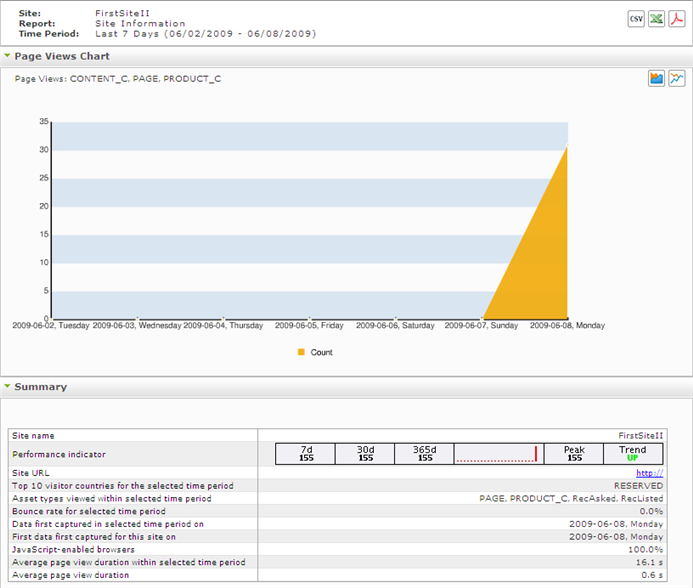
The "Site Information" report analyzes visitors' activity on a given site during the time intervals specified in the report.
3.3.1 'Page Views Chart'
The "Page Views Chart" plots the number of times that the site's page view was accessed versus the date on which the number was observed. (If the reported time period is one month or less, the x-axis reports each day in the time period.)
3.3.2 'Summary' List
The "Summary" list tabulates statistics on the usage of the site's page view and Engage assets in the reported time period and for system-defined time intervals. For a description of each statistic, see Table 3-4.
| Row | Description |
|---|---|
|
Site name |
The name of the content management site for which the report was generated. |
|
Performance indicator |
A set of panels containing page view statistics for system-defined time intervals:
|
|
Site URL |
URL of the online site. (The back end of this site is identified by the "Site name" entry.) |
|
Top 10 visitor countries for the selected time period |
Top 10 countries from which site visitors issued requests during the reported time period (displayed in the report header). A value of |
|
Asset types viewed within the selected time period |
Types of WebCenter Sites and Engage assets on which data was captured within the reported time period. |
|
Bounce rate for selected time period |
Percentage of sessions that registered only a single request on the given site during the reported time period. |
|
Data first captured in selected time period on |
The date on which the first data point in the reported time period was captured. |
|
First data first captured for this site on |
The date on which data capture for this site has begun. |
|
Javascript-enabled browsers |
Percentage of all visits to the site that were made using Web browsers that support JavaScript. |
|
Average page view duration within selected time period |
The average duration of a page view on this site, calculated for the reported time period. |
|
Average page view duration |
The average duration of a page view on this site, calculated from the time data capture for this site has begun until the present. |


