4 Using the VTCS Dashboard
”Using the VTCS Dashboard” is basically about reviewing your MVC and VTC reports. The main pieces and parts of your virtual tape configuration are VTSSs, VTDs, VTVs, RTDs, and MVCs, and so it is not surprising that a lot of your daily and weekly routine is making sure they are all operating normally.
Checking Virtual Tape Status (Daily)
Think of a VTSS as the virtual counterpart of a Nearline ACS, a VTD as the virtual counterpart of a Nearline real tape drive, and a VTV as the virtual counterpart of a Nearline volume, and it is easy to see why it is important to make sure all your VTSSs, VTDs, and VTVs are operating normally.
To check Virtual Tape status:
-
Enter a Display VTSS command.
You should see something like Table 4-1.
Table 4-1 Example output from Display VTSS - Good VTSS status
VTSS NAME CAPACITY (MB) DBU HI AMT LOW AMT VTV COUNT MX MT MN MT DEF ACS AUTO MIG STATE HBVTSS16
56,209
55
80
60
2440
6
3
02
-
ONLINE
HBVTSS17
56,209
50
80
60
2180
6
3
02
-
ONLINE
HBVTSS18
56,209
52
80
60
2288
6
3
01
-
ONLINE
HBVTSS19
93,184
45
80
60
1900
6
3
01
-
ONLINE
Table 4-1 shows the status of four ”operating correctly” VTSSs:
-
First, all VTSSs are online, which is usually good.
-
The LAMTs are all 60 and the HAMTs are all 80, which are good ranges for optimizing VTSS usage and promoting effective automatic migration.
-
The DBUs are all well lower than the HAMT, which means there is still space to grow on the VTSS before auto-migration starts. You might even consider routing more work to these VTSSs to optimize your investment in virtual tape.
-
Assume you have eight RTDs connected to each VTSSs. The MX MTs (maximum migration tasks) are set at 6 and the MN MTs (minimum migration tasks) are set at 3, which are good numbers. The max of 6 leaves 2 RTDs for recalls/reclaims, and the minimum of 3 ensures that if a bunch of migrations suddenly start, there are enough tasks to handle the load.
What if Display VTSS does not look so good? Maybe something like Table 4-2.
Table 4-2 Example Output from Display VTSS - VTSSs with Major Operational Issues
VTSSNAME CAPACITY (MB) DBU HI AMT LOW AMT VTV COUNT MX MT MN MT DEF ACS AUTOMIG STATE HBVTSS16
56,209
90
80
60
27,888
4
2
02
-
ONLINE
HBVTSS17
56,209
92
80
60
28,974
4
2
02
-
ONLINE
HBVTSS18
56,209
90
80
60
22,005
4
2
01
-
ONLINE
HBVTSS19
93,184
92
80
60
26,009
4
2
01
-
ONLINE
Table 4-2 shows the status of four VTSSs that have some major operational issues:
-
At least they are all online. If not, unless you know a reason why they ought to be offline or in maintenance mode, enter some
Vary VTSScommands to get them back online. -
The DBUs are all too high. Anything in the 90 plus range means the VTSSs are struggling to auto-migrate VTVs, which is not surprising because of the following.
-
Assume you have eight RTDs connected to each VTSSs. The MX MTs (maximum migration tasks) are set at 4 and the MN MT (minimum migration tasks) are set at 2, which is definitely a little light for the current migration load.
To fix the problem, go to step 2.
-
-
If you did not like what you saw in step 1, tune up your operating parameters.
First, get some more migration tasks going:
set migopt vtss(vtssname) maxmig(8) minmig(8) high(70) low(40)You now have all RTDs fully engaged in migration on all VTSSs. Keep it that way until you get the DBU under control, then go back to something like 6 max, 3 minimum. You also changed the AMTs to 40 low, 70 high. This gets you out of trouble, and the next time around, migration starts sooner and bring the buffer to a lower DBU.
Next, enter a Display VTD to get a picture of your system's VTDs.
Table 4-3 shows an example of Display VTD output.
Table 4-3 Example output from Display VTD - Operating Correctly
DRIVE LOCATION VTV STATUS A800
HBVTSS16
X00778
MOUNTED
A801
HBVTSS16
X00775
MOUNTED
A802
HBVTSS16
-
AVAILABLE
A803
HBVTSS16
-
AVAILABLE
Once again, you are in good shape in Table 4-3, with some VTDs in use and others ready to be used.
What if all VTDs showed VTVs mounted? Not so good, because then you risk job allocation failures if no drives are available. If it is because of something like the problem that occurred in step 2, then just accept it and vow that, in the future, you arrange workloads to let your VTDs better handle the influx of data. If this is a long term problem, however, you may need more VTSSs or upgrades to VTSSs with more capacity and more VTDs.
-
Now it is time to see if you have enough scratch VTVs on hand by entering a Display SCRATCH command, which produces the output shown in Table 4-4.
Table 4-4 Example output from Display SCRATCH
SUBPOOL-NAME SCRATCH-COUNT VIR000
14,364
VIR0002
13,582
VIRTUAL
19,132
VIRTUAL1
9,905
In Table 4-4, what you are seeing are VTV scratch counts for HSC subpools. If you do not use HSC subpools for VTVs, you see VTV scratch counts for all VTVs defined to your system. There are no good or bad numbers for scratch counts, as long as you have some scratch VTVs available. The ”right number of available scratches” depends on your shop's needs and workload.
If Table 4-4 showed 50 or fewer scratches available for each subpool, you might be a little concerned, right? If this happens, you can do one or more of the following:
-
Free VTV volsers by scratching VTVs with data that is not current. This is the move to make if you have enough total VTVs in your system, but there are not enough scratch volumes available.
Actually, you do not do the scratching, it is your TMS that is supposed to do the work, and the initial configuration should have defined your VTV volsers to your TMS. If that did not happen, go back and do it. More likely, you may have added VTV ranges through the VTCS CONFIG statement and forgot to define the new ranges to your TMS, so go back and fix that problem. This is all described in Installing ELS.
Note however, that marking VTVs as scratch with your TMS is just part of the solution. What also has to happen is that somebody in VSM-land has to mark the VTV data non-current (and therefore, writeable), and, in the case of VTSS-resident VTVs, delete them from the buffer.
Because actually deleting VTV data is a significant decision (data is gone), you are going to make a judgment call and say it is an ”as-needed” task, if you go this route, turn to "Doing Demand MVC Space Reclamations."
-
Use POOLPARM or VOLPARM to add VTVs. This is your next best option, and you do it when you really do not have any VTVs with non-current data. It turns out that it is not just POOLPARM or VOLPARM, you also have to do the appropriate TMS definitions, and so forth. Again, this is all described in Installing ELS.
-
Change your TAPEREQ statements or SMS routines to temporarily reroute tape work to Nearline HSC processing until you can define additional VTVs. This is probably your least desirable option, because you are essentially sending data directly to Nearline tape that you originally intended to send to VSM, so cleaning up the mess is not trivial. Still, if you have Nearline resources available and you have an immediate need to write data to scratch volumes, this is the (temporary) way to go.
-
Checking Nearline Tape Status (Daily)
"Checking Virtual Tape Status (Daily)," talks about how important it is to ensure that your system's VTSS, VTDs, and VTVs are operating normally.
Think of the Nearline component of VSM (RTDs and MVCs), the place where VTVs are being migrated to and recalled from, with some MVC space reclamation going on in the background, and you will agree that this area deserves your full attention, too.
To check Nearline Tape status:
-
Enter a Display RTD.
A good picture might be something like Table 4-5.
Table 4-5 Example output from a VT Display RTD command - All is well
RTD STATUS MOUNT ALLOC HOST VTSS B200
ONLINE/FREE
-
-
-
HBVTSS16
B201
ONLINE/FREE
-
-
-
HBVTSS16
0B79
ONLINE/FREE
-
-
-
HBVTSS16
0B7A
RECALL VTV
DMV051*
DMV051
EC20
HBVTSS16
1600
MVS1 :MIGRATE
-
-
-
-
1601
MVS1 :MIGRATE
-
-
-
-
In Table 4-5, things are moving along smartly because there is a good balance of RTDs migrating, recalling, and available for new work, which is not true in Table 4-6.
Table 4-6 Example output from a VT Display RTD command - RTDs in Distress
RTD STATUS MOUNT ALLOC HOST VTSS B200
MVS1 :MIGRATE
-
-
-
-
B201
MVS1 :MIGRATE
-
-
-
-
0B79
MVS2 :MIGRATE
-
-
-
-
0B7A
MVS2 :MIGRATE
-
-
-
-
1600
MVS1 :MIGRATE
-
-
-
-
1601
MVS1 :MIGRATE
-
-
-
-
If Table 4-6 is a result of the kind of emergency measures employed in step 2, then there is not much you can do other than wait until things quiet down. If, however, you do have other RTDs available, for example, RTDs that you are sharing manually with MVS and VSM, vary them offline to MVS and use Vary RTD to make them available to VTCS.
-
Next, see how your MVCs are doing with a Display MVCPool command.
Figure 4-1 shows an example of Display MVCPool output with no MVC pool name specified, so you see information for all your system's MVCs.
Figure 4-1 Example output from Display MVCPool (no pool name specified)
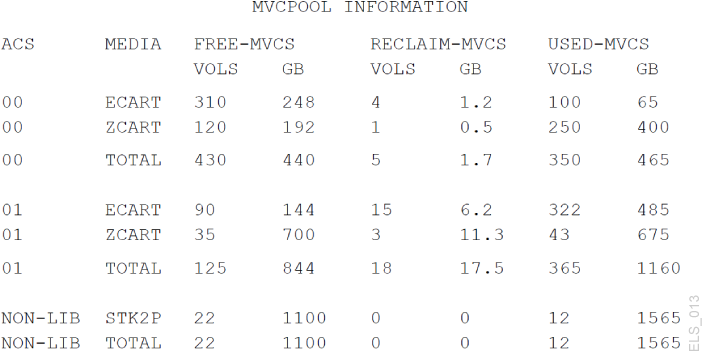
Description of ''Figure 4-1 Example output from Display MVCPool (no pool name specified)''
Figure 4-1 shows that your MVC collection is in good condition. There appear to be plenty of Free MVCs (100% usable space, no migrated VTVs) and plenty of free space across multiple ACSs and MVC media types. Numbers for MVCs eligible for reclaim are relatively low, meaning that automatic space reclamation probably does not get in the way of migrate/recall activity.
Used MVCs look all right in proportion to Free MVCs, except maybe in ACS 01, ECART and ZCART media. For these MVCs, you might want to do some investigation. Find out which Storage Classes represent these MVCs, which Management Classes correspond to these Storage Classes, maybe scratch some VTVs by Management Class.
What if Display MVCPool showed you something like Figure 4-2?
Figure 4-2 Example output from Display MVCPool - Problem in ACS01
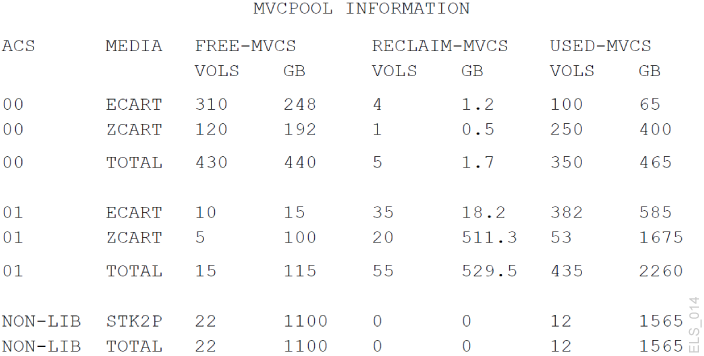
Description of ''Figure 4-2 Example output from Display MVCPool - Problem in ACS01 ''
As you can see, things have gotten worse in ACS 01. What do you do now? Consider the following, probably in this order:
-
Do demand reclamation to free space; for more information, see "Doing Demand MVC Space Reclamations."
-
Add MVCs as described in "Changing RTD Device Types."
-
Find out which Storage Classes represent these MVCs, which Management Classes correspond to these Storage Classes, maybe scratch some VTVs by Management Class.
As a follow-up, review your current policies and adjust as needed. You may be able to create free MVCs or free space on MVCs by changing these policies.
-
Looking at the Big Picture (Weekly)
This one is not too complicated, and basically consists of running your other two primary status tools (MVC Report and VTV Report) on a weekly basis.
Using the VTV Report
Note:
The VTV report is run using one of the following commands:-
VTVRPT BASIC, which shows all VTV copies migrated to MVCs using theEXPORTcommand -
VTVRPT COPIES, which shows all VTV copies migrated to MVCs using theEXPORTcommand, and, additionally, all VTV copies migrated with theEEXPORTcommand
Start with a VTV Report, which looks like Figure 4-3.
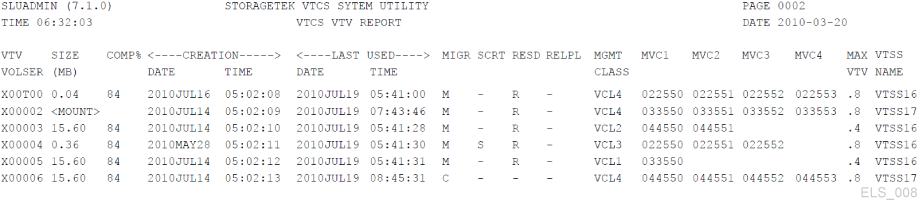
At first glance, the VTV Report looks overwhelming and non-intuitive, a lot lines of data each describing everything you ever wanted to know about each and every VTV in your system.
What are some ways you can make a VTV Report more useful to your situation? To start with, you can run the VTVRPT utility against a list of volsers, a volser range, or even an individual volser. If you have specific VTVs in mind that you want to examine, use one of these selection options.
Second, the VTVRPT utility also provides the OPTION(UNAVAIL) parameter, which produces a report on unavailable VTVs that looks like Figure 4-4.
Figure 4-4 Example output from VTVRPT (UNAVAIL option)
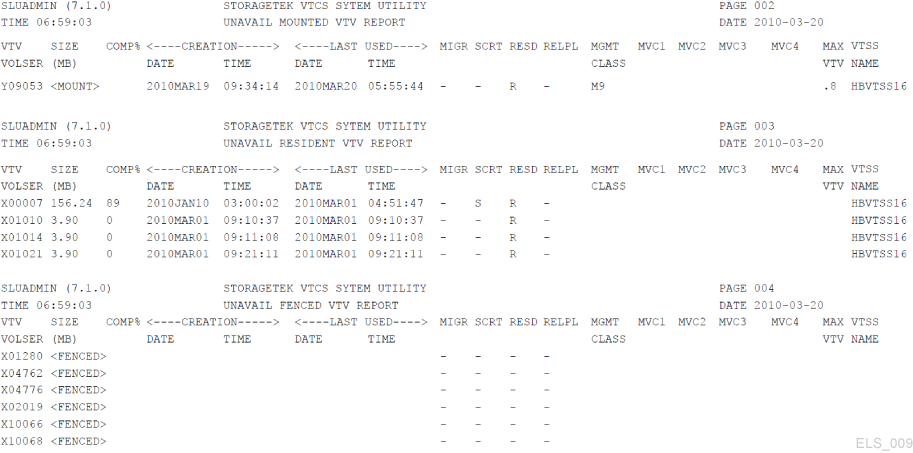
Description of ''Figure 4-4 Example output from VTVRPT (UNAVAIL option) ''
Obviously, OPTION(UNAVAIL) is the best option if you have had any reports of jobs (or VTCS) that are unable to access VTVs you thought were resident.
Also you get flexibility with XML output from the VTVRPT utility. You can generate, for selected reports and utilities, output in either Structured XML or Comma Separated Variables (CSV) XML.
What is the difference between Structured XML and CSV output? Consider this:
-
Structured XML contains all of the tags and structures shown for each command or utility (which you can then process, as desired, using a programming language of your choice).
-
CSV output lets you select only the tags (and their order) that you want. Each output line contains a fixed number of fields separated by commas, which can then be input into spreadsheets or report writers for customizable analysis or reports.
You now have two ways you can effectively customize a basic VTV Report for your shop's needs. For more information on this topic, see ELS Programming Reference.
Finally, you should be aware that LCM provides enhanced management and reporting capabilities that correspond to ELS/VTCS functions, including the VTCS MVC and VTV Reports. For more information, see "LCM Control Statements."
Using the MVC Report
Finally, look at an MVC Summary Report, which looks like Figure 4-5.
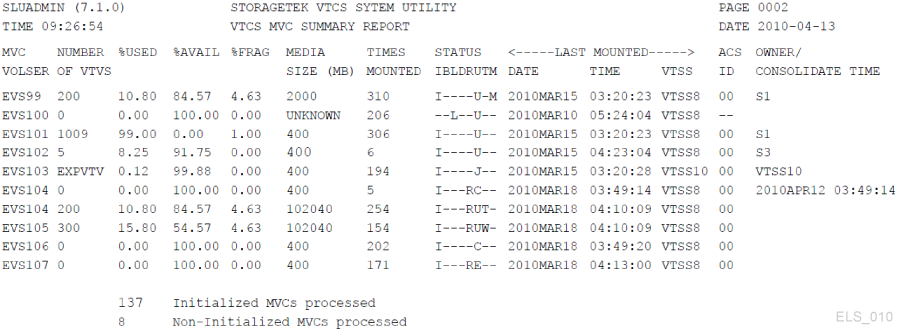
The MVC Summary Report is a lot like the stock VTV Report; nice, if you know what you are looking for, but perhaps too much information otherwise.
The additional fields you get from an MVC Detailed Report may be more useful for a better picture. See Figure 4-6.
Figure 4-6 Example MVC detailed report (additional fields)
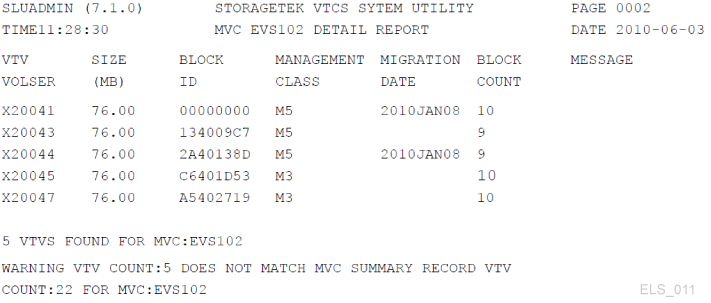
Description of ''Figure 4-6 Example MVC detailed report (additional fields) ''
Here is some detailed information about the VTVs on an MVC that you can do some diagnostic work with, if necessary.
Just as is now available with the VTV Report, you can also do either of the following with the MVC Report:
-
Generate output in either Structured XML or Comma Separated Variables (CSV) XML as described in ELS Programming Reference.
-
Use the corresponding LCM reports, as described in "LCM Control Statements."
In Summary
That is about all there is to using the VTCS Dashboard. There is a bunch of other tasks you could do, and probably will do, such as but not limited to running MVC Pool Reports if you used Named MVC Pools. But that is information for ”As Needed” management tasks.
The main thing you should learn from this chapter is do your dailies as described in "Checking Virtual Tape Status (Daily)" and "Checking Nearline Tape Status (Daily)" and your weeklies discussed in "Looking at the Big Picture (Weekly)," and you will keep your VTCS system running properly.