| Oracle® Pulse for the Managed Cloud User's Guide Release 4.0 for all platforms E27009-01 |
|
|
PDF · Mobi · ePub |
| Oracle® Pulse for the Managed Cloud User's Guide Release 4.0 for all platforms E27009-01 |
|
|
PDF · Mobi · ePub |
Part of Cloud Automation Platform (CAP), Oracle® Pulse for the Managed Cloud is a ground breaking product, giving you a single-source-of-truth view of all your Oracle Managed Cloud Services. Use Oracle Pulse on your iPad, or on your desktop or mobile device using most standard Web browsers.
After signing in, you will see the new Oracle Pulse landing page. The crisp new look of the landing page is just part of a major redesign, bringing both form and function up to latest user experience standards:
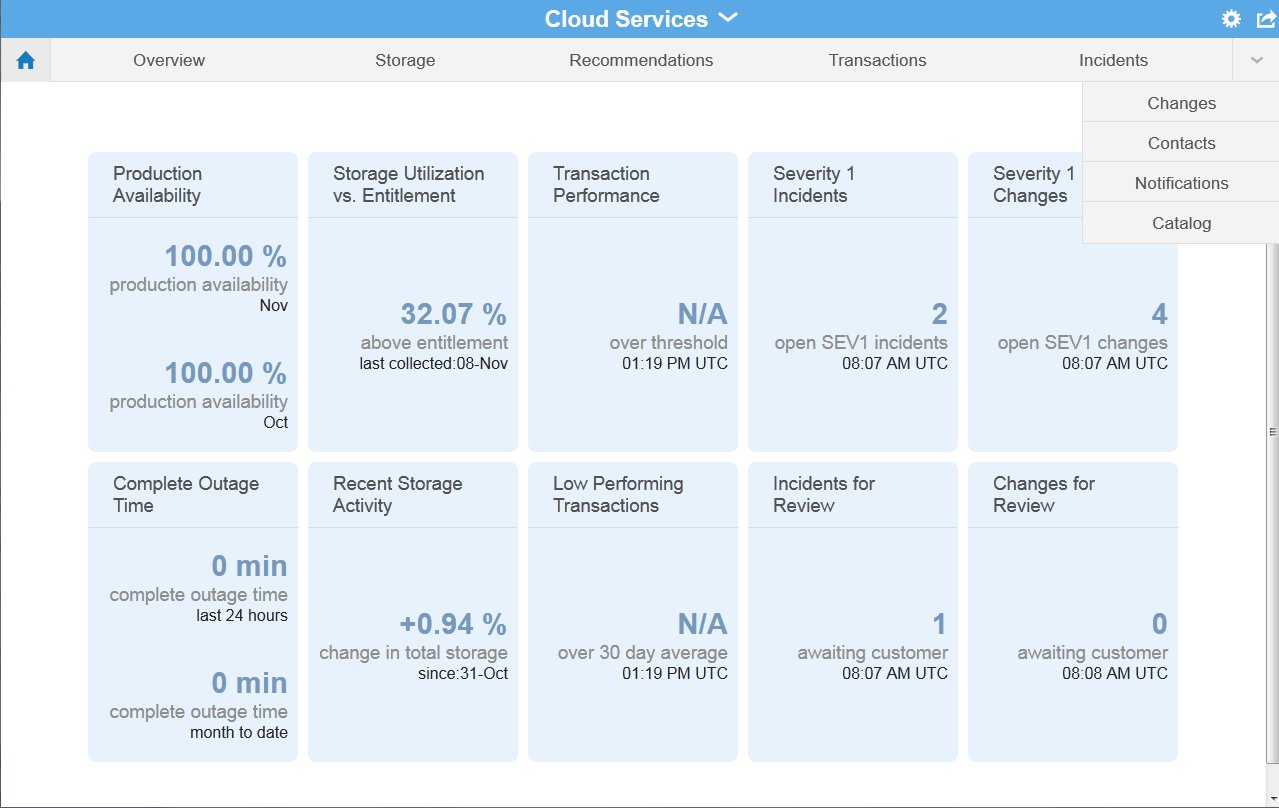
Use the new landing pad to get a sense of your services' overall performance and, if necessary, to quickly identify and understand any shortfalls. Serving as the new home page for Oracle Pulse, the landing pad provides a concise summary of your Managed Cloud Services' recent performance in five key areas:
Avaibility - Check the production availability of all your services for the last two months in Production Availability and identify any outages over the last 24 hours or the last month in Complete Outage Time.
Storage - Compare storage used by all your services with your entitlement and identify any individual service consuming a disproportionate amount in Storage Utilization versus Entitlement. You can also review recent storage activity and note any significant increases under Recent Storage Activity.
Transaction Performance - Where business transaction monitoring (BTM) has been implemented, Transaction Performance shows the number of transactions exceeding the performance threshold can point to issues with the associated service. Similarly, you may want to investigate any service that is shown to have a number of low performing transactions in Low Performing Transactions.
Service Requests - A high number of Severity 1 incidents (that is, service requests (SRs)) created on your production instances can merit further analysis - see Sev 1 Incidents. You can also check the number of Sev 1 incidents that require your action to proceed, under Incidents for Review.
Requests for Change - Sev 1 Changes will indicate any scheduled changes (that is, requests for change (RFCs)) that will cause a complete loss of service for mission critical operations, while Changes for Review lists those Sev 1 Changes that require your action to proceed.
You can pinpoint the service or environment responsible for a performance deficit by tapping the relevant tile. To learn more, see Chapter 2, "Using the Landing Pad".
Responsive design has been introduced on cross-platform UIs, greatly extending the range of devices you can use. Open Oracle Pulse in a Web browser on any smart device, tablet, or desktop and see the UI adapt intelligently through vertical tiling of widgets and navigation bars. To accommodate these changes, the Notifications, Contacts, and Catalog screens are accessible from the Customer Dashboard.
Support for Apple iOS 7 (iPad Only)
Oracle Pulse now supports Apple iOS7 standards on iPad, designed to take advantage of the most advanced iPad features in an 'elegant and intuitive interface'.
You can access Oracle Pulse on your iPad, or on your desktop or mobile device using any Web browser.
To access Oracle Pulse on your iPad:
Search for Oracle Pulse in the Apple iStore then tap Install.
Tap the Oracle Pulse icon to start the app.
When the sign in screen appears, enter your single sign on (SSO) username and password.
If you would like to populate Oracle Pulse with sample data, check the Sample Data check box.
Click Sign In.
(If your username is associated with more than one customer organization, select the organization you would like to review from the list presented.)
This populates Oracle Pulse with service information for all your organization's Managed Cloud Services, or with sample data if you selected the Sample Data check box.
To access Oracle Pulse on your mobile device or desktop:
Open the following Web page in any Web browser:
https://cloudservices.oracle.com/pulse
Click Sign In.
If you would like to populate Oracle Pulse with sample data, check the Sample Data check box.
The single sign on page appears.
Enter your single sign on (SSO) username and password.
Note:
If this is your first time to sign in to Oracle Pulse, the End User License Agreement for Oracle Pulse is displayed before the single sign on screen.Read the agreement then select Accept if you accept the terms and conditions for using the application.
If your username is associated with more than one customer organization, select the organization you would like to review from the list presented.
This populates Oracle Pulse with service information for all your organization's Managed Cloud Services, or with sample data if you selected the Sample Data check box.
Oracle Pulse supports the following browsers:
Microsoft Internet Explorer 9 and later
Firefox 10 ESR and later
Chrome 19 and later
Safari (Desktop) 5 and later
This section describes how to navigate Oracle Pulse. It explains how to move through three levels of information using the dashboard structure and how to use the user interface (UI) features common to all screens.
Oracle Pulse presents a comprehensive view of all your organization's Managed Cloud Services using organization, service, and environment level dashboards. This section describes how to use these dashboards and related lists to navigate Oracle Pulse.
Landing Pad - The landing pad, which is the Oracle Pulse home screen, analyzes the recent performance of all your organization's Managed Cloud Services. Tap any tile to see the data view:
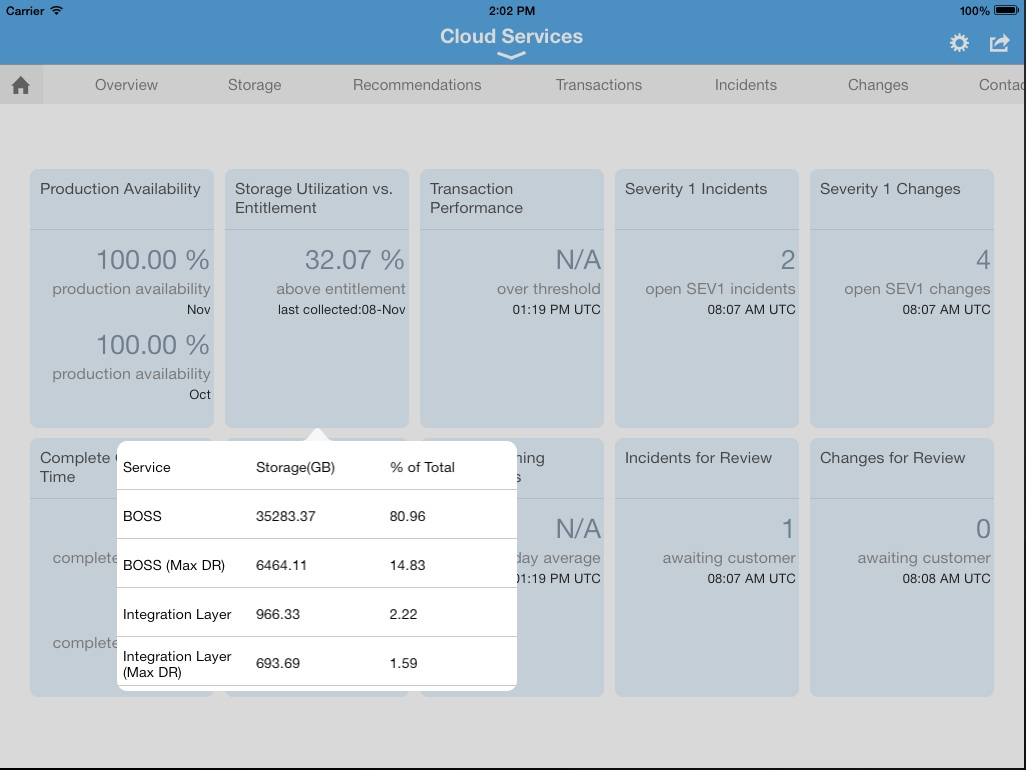
For example, tapping the Storage Utilization vs. Entitlement tile displays a list of all services with the storage each consumes in GB and the percentage of total storage consumed by each.
Customer Dashboard - The Customer Dashboard shows the health of all your organization's Managed Cloud Services. Tap any service record to open the Service Dashboard.
Service Dashboard - The Service Dashboard presents key information for the selected service. Tap any environment record in the bottom part of the screen to open the Environment Dashboard.
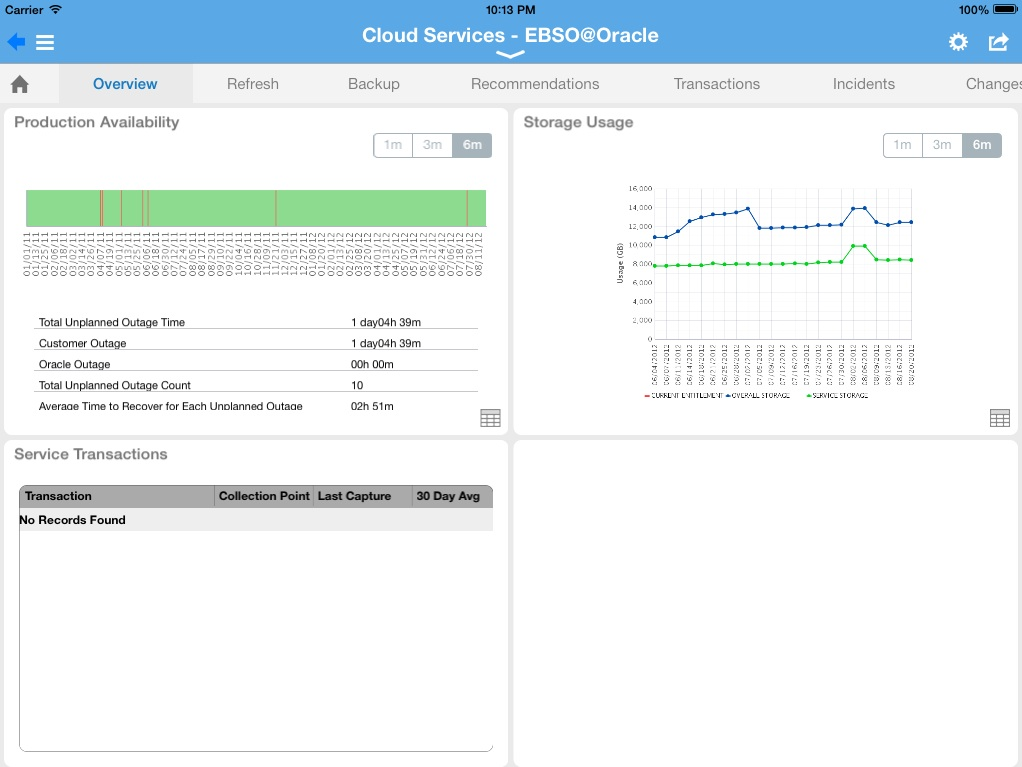
You can also switch to the Service Dashboard for another service by tapping the arrow beside the service name, then selecting the new service.
Environment Dashboard - The Environment Dashboard shows key performance indicators for the selected environment. Tap any host record to see host metrics.
You can also switch to the Environment Dashboard for another environment by tapping the arrow beside the environment name, then selecting the new environment.
This section describes the layout of the Oracle Pulse user interface (UI).
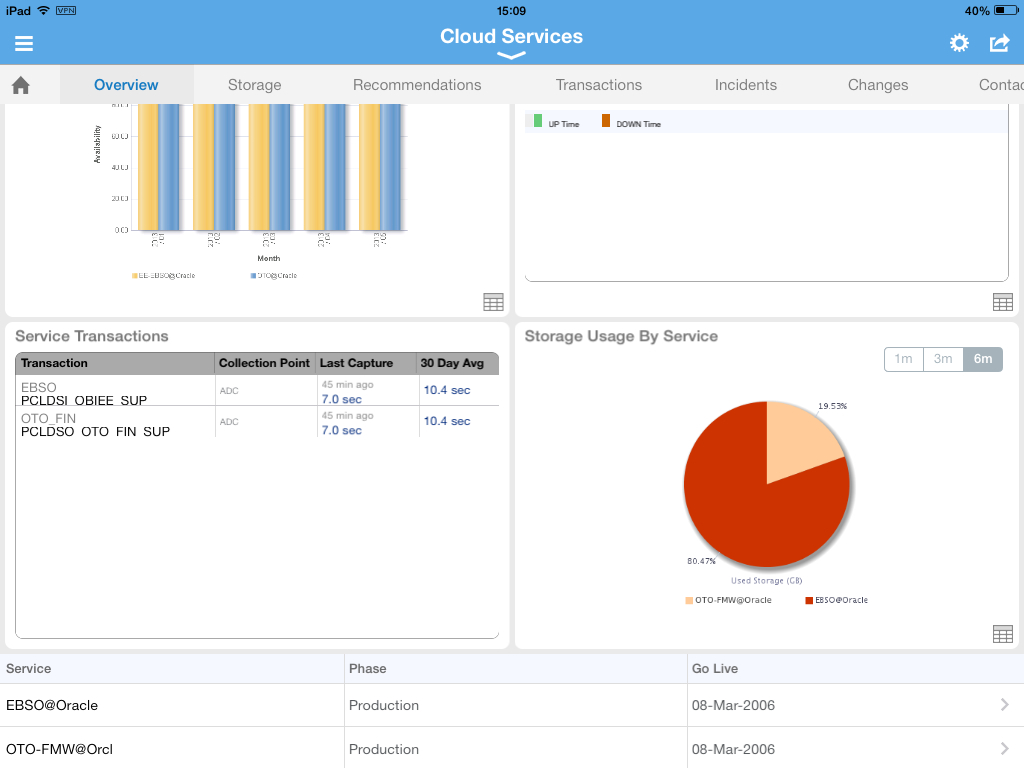
The Customer, Service, and Environment Dashboards use a common layout, displaying pairs of related widgets side by side and a table of records at the bottom of the screen. Widgets show both chart and data views key performance indicators, while the table lists all related records.
Double tap any of the widgets to expand to full screen mode. Toggle between the widget chart view and data view using the symbols in the bottom right corner of the widget. Tap any record to open the lower level Dashboard.
On Web browsers, dashboard design also responds to device size. Widgets stack vertically and you can scroll up to see more widgets or the table of records.
In the example above, the Customer Dashboard displays charts for production availability of all the organization's Managed Cloud Services ordered by service and by environment.
Scroll to see the hidden Storage Usage and Key Transaction widgets. The records show the name, phase, and go live date of all Managed Cloud Services, both live production services and those still in implementation. If key performance indicators for a service are not listed in the widgets in the swim lanes, the service is likely to be in implementation - you can confirm this in the table at the bottom of the screen. Tap any service record to open the Service Dashboard for that service.
Navigation Bars at the top of each screen show options for the Landing Pad and the Customer, Service, and Environment Dashboards. By default, all dashboards display the Overview view when opened. Navigation bar options respond to the width of the screen, with options stacked to the right:
For example, use the navigation bar on the Customer Dashboard, shown above, to move between the overview, storage, recommendations, incident reports, and change reports.
The following table shows the icons with descriptions:
| Icon | Name | Description |
|---|---|---|
| Home | Click the Home icon to return to the Landing Pad, which is the Oracle Pulse home screen. | |
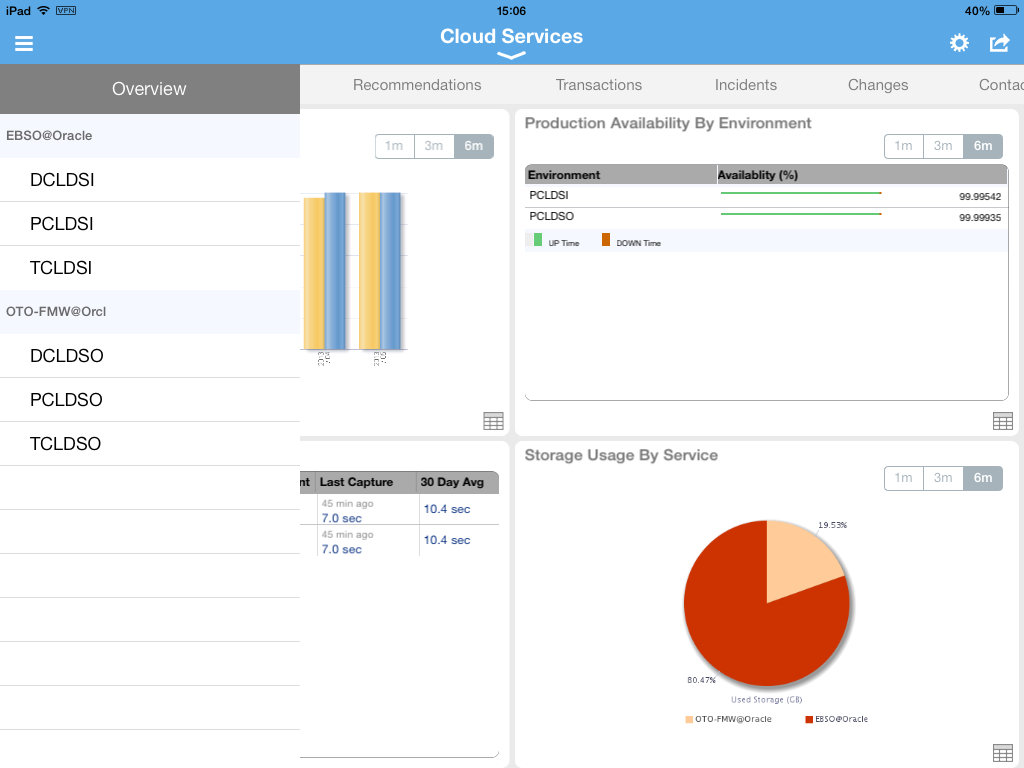
| Menu | Click the Menu icon to see:
(iPad only) Topology of all your organization's Managed Cloud Services and associated environments. Note: Web browser users can view a similar list by selecting the arrow beside the name on the title bars of the Customer, Service, or Environment Dashboards. |
|
| Settings | Click the Settings icon to sign in or out of Oracle Pulse, or to view help. | |
| Other Actions | Click the Other Actions icon to perform the following actions:
(iPad only):
(Web Browser only):
|
|
| Data View | Click the Data View icon in any widget to flip to the data used to create the chart. |
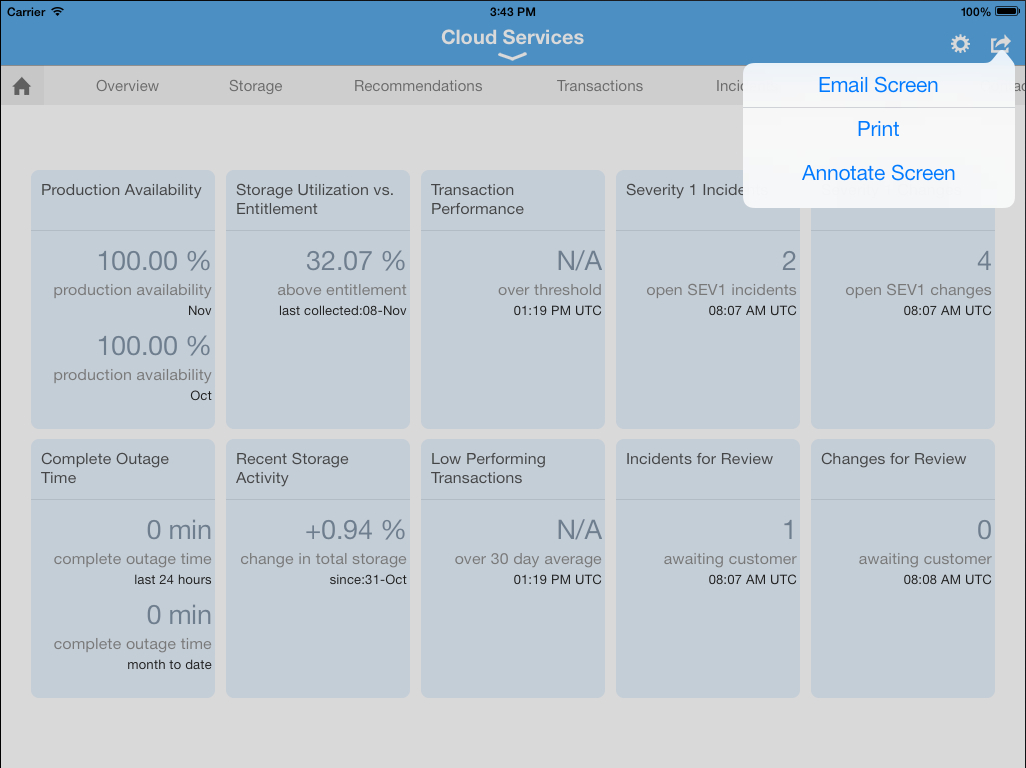
The Other Actions list in the top right of Oracle Pulse provides a number of options depending on where it is accessed.
iPad provides additional options under Other Actions to help streamline communication of Oracle Pulse information and to request additional storage, backups, and refreshes.
In any screen, tap Email Screen in the Other Actions list on the top right to e-mail the contents of the screen. You can save or delete the draft created. In the data view of any widget, an additional Email Report option provides the ability to e-mail the data used to create the view.
Use Annotate Screen to attach notes to the current screen before e-mailing or select Print to send the current screen to one of the printers set up on your device. Setting up printers is specific to a device, and you should refer to the local settings or help to enable printing.
On supported Web browsers, you can request further services by e-mail using the Other Actions icon on the Service Dashboard.
In any screen, tap Email in the Other Actions list on the top right to e-mail the contents of the screen. You can save or delete the draft created. In the data view of any widget, an additional Email Report option provides the ability to e-mail the data used to create the view.
Under the Refresh option, Other Actions select Request Refresh to submit a request for a refresh by e-mail. Similarly, you can send an e-mail requesting additional backups using Request Additional Backups on the Backups screen or ask for additional storage using the Request Additional Storage on the Storage screen.
Finally, select Request Additional Services option to submit a request to extend your current offering.
|
Copyright © 2013, Oracle and/or its affiliates. All rights reserved. Legal Notices |
|