1 Introduction
Oracle® Pulse for the Managed Cloud is a ground breaking product, giving you a single source of truth view of all your Oracle Managed Cloud Services. Use Oracle Pulse on your iPad, or (using most standard Web browsers) on your desktop or mobile device.
What's New in Oracle Pulse Release 5.0?
Release 5.0 introduces new infrastructure availability metrics and extends responsive design on Web browsers:
New Metrics for Infrastructure Availability
Previously, availability was presented as a single overall production measure. From Release 5.0, you can also view infrastructure availability separately at customer, service, and environment levels.
Infrastructure availability is the percentage of time that the underlying facility, network, and hardware components associated with your production environments are operating as expected. Availability metrics take account of unplanned outages but do not include planned maintenance or service interruptions.
The Overview sections of the Customer, Service, and Environment Dashboards now show infrastructure production availability along with overall production availability and, at service and environment level, a table of key infrastructure metrics.
The new Infrastructure Availability tile on the Landing Pad shows infrastructure availability across all your organization's Managed Cloud Services, replacing the Complete Outage Time tile. To view outage times, tap the Overall Availability or Infrastructure Availability tiles and review the respective data tables.
Self Service Capabilities Extended to Customer and Service Levels
Previously available only on the Environment Dashboard, self service capabilities are now included on the Customer and Service Dashboards. The self service icon (+) is available on the Changes screen in the Customer, Service, and Environment Dashboards.
If you have the corresponding privileges, you can request a refresh or system restart using the option on your Customer Dashboard or Service Dashboard, as well on the Environment Dashboard. If you do not have these privileges, you will see an error message and the process will not be initiated.
New Time Intervals in Availability Charts
Following ITIL principles, availability is measured over complete, rather than partial, time intervals. This is reflected in the revised time intervals for all availability chart and data views.
For example, if you select a time interval of 6 months on Monday May 6th, 2014, the Production Availability by Service chart and data views now display availability for six complete months: November, December, January, February, March, and April, as well as the availability from May 1st to 5th, 2014.
Responsive Design for Web Browsers
Release 5.0 improves the adaptive behavior of Oracle Pulse in Web browsers. On smaller screens, the Landing Pad and Dashboards elements stack vertically:
Additionally:
-
Notifications adapt better to smaller screens.
-
Charts are now separate from record tables on Dashboard pages, improving app efficiency particularly on the Changes screens, and responding quicker to the new time interval selectors.
-
New time interval selections provide more meaningful measures and improve the efficiency of the Incidents and Recommendations pages and of charts on all Dashboards.
Key Concepts
The analytics reports and historical data in Oracle Pulse cover five important areas of service delivery: availability, storage, incidents, changes, and (where enabled) business transactions. This section explains the conceptual basis for Oracle Pulse metrics in each area.
Availability Metrics
Oracle Pulse presents the latest representation of overall and infrastructure availability for your organization's Managed Cloud Services at the time of calculation. This section defines how Oracle calculates these metrics and highlights any assumptions underlying the values presented in Oracle Pulse.
Availability is a defining principle of ITIL service delivery and Oracle Managed Cloud Services follows ITIL principles for calculating availability. Following these principles, availability is the percentage of time that a production service is operating as expected and accessible by end users. In practice, this means that end users can log in and perform all business transactions.
Availability calculations take into account only unplanned complete outages for which Oracle is responsible. Such outages mean that end users experience total loss of service - they cannot log in or perform any transactions. Users logged in when the outage starts cannot complete current actions. The overall and infrastructure availability metrics include only unplanned complete outages where Oracle is responsible for restoring the service. If the customer organization is responsible for restoring service - for example, carrying out necessary repairs - the outage is not included in availability calculations.
These calculations also exclude planned outages, where the outage occurs at an agreed date and time due to regular maintenance or a customer request for change (RFC). If isolated business transactions cannot be completed, but other service transactions can be performed, this is considered a service interruption and does not affect availability calculations.
From Release 5.0 on, Oracle Pulse presents separate availability measures for Oracle Managed Cloud Services and associated infrastructure.
Overall availability reflects the percentage of time that an organization's live, production Oracle Managed Cloud Services were operating as expected and accessible by end users. Following earlier definitions, this calculation takes into account only complete service outages where Oracle was responsible for service restoration and planned service outages.
Infrastructure availability shows the percentage of time that the underlying facility, network, and hardware components associated with an organization's production Managed Cloud Services environments were operating as expected. This calculation takes into account only complete outages where the underlying root cause is attributed to hardware, security, network or OS and Oracle was responsible for service restoration.
Limitations of Oracle Pulse Availability Metrics
WARNING:
Owing to the manual nature of some systems and methodologies, availability data presented in Oracle Pulse represents the best estimate at the time of calculation and may be revised subsequently.
Availability data in Oracle Pulse represents the best estimate using current Oracle systems and methodologies. Data is calculated using outage information entered manually into Oracle Managed Cloud Services' internal tracking system. Outages are usually identified through automatic monitoring or when initiated by a customer or an Oracle employee in a service request (SR).
However, some outages are resolved directly without customer or Oracle involvement. Outages may also be attributed to the wrong fault category initially - for example, a technology stack outage may have actually been caused by a hardware failure. Therefore, availability data should always be considered to be the most accurate calculation at the time of calculation and may be revised subsequently.
Storage Metrics
Oracle Pulse provides storage metrics for all your organization's Managed Cloud Services. Storage usage metrics can be useful in detecting unusual storage consumption, pinpointing the source of each anomaly, and understanding when your storage usage is approaching current entitlement. For example, this can be useful in identifying services that consume a disproportionate amount of storage.
The Customer Dashboard covers storage usage across all your organization's Managed Cloud Services on the Storage page. This page displays the storage used by each service over the selected time interval and overall usage against your organization's storage entitlement, which is allocated as needed across all services. Additionally, you can check the storage by the Oracle Database and by non-Database services over the selected time intervals.
The Service Dashboard shows the storage consumed by the service compared to both current overall entitlement and overall usage across all services. Similarly, the Environment Dashboard shows similar metrics for the corresponding environment.
Finally, the Landing Pad summarizes storage usage against entitlement and shows any changes in recent storage activity. Significant changes in either measure warrant immediate investigation.
Incident Metrics
Oracle Pulse tracks all production service requests (SRs) - termed incidents - associated with your organization's Managed Cloud Services, using information drawn from My Oracle Support (MOS).
SR metrics are listed under Incidents on the Customer, Service, and Environment Dashboards. At the customer level, you can check the number of SRs created or closed, or the number of SRs created, over the selected time interval for all your organization's Managed Cloud Services. The Customer Dashboard also shows the SR backlogs for all services and the volume of SRs logged for each product line.
Similarly, you can see the SR resolution rates, SR backlogs, and SR incident volumes by product line over the time interval for an individual service under Incidents on the Service Dashboard and for an environment on the relevant Environment Dashboard.
However, customer level incident reports provide the most complete picture of your organization's SRs because many SRs are logged without reference to a service or environment. You can improve the accuracy of service level and environment level reports by ensuring that you associate each SR with a service or environment as appropriate.
You can also see a summary of open Severity 1 SRs and any SRs awaiting your review on the Landing Pad - a high number of Severity 1 SRs created on your production instances can merit further analysis.
Note:
To see service request (SR) information in Oracle Pulse, you must have the requisite SR privileges in MOS. See Requirements.Change Metrics
Requests for change (RFCs) are tracked in Oracle Pulse using information drawn from the My Oracle Support (MOS) database. Available on the Customer, Service, and Environment Dashboards, these metrics show the types of changes that have been scheduled or applied to all your organization's Managed Cloud Services down to the level of changes scheduled for individual environments and hosts.
The Customer Dashboard provides the most complete picture of your organization's RFCs. Under Changes you can see RFC metrics across all services. It compares the RFCs created with those applied to all services over the selected time interval, showing the rate of resolution. Similarly measuring the production, non-production, and total number of RFCs applied in each month gives a sense of the rate of resolution for all services. The applied changes are further broken down by RFC type, which can indicate clusters of change types, and by environment, where high numbers of changes in a single environment may require investigation.
The Service Dashboard provides the same RFC metrics for each individual service. This dashboard shows historical resolution rates for the service as well as metrics for RFCs applied to all associated production and non-production environments. It also breaks down RFCs by type across the service, highlighting any type clusters, and shows the distribution of RFCs in each service environment, which again can indicate issues with a particular environment.
Finally, the Environment Dashboard shows the number of RFCs created against those applied and the types of RFC applied to the environment.
Note:
To see service request (SR) information in Oracle Pulse, you must have the requisite SR privileges in MOS. See Requirements.Business Transaction Metrics
Transaction response times give a sense of the performance of your services and environments and can indicate potential or actual issues. Your Oracle Service Delivery Manager (SDM) can work with you to identify these transactions and set up Business Transaction Monitoring (BTM).
Note:
The Transactions option is displayed on the navigation bar only for services where business transaction monitoring (BTM) has been implemented.If BTM has not been implemented, the Transactions screen is hidden on the Customer, Service, and Environment Dashboards.
Your Oracle Service Delivery Manager (SDM) can work with you to set up and identify your key business transactions for monitoring.
Requirements
The minimum requirement to use Oracle Pulse is:
-
A valid My Oracle Support (MOS) account.
-
At least one customer support identifier (SI) associated with this MOS account.
-
(Self Service only) At least one active Oracle E-Business Suite (EBSO) service associated with this MOS account.
Additionally, you must have the following MOS privileges to perform specific tasks:
| Task | Required Privilege(s) |
|---|---|
| See Incidents on the Customer, Service, or Environment Dashboard | Your MOS account has the ViewSR privilege for your organization. |
| See Changes on the Customer, Service, or Environment Dashboard | Your MOS account has the ViewRFC privilege for your organization. |
| See Transactions on the Customer, Service, or Environment Dashboard | BTM has been enabled for your organization. |
| Request Additional Backup | No additional privileges. |
| Request Additional Refresh | |
| Request Additional Information Services | |
| Request Additional Storage | |
| Schedule a Refresh or Restart |
|
Supported Web Browser Versions
Oracle Pulse supports the following browsers:
-
Microsoft Internet Explorer Versions 9 and 10
-
Firefox Version 10 ESR and later
-
Chrome Version 19 and later
-
Safari (Desktop or Mobile) Version 5 and later
Supported Apple iOS Versions
Oracle Pulse for iPad now requires Apple iOS7, enabling a richer and more intuitive interface aligned with Apple standards.
If you are using a first generation iPad, you can access Oracle Pulse using a supported Web Browser.
Getting Started with Oracle Pulse
You can access Oracle Pulse on your iPad, or on your desktop or mobile device using any Web browser. See Supported Web Browser Versions and Supported Apple iOS Versions for more information about supported releases.
Accessing Oracle Pulse on Your iPad
To access Oracle Pulse on your iPad:
-
Search for Oracle Pulse in the Apple iStore then tap Install.
-
Tap the Oracle Pulse icon to start the app.
-
When the sign-on screen appears, enter your single sign-on (SSO) username and password.
If you would like to use Oracle Pulse with demo data, check the Sample Data check box.
-
Click Sign In.
(If your username is associated with more than one customer organization, select the organization you would like to review from the list presented.)
This populates Oracle Pulse with service information for all your organization's Managed Cloud Services, or with sample data if you selected the Sample Data check box.
Accessing Oracle Pulse on Your Mobile Device or Desktop
To access Oracle Pulse on your mobile device or desktop:
-
Open the following Web page in any Web browser:
https://cloudservices.oracle.com/pulse
-
Click Sign In.
If you would like to populate Oracle Pulse with sample data, check the Sample Data check box.
The single sign-on page appears.
-
Enter your single sign on (SSO) username and password.
Note:
If this is your first time to sign on to Oracle Pulse, the End User License Agreement for Oracle Pulse is displayed before the single sign on screen.Read the agreement then select Accept if you accept the terms and conditions for using the application.
If your username is associated with more than one customer organization, select the organization you would like to review from the list presented.
This populates Oracle Pulse with service information for all your organization's Managed Cloud Services, or with sample data if you selected the Sample Data check box.
Navigating Oracle Pulse
This section describes how to navigate Oracle Pulse. It explains how to move from the Landing Pad through three levels of information - Customer Dashboard, Service Dashboard, and Environment Dashboard - and how to use the user interface (UI) features common to all screens.
Understanding the Oracle Pulse Landing Pad and Dashboards
Oracle Pulse presents a comprehensive view of all your organization's Managed Cloud Services using organization, service, and environment level dashboards. This section describes how to use these dashboards and related lists to navigate Oracle Pulse.
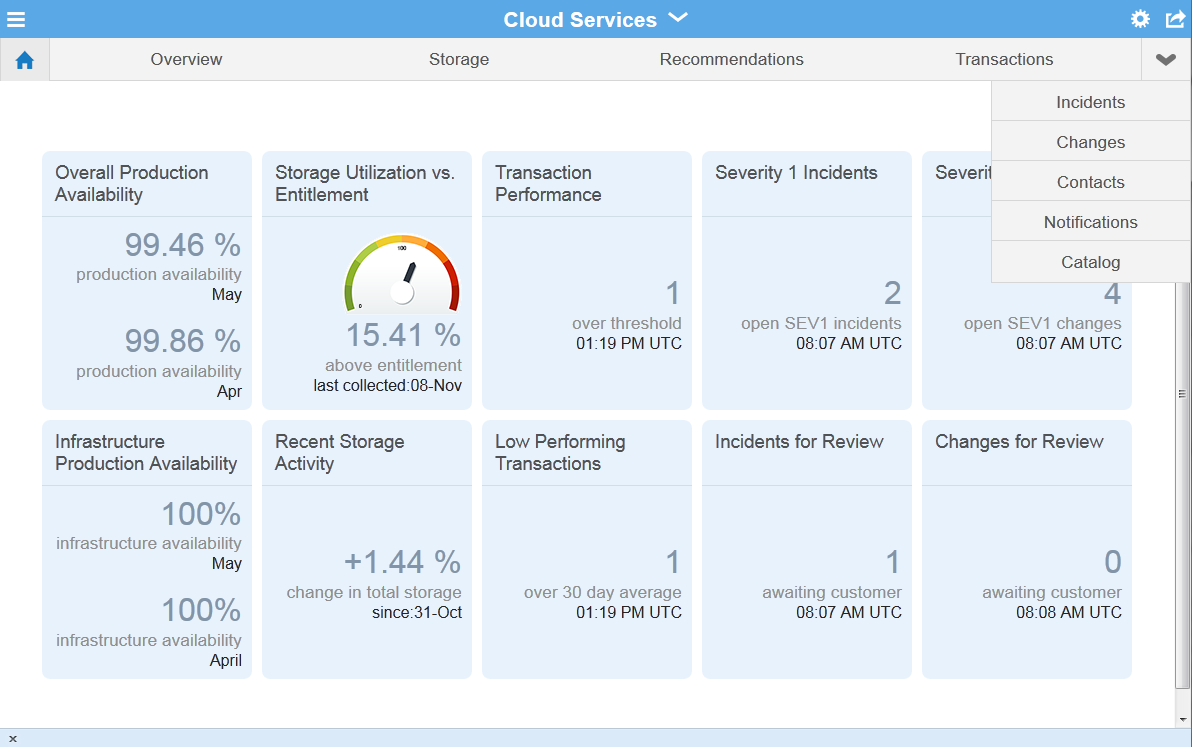
Landing Pad - The Landing Pad, which is the Oracle Pulse home screen, analyzes the recent performance of all your organization's Managed Cloud Services. Tap any tile to see the data view:
For example, tapping the Storage Utilization vs. Entitlement tile displays the Storage Usage vs. Entitlement table, listing with the storage used in GB and the percentage of total storage consumed by each of your organization's Managed Cloud Services. Then tap any service/row to open the Service Dashboard populated with metrics for that service or tap the Total row to open the Storage page on the Customer Dashboard.
(Web browsers only) To improve your Oracle Pulse experience on smaller screens, such as iPhones or other smartphones, Landing Pad tiles and the Dashboard widgets stack vertically.
Customer Dashboard - The Customer Dashboard shows the health of all your organization's Managed Cloud Services. Select any of the options on the Customer Dashboard navigation bar to see corresponding information for all your organization's Managed Cloud Services in that area. For example, tap Storage to view storage metrics for all your organization's Managed Cloud Services.
Service records are listed at the bottom of the Customer Dashboard. Tap any service record to open the corresponding Service Dashboard.
Service Dashboard - The Service Dashboard presents key information for the selected service. Similar to the Customer and Environment Dashboards, the Service Dashboard provides a range of navigation bar options that open a Dashboard page with related metrics. For example, the Incidents page displays incident metrics - that is, service request (SR) metrics - for the selected service.
Environment records are listed at the bottom of the Customer Dashboard. Tap any environment record in the bottom part of the screen to open the Environment Dashboard.
You can also switch to the Service Dashboard for another service - tap the Services and Environments menu icon on the upper left of the screen, then select the service you want to view.
Environment Dashboard - Similar to the Customer and Service Dashboards, the Environment Dashboard shows key performance indicators for the selected environment.
Host records are listed at the bottom of the screen. Tap any host record to see host metrics.
You can also switch to the Environment Dashboard for another service - tap the Services and Environments menu icon on the upper left of the screen, then select the environment you want to view.
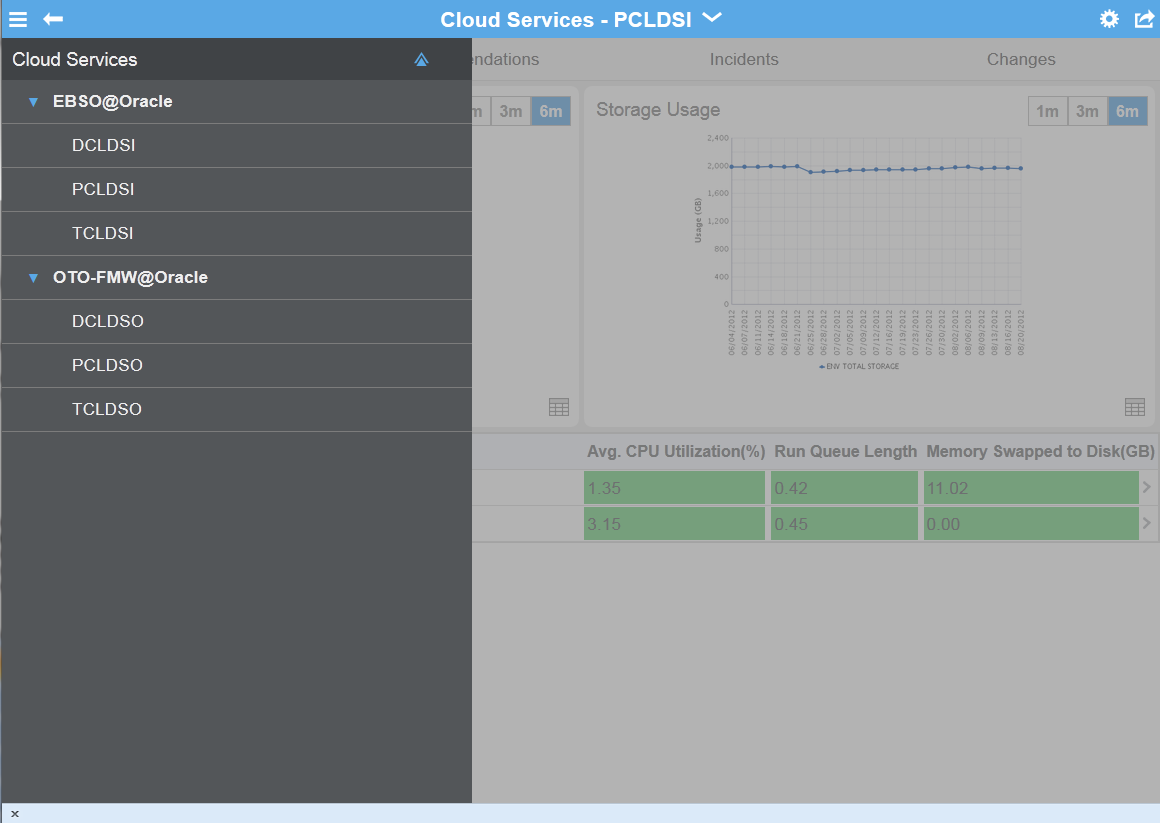
Services and Environments Menu - The Services and Environments menu lists all your organization's Managed Cloud Services and associated environments. You can access this menu on any screen in the Service or Environment Dashboards using the menu icon in the top left of the screen. At environment level, the menu lists all other environments for the associated service, while all services and corresponding environments are listed at service level.
Understanding the User Interface
This section describes the layout of the Oracle Pulse user interface (UI).
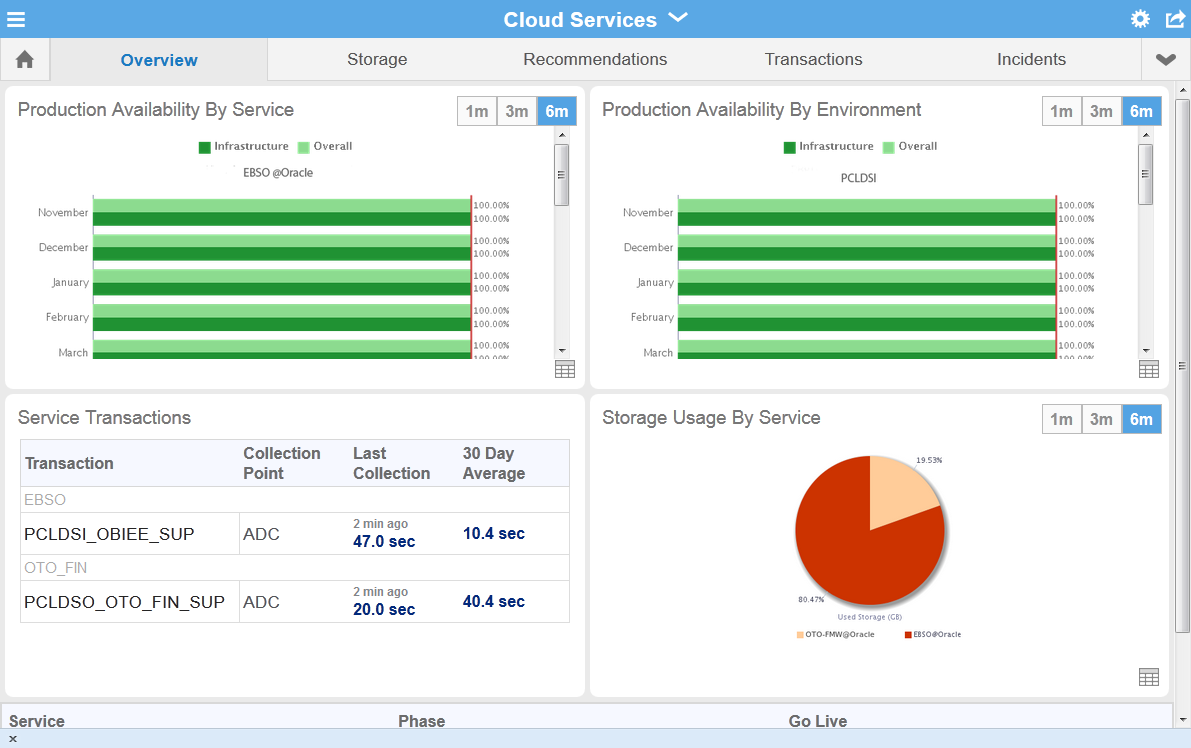
The Customer, Service, and Environment Dashboards use a common layout, displaying pairs of related widgets side by side and a table of records at the bottom of the screen. Widgets show both chart and data views key performance indicators, while the table lists all related records.
Double tap any of the widgets to expand to full screen mode. Toggle between the widget chart view and data view using the symbols in the bottom right corner of the widget. Tap any record to open the lower level Dashboard.
Where charts or tables are longer than the widget, tap the widget to open expanded or full screen mode. Availability widgets also include horizontal and vertical scroll bars.
On Web browsers, dashboard design also responds to device size. Widgets stack vertically and you can scroll up to see more widgets or the table of records.
In the example above, the Customer Dashboard displays charts for production availability of all the organization's Managed Cloud Services ordered by service and by environment.
Scroll up to see the hidden Storage Usage and Key Transaction widgets. The records show the name, phase, and go live date of all Managed Cloud Services, both live production services and those still in implementation. If key performance indicators for a service are not listed in the widgets in the swim lanes, the service is likely to be in implementation - you can confirm this in the table at the bottom of the screen. Tap any service record to open the Service Dashboard for that service.
Services and Environments Menu
You can access a list of all your organization's Managed Cloud Services and associated from any screen in Oracle Pulse using the menu icon in the top left corner. All services are listed with their associated environments. Tap any service or environment to the corresponding Dashboard populated with the latest metrics.
Navigation Bars at the top of each screen show options for the Landing Pad and the Customer, Service, and Environment Dashboards. By default, all dashboards display the Overview view when opened. Navigation bar options respond to the width of the screen, with options stacked to the right:
For example, use the navigation bar on the Customer Dashboard, shown above, to move between the overview, storage, recommendations, incident reports, and change reports.
The Customer Dashboard navigation bar also has several global options not available on the Service or Environment Dashboards. Contacts displays records for all those involved in providing and managing your organization's Managed Cloud Services. Recommendations shows all proposed changes and actions across all your organization's Managed Cloud Services. Finally, Notifications shows all active and historical messages from Oracle about your organization's Managed Cloud Services.
By default, options on the right of the navigation bar are displayed in a vertical list. This improves the rendering of dashboards on smaller screens. Use the arrow at the right end of the navigation bar to show options in the vertical list and to return to the default navigation bar display.
The following table shows the icons with descriptions:
| Icon | Name | Description |
|---|---|---|
| Home | Click the Home icon to return to the Landing Pad, which is the Oracle Pulse home screen. | |
| Menu | Click the Menu icon to open a list of all your organization's Managed Cloud Services and associated environments | |
| Settings | Click the Settings icon to sign on or out of Oracle Pulse, or to view help. | |
| Other Actions | Click the Other Actions icon to perform the following actions:
(iPad only):
(Web Browser only):
|
|
| Data View | Click the Data View icon in any widget to flip to the data used to create the chart. |
E-mailing Screens and Other Actions
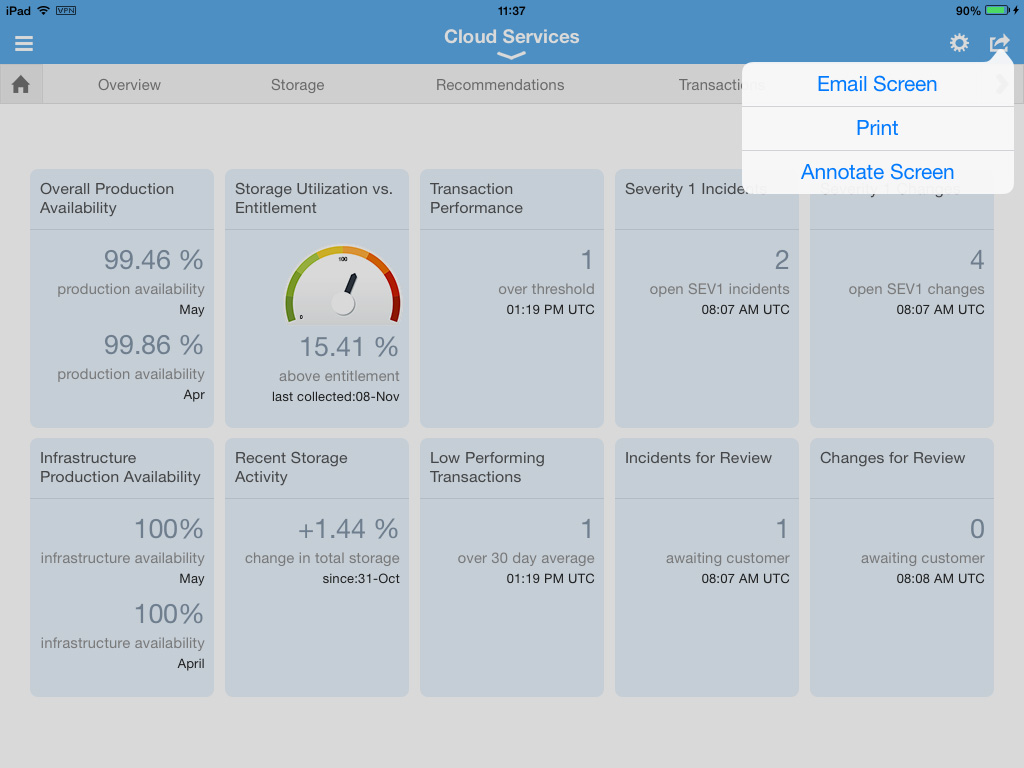
The Other Actions list in the top right of Oracle Pulse provides a number of options depending on where it is accessed.
iPad provides additional options under Other Actions to help streamline communication of Oracle Pulse information and to request additional storage, backups, and refreshes.
In any screen, tap Email Screen in the Other Actions list on the top right to e-mail the contents of the screen. You can save or delete the draft created. In the data view of any widget, an additional Email Report option provides the ability to e-mail the data used to create the view.
Use Annotate Screen to attach notes to the current screen before e-mailing or select Print to send the current screen to one of the printers set up on your device. Setting up printers is specific to a device, and you should refer to the local settings or help to enable printing.
On supported Web browsers, you can request further services by e-mail using the Other Actions icon on the Service Dashboard.
In any screen, tap Email in the Other Actions list on the top right to e-mail the contents of the screen. You can save or delete the draft created. In the data view of any widget, an additional Email Report option provides the ability to e-mail the data used to create the view.
Under the Refresh option, Other Actions select Request Refresh to submit a request for a refresh by e-mail. Similarly, you can send an e-mail requesting additional backups using Request Additional Backups on the Backup screen or ask for additional storage using the Request Additional Storage on the Storage screen.
Finally, select Request Additional Services option to submit a request to extend your current offering.