6 Metrics and Reports for the Sybase ASE Plug-in
This chapter provides details of the reports gathered by the Sybase ASE plug-in.
The following sections are provided:
6.1 Using the Sybase ASE Plug-in Reports
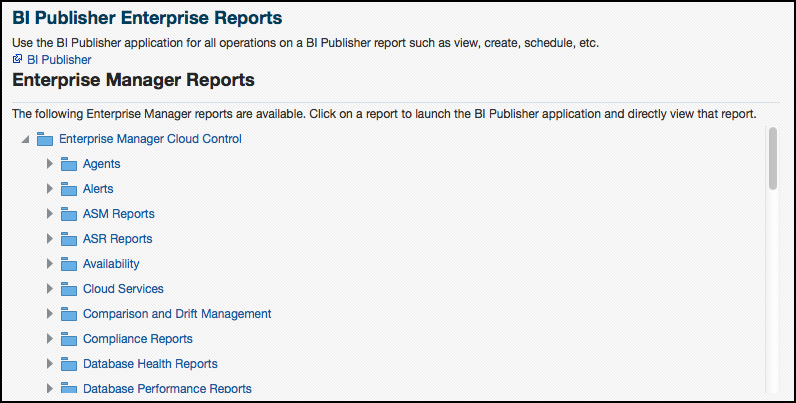
To further aid administrators with critical tasks such as problem diagnosis, trend analysis and capacity planning, the Sybase ASE Database plug-in includes 17 out-of-box reports (Figure 6-1):
Follow the steps listed below to generate a new report from one of the out-of-the-box reports provided by Oracle:
-
From the Enterprise menu, select Reports, then BI Publisher Enterprise Reports as shown in Figure 6-2:
-
Scroll down to the Sybase ASE section, find the desired report, and click the report title hyperlink.
-
After the reports have been sorted to Sybase ASE reports only, find the desired report and click on the report title hyperlink. Figure 6-3 shows an example of a report:
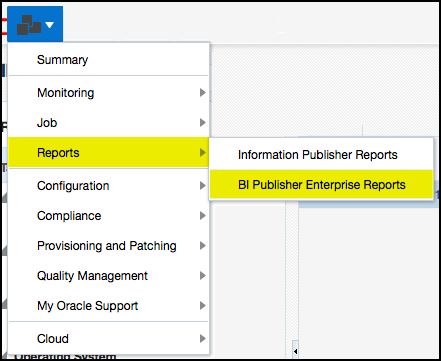
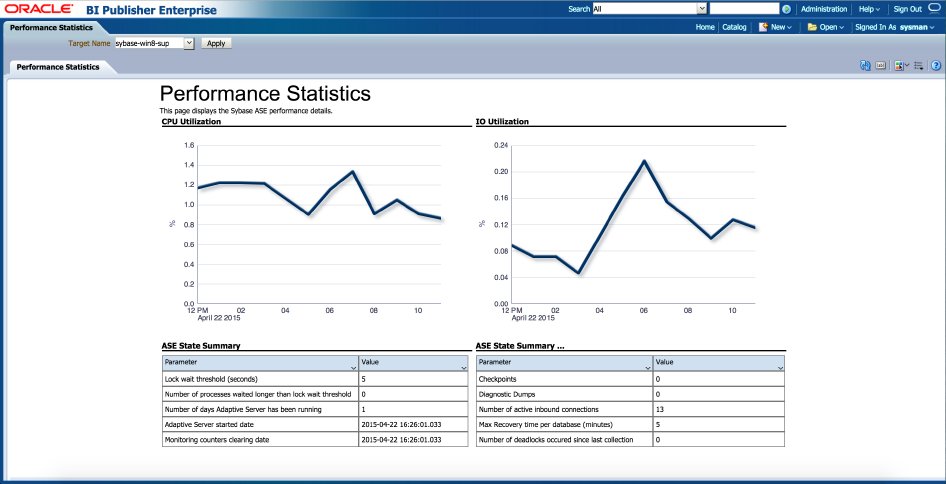
Table 6-1 shows the BI Publisher Enterprise Reports provided by Oracle:
Table 6-1 Sybase ASE Plug-in Reports
| Report Name | Report Description |
|---|---|
|
Sybase ASE Engines Statistics |
Displays Sybase ASE Engines related information. |
|
Sybase ASE Configuration |
Displays Sybase ASE Configuration Information. |
|
Sybase ASE Data Cache Statistics |
Displays Data Cache related information. |
|
Sybase ASE Database Log Statistics |
Displays Database log related information. |
|
Sybase ASE Databases Space Statistics |
Displays Databases Space related information. |
|
Sybase ASE Device IO Statistics |
Displays Device IO related information. |
|
Sybase ASE Procedure Cache Statistics |
Displays Procedure Cache related information. |
|
Sybase ASE Deadlock Statistics |
Displays the deadlock statistics for Sybase ASE. |
|
Sybase ASE Error Statistics |
Displays the error statistics for Sybase ASE. |
|
Sybase ASE Open Objects Statistics |
Displays the Open Objects Buffer and Page Read/Write statistics for Sybase ASE. |
|
Sybase ASE Process Statistics |
Displays the process statistics for Sybase ASE. |
|
Sybase ASE SQL Statistics |
Displays the SQL statistics for Sybase ASE. |
|
Sybase ASE User Statistics |
Displays the user statistics for Sybase ASE. |
|
Sybase ASE Network IO Monitoring Report |
Displays Network Monitoring Statistics Report. |
|
Sybase ASE Performance Statistics |
Displays Sybase ASE performance related information. |
|
Sybase ASE Transaction Log Statistics |
Displays Transaction log related information. |
|
Sybase ASE Worker Threads Statistics |
Displays Sybase ASE worker threads related information. |
6.2 Deploying Reports After BI Publisher is Configured
If the Sybase ASE plug-in is deployed or upgraded after BI Publisher is already configured and the reports were not deployed automatically, then execute the following command:
emcli deploy_bipublisher_reports -pluginid="oracle.em.ssad" -pluginversion="12.1.0.4.0" -force
6.3 Complete List of Plug-in Metrics
For a complete list of all the metrics contained in this plug-in, see the Oracle Enterprise Metric Guide:
http://docs.oracle.com/cd/E24628_01/em.121/e51915/toc.htm
6.4 Using the Sybase ASE Plug-in Monitoring Templates
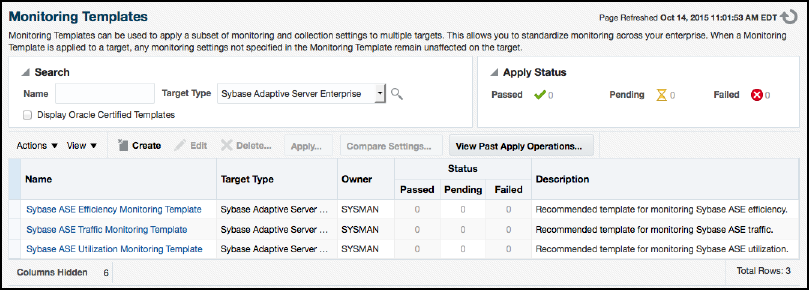
To view the out-of-box templates, from the Enterprise menu, select Monitoring and then Monitoring Templates. Using the Target Type drop down, select Sybase Adaptive Server Enterprise and press the arrow button.
A complete list of all out-of-box monitoring templates will be available for use as follows (also, see Figure 6-4):
-
Sybase ASE Efficiency Monitoring Template: Recommended template for monitoring Sybase ASE efficiency.
-
Sybase ASE Traffic Monitoring Template: Recommended template for monitoring Sybase ASE traffic.
-
Sybase ASE Utilization Monitoring Template: Recommended template for monitoring Sybase ASE utilization.
To apply a monitoring template to a Sybase ASE target, perform the following actions:
-
Click the desired monitoring template to select it.
-
Click Actions and select Apply.
-
Choose to either replace or override existing thresholds with the Apply Options radial button.
-
Click Add to add the Sybase ASE Targets to apply the template to. Follow the prompts through the target Search and Select Targets screen.
-
Click Ok and a confirmation message will appear at the top of the page notifying of a successful application.
The Actions button found on the Monitoring Templates screen will also give access to setting a selected template as "Default" for all new Sybase ASE Target deployments, or Edit an existing template's threshold values.
Refer to the "Using Monitoring Templates" section in the Oracle Enterprise Manger Cloud Control Administrator's Guide for more information on how to use Monitoring Templates in Enterprise Manager Cloud Control 13c:
https://docs.oracle.com/cd/E24628_01/doc.121/e24473/mon_temp.htm#EMADM12262