| Exit Print View | |
Java Platform Micro Edition Software Development Kit Version 3.0 |

|
Viewing and Editing Project Properties
Running Projects in the Emulator
Searching the WURFL Device Database
Finding Files in the Multiple User Environment
Saving Customized Snapshots and Images
CLDC Emulation on a Windows Mobile Device
Installing CLDC Emulation on a Windows Mobile Emulator
JSR 82: Bluetooth and OBEX Support
JSR 135: Mobile Media API Support
JSR 177: Smart Card Security (SATSA)
JSRs 184, 226, and 239: Graphics Capabilities
JSR 205: Wireless Messaging API (WMA) Support
JSR 211: Content Handler API (CHAPI)
JSR 238: Mobile Internationalization API (MIA)
Follow these steps to enable data collection:
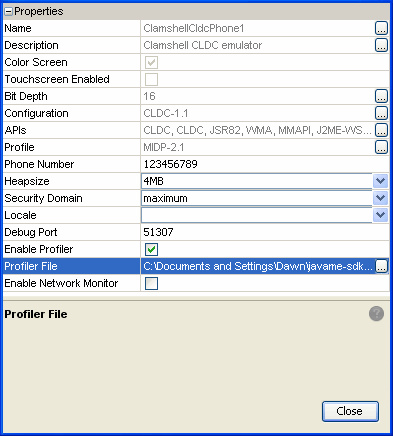
In the Device Selector window, right-click on a device and choose Properties.
Check the Enable Profiler option, and note the location of the profiler output file.
You can also edit the device.properties file to set profiler.enabled to true. The properties file is located in the device instance directory, as described in /javame-sdk/3.0/work. The device number corresponds to a device in the device selector, as discussed in Table 1.

Note - It’s helpful to display the output window. If it’s not open, select Window > Output > Output.
Start your application.
Interact with your application as you normally would.
In the emulator, select Application > Exit.
The profile data snapshot is saved, and the SDK reports the location of the profile data in the Output window. The profile data is displayed in a tab labeled CPU:time, where time is the time the snapshot was saved.