| C H A P T E R 6 |
|
Interpreting Benchmark Statistics |
The test manager information pane displays benchmark information in the Benchmark Results tabbed pane. Different types of tests return different statistics. Test runs that have corresponding threshold values show the values produced by both the test device and the reference device (as possibly edited by an administrator).
This chapter describes benchmark results in the following sections:
For information on running benchmark tests and the Benchmark Results tabbed pane, see the online help.
Most benchmark tests measure Unit Rate. A Unit Rate test measures the rate at which an important and ongoing unit of work, such as displaying a frame of animation, is completed. A Unit Rate test runs for one minute. Every 100 milliseconds, it records the number of operations completed in the last 100 milliseconds. The result is an array of 600 samples, one for each of the 100-millisecond intervals in one minute.
FIGURE 6-1 shows an example of Unit Rate results when a test is run in a session whose profile has no corresponding threshold value. In this example, the Unit Rate is animation frames per second.
FIGURE 6-1 Unit Rate Performance Statistics in Benchmark Results Tab

The test returns the array to the harness. Ignoring the first 150 samples, which are subject to warm-up effects such as optimization and class loading, the harness computes and displays the following for the remaining 450 samples:
When a threshold file exists for the same test, the Benchmark Results tab shows both the test result and the threshold value (the result produced by the reference device, possibly as edited by an administrator). FIGURE 6-2 shows an example.
FIGURE 6-2 Example Benchmark Results Tab with Threshold

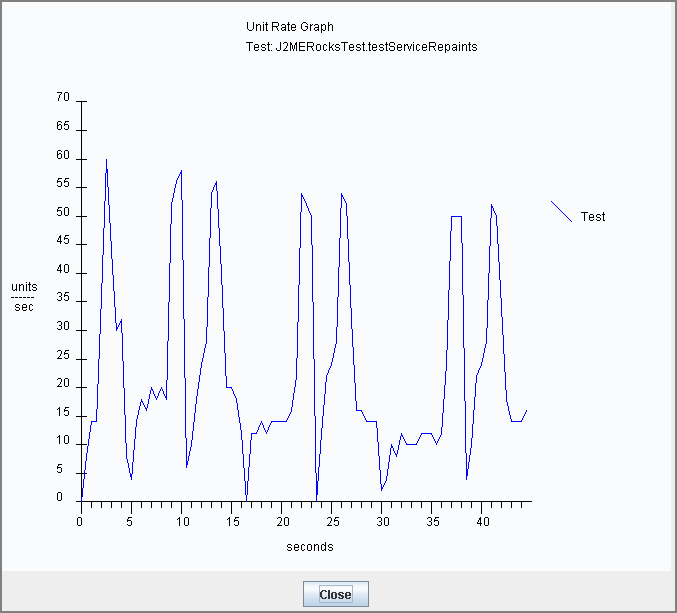
Click the View Graph button below the statistics table to display the test’s second-by-second performance. FIGURE 6-3 shows an example.
FIGURE 6-3 Example Unit Rate Performance Graph

The graphs of Unit Rate tests for an implementation that passes or fails (based on existing threshold values) compare the performance of the test device to the threshold. FIGURE 6-4 is an example of a passing test’s performance graph. The graph does not explicitly show why the implementation passed, but gives insight into its second-by-second performance compared to the performance of the reference device (as possibly adjusted by an administrator) on which the threshold is based. You can see that the test device’s performance (Test line) is generally above the threshold. For an explanation of the pass or fail calculation, see Pass or Fail Calculation.
FIGURE 6-4 Example Passing Performance Graph

FIGURE 6-5 shows an example graph from an implementation that failed. Notice that the test device’s performance (Test line) is generally lower than the threshold line.
FIGURE 6-5 Example Failing Performance Graph

System Load tests measure an artificial representation of the load they place on the test device. Lower values are better. If a System Load test has a threshold value, the Test Run Details tab shows both the value returned by the test device and the value returned by the reference device (as possibly edited by an administrator). FIGURE 6-6 shows an example measurement. System Load tests do not have performance graphs.
FIGURE 6-6 Example System Load Information in Test Run Details Tab

A System Load test measures how much of the device’s ability to do concurrent work remains while the test is running. A System Load test compares the work accomplished by a test-independent thread first running by itself and then in competition with the test. The object is to determine how much the test degrades the performance of the independent thread. The test performs time-constant operations such as playing a video file. Because the video frames must be displayed at a protocol-determined rate, the test performs the same number of operations per unit of time whether it runs on a fast device or a slow one. System Load tests automatically run multiple times and return the average System Load. The harness displays this average.
If a benchmark test has a corresponding threshold (in the work directory), the harness uses it to determine if the test passes or fails. The calculation is different for System Load and Unit Rate tests.
If the test’s System Load value is less than or equal to the threshold value plus a small buffer, the test passes. Otherwise it fails.
The Unit Rate pass or fail calculation compares the sample arrays produced by the test device and the reference device (as possibly modified by an administrator). The calculation has two phases. In both phases, the first 150 (of 600) samples in the arrays are ignored because they are subject to warm-up effects such as optimization.
In the first phase, the harness attempts to determine if the test device is in fact the reference device. Running a reference device against itself should produce a passing result, even if the arrays are not identical. This phase compares the average and variance of the two arrays. If they are both close, the test passes.
The second phase is only executed for a test device that the harness judges is not the reference device. In this phase, the harness uses a statistical technique called the Sign Test to determine if the test sample is significantly worse (in the statistical sense) than the threshold array. If the test sample is significantly worse, the test fails. Otherwise, it passes.