35 Monitoring BPMN Process Service Components and Engines
This chapter includes the following sections:
-
Viewing the Audit Trail and Process Flow of a BPMN Process Service Component
-
Monitoring BPMN Process Service Engine Performance Statistics
For more information, see the following sections:
35.1 Viewing the Audit Trail and Process Flow of a BPMN Process Service Component
This section describes how to view the audit trail and process flow of a BPMN process service component in a business flow instance.
Note:
-
This section assumes a business flow instance has been initiated. If not, see Initiating a Test Instance of a Business Flow for instructions.
-
When several messages are thrown in a short interval, they are not processed in the same order as they were sent. This can be apparent when you are examining the audit trail of a process instance.
To view the audit trail and process flow of a BPMN process service component:
-
Access this page through one of the following options:
From the SOA Infrastructure Menu... From the SOA Folder in the Navigator... -
Select Home > Deployed Composites
-
In the Composite section, select a specific SOA composite application.
-
Under soa-infra, select a specific SOA composite application.
The Dashboard page for the selected composite application appears.
-
-
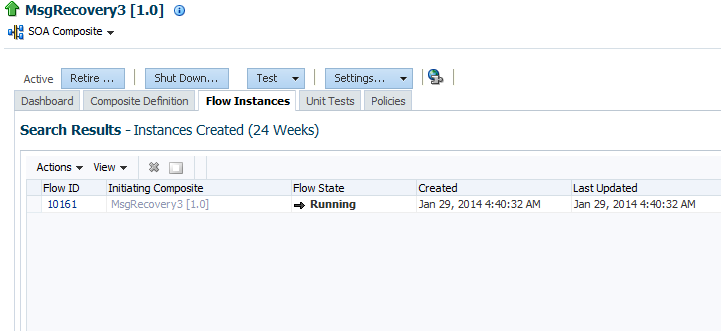
Click the Flow Instances tab.
Use one of the following methods to select an instance of the application:
-
For recent instances of this application, click the Recent Instances link.
-
For instances with faults, click the Instances With Faults link.
-
For recoverable instances, click the Recoverable Instances link.
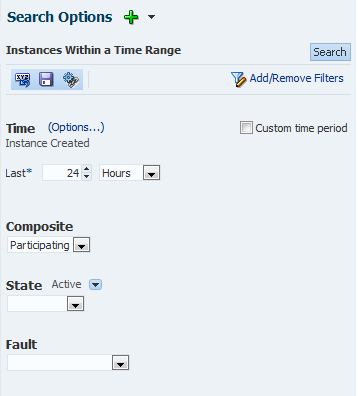
A Search page appears.
Enter your search criteria and click Search to display a list of instances.
-
-
Highlight the required instance and click Show Details to display additional information about the instance in a table containing the following tabs:
-
The Faults tab shows the faults occurring in the services, service components, and references that comprise the SOA composite application. Information includes, Error Name, Fault Name, Fault Owner, Fault Time, Recovery, and so on. Use the View option to select the columns to display.
-
The Composite Sensor Values tab displays details about composite sensors included in the service and reference binding components of the SOA composite application. Composite sensors can be added to service and reference binding components during design time in Oracle JDeveloper. You cannot add composite sensors to service components.
-
The Composites tab shows the sequence of the composites through the flow.
-
-
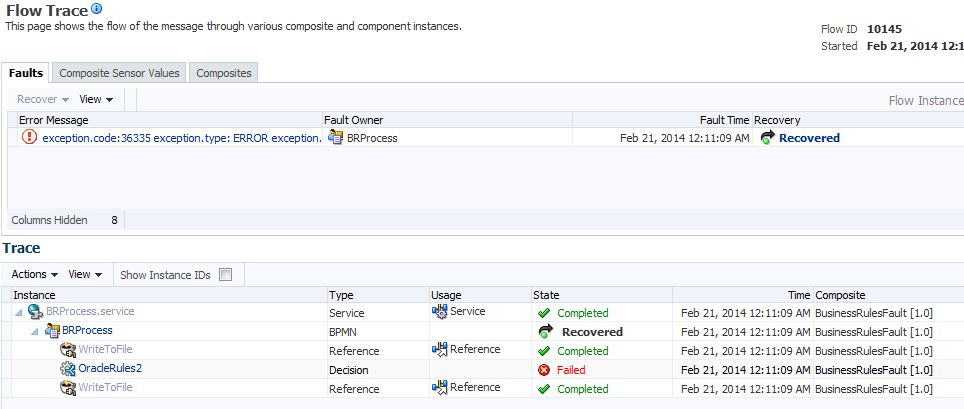
Click the Flow ID of the selected instance to display the Flow Trace page.
The flow trace is a runtime trail of a message flow identified by a Flow ID that is displayed in the upper right corner of the page. The Flow ID enables you to track a message flow that crosses instances of different composites. The flow trace lists all services, references, components across composites participating in the flow.
For the flow example in the Trace section, the service binding component and reference binding component involved in the flow have successfully received and processed messages.
-
Select a fault in the Faults section.
This highlights the row in the Trace section in which the fault occurred.
-
Close the fault to clear the selection in the Trace section.
-
Expand the Composite Sensor Values tab to display composite sensors.
-
Select a sensor in the Composite Sensor Values tab.
This highlights the row in the Trace section in which the composite sensor data was collected.
-
In the Instance column of the Trace section, click a specific BPMN process service component instance. Service component instances can be accessed from this section; services and references cannot be accessed.
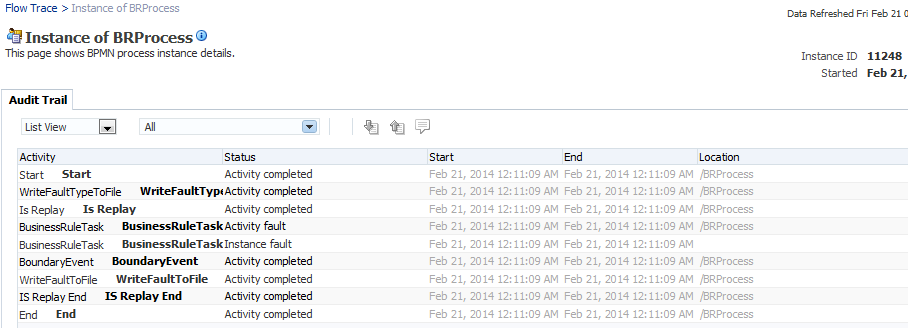
The Instance page appears.
Use these pages to view the audit trail, flow and faults of a BPMN process service component instance. The following links provide additional details about the instance:
-
Flow Trace link: Click the breadcrumbs in the upper left corner of the page to access the flow trace for the business flow instance that contains this BPMN component instance.
-
Information icon: Click the information icon to the right of the name of the BPMN component (in the page title) to see biographical information about this BPMN instance. This information includes a summary of the instance, including instance ID, instance startup time or last modification time, instance state (for example, running), and number of faults.
This icon is displayed only on the Audit Trail pages of BPMN processes and Oracle Mediators, and not on the pages of human tasks and business rules.
When you first open the Instance page, the Audit Trail process instance details are displayed in a table by default. It provides execution details about the activities in the BPMN process. You can use the drop down to view the details as a list, tree, or graphical view. If you choose to view by list, you can also choose the types of processes to view. You can select All, Human Activities, Service Activities, Business Rules Activities, Sub-processes, Events, Gateways, Script Activities and Other Activities.
The List table includes the following information:
Column Description Activity
Lists all the BPM constructs available in a process in the order they are executed. These include:
-
Events: start, end, signal, throw, catch message.
-
Activities: user task, business rules task, service task, call activity, subprocess.
-
Gateways: inclusive, exclusive, parallel, event based, and complex.
Status
Displays the status of the activity, such as Instance Suspended, Instance Fault, Activity Fault, Activity Completed, and so on.
Start
Time stamp showing when the activity started.
End
Time stamp showing when the activity ended.
Location
Shows the location of the activity.
-
You can also view Audit Trail in Tree View. When you view Audit Trail in a tree view, both interrupting and non-interrupting timers appear in the tree structure. If it is an interrupting timer, the due date appears on the node that is going to be interrupted at expiration.
| Timer Scheduling Type | Non-Interrupting | Interrupting |
|---|---|---|
|
Event Sub-process |
Timer scheduling node appears at the process or sub process level that this timer could be trigger. |
Due Date is set to the node that can be closed if that timer is fired. |
|
Boundary Timer |
Timer scheduling node appears at the activity or sub process level that this timer is bounded to. |
Due Date is propagated to the node that can be closed, cancelled if this timer is fired. |
|
Intermediate Timer |
FLOW_NODE_IN event represents scheduling and FLOW_NODE_OUT finishing. |
No due date is propagated. |
35.2 Monitoring BPMN Process Service Engine Performance Statistics
You can monitor pending and active requests as well as thread performance statistics for all BPMN process service components running in the service engine.
To monitor BPMN process service engine requests and thread statistics:
-
Access this page through one of the following options:
From the SOA Infrastructure Menu... From the SOA Folder in the Navigator... -
Select Service Engines > BPMN.
-
Right-click soa-infra.
-
Select Service Engines > BPMN.
-
-
Click the Statistics tab.
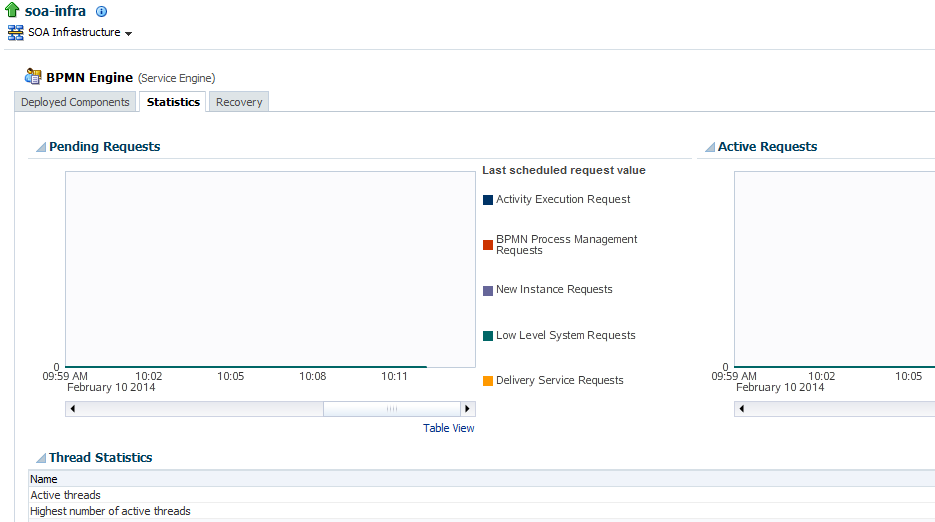
The Statistics page displays the following details.
-
Pending requests in the service engine. Use this graph to view backlogged requests waiting to be fulfilled.
-
Active requests in the service engine. Use this graph to get an idea of the current service engine load. Most requests are processed instantaneously so only under extreme load conditions should there be data shown in the graph.
-
Thread statistics for the service engine. Use this table to view details about thread performance in the BPMN process service engine. Details include the number of threads used for the performance category (for example, number of active threads, highest number of active threads, and so on).
For more information about BPMN process tuning and performance properties, see Tuning Performance.
-
35.3 Monitoring Deployed BPMN Processes in the Service Engine
You can monitor all deployed SOA composite applications with BPMN process service components running in the service engine.
Note:
Subtasks are not listed in the Oracle Enterprise Manager Fusion Middleware Control.
To monitor deployed BPMN processes in service engines:
-
Access this page through one of the following options:
From the SOA Infrastructure Menu... From the SOA Folder in the Navigator... -
Select Service Engines > BPMN.
-
Right-click soa-infra.
-
Select Service Engines > BPMN.
-
-
Click the Deployed Components tab.
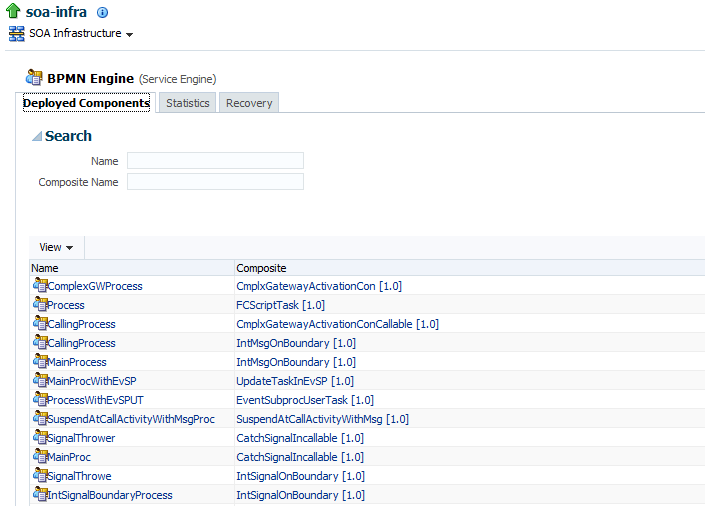
The Deployed Components page displays the following details:
-
A utility for searching for a specific deployed SOA composite application by specifying criteria and clicking Search.
-
Details about deployed SOA composite applications with BPMN process service components running in this service engine, including the service component name, the SOA composite application, and the current status.
To access the home page of a specific service component, click the specific service component in the Name column.
To access the home page of a specific SOA composite application, click the specific SOA composite application in the Composite column.
-
