Changing Data Blending
If your project includes data from two data sources that contain a mixture of attributes and values, and there are match values in one source that do not exist in the other, then sometimes the system could omit rows of data that you may want to see.
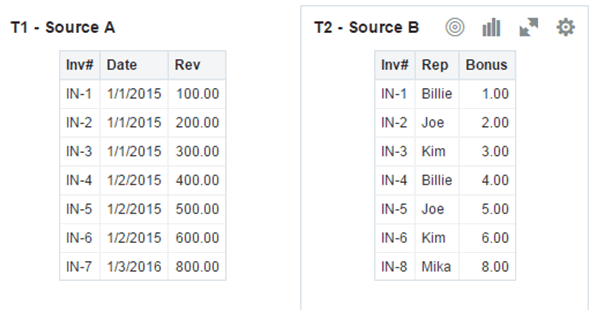
For example, we have two data sources (Source A and Source B), which include the following rows. Note that Source A does not include IN-8 and Source B does not include IN-7.

Description of the illustration GUID-E59DBD51-1745-4319-A8CA-0C009E177897-default.gif
The following results display if the All Rows data blending option is selected for Source A and the Matching Rows data blending option is selected for Source B. Because IN-7 does not exist in Source B, the results contain null Rep and null Bonus.

Description of the illustration GUID-1C542D71-9750-490B-98E6-809A8FC7E71E-default.gif
The following results display if the Matching Rows data blending option is selected for Source A and the All Rows data blending option is selected for Source B. Because IN-8 does not exist in Source A, the results contain null Date and null Revenue.

Description of the illustration GUID-1F6068C4-1AD8-4EDD-80F0-C9EC8F8FB795-default.gif
The visualization for Source A includes Date as an attribute, and Source B includes Rep as an attribute, and the match column is Inv#. Under dimensional rules, these attributes cannot be used with a measure from the opposite table unless the match column is also used.
There are two settings for blending tables that contain both attributes and measures. These are set independently in each visualization based on the what columns are used in the visualization. The settings are All Rows and Matching Rows and these describe what rows from a source the system will use when returning data to be visualized.
The system auto assigns data blending according to the following rules:
-
If a match column is in the visualization, then the sources with the match column are set to All Rows.
-
If an attribute is in the visualization, its source is set to All Rows and the other sources are set to Matching Rows.
-
If multiple attributes are in the visualization and all come from the same source, that source is set to All Rows and the other sources are set to Matching Rows.
-
If attributes come from multiple sources, then the source listed first in the project's elements panel is set to All Rows and the other sources are set to Matching Rows.
To change data blending:
- Select a visualization on the canvas, and in the visualization toolbar click Menu and the click Properties.
- In the Properties dialog, click Data Sets.
- In the Data Sets tab, click the Auto link and then select Custom to view how the system determined blending.
- Adjust the blending settings as necessary.
- At least one source needs to be assigned to All Rows.
- If both sources are All Rows, then the system assumes that the tables are purely dimensional.
- You cannot assign both sources to Matching Rows.