3 Adding Your Own Data
You can add your own data for analysis and exploration.
Topics
Typical Workflow for Adding Data from Data Sources
Here are the common tasks for adding data from data sources.
| Task | Description | More Information |
|---|---|---|
|
Add a connection |
Create a connection if the data source that you want to use is either Oracle Applications or a database. |
|
|
Create a data source |
Upload data from a file such as a spreadsheet. Retrieve data from Oracle Applications and from databases if the data isn’t already cached. Creating a data source from Oracle Applications or a database requires you to create a new connection or use an existing connection. |
|
|
Blend data |
Blend data from one data source with data from another data source. |
|
|
Refresh data |
Refresh data for the files when newer data is available. Or refresh the cache for Oracle Applications and databases if the data is stale. |
|
|
Extend uploaded data |
Add new columns to the data source. |
|
|
Control sharing of data sources |
Specify which users can access the data that you added. |
|
|
Remove data |
Remove data that you added. |
About Adding Your Own Data
It’s easy to add data from data sources. Adding your own data is sometimes referred to as “mash-up.”
You can add data in these ways:
-
Add data from a single source, such as a spreadsheet, to analyze on its own. Or combine a source with other sources to broaden the scope of your analysis.
-
Add your own data as an extension to an existing subject area.
You can load data to Data Visualization from a data source that is related to an existing Subject Area. You may need to identify the columns that have common values so that Data Visualization can match external and Subject Area rows appropriately. You can "Add Facts" where a table includes measures - columns that are typically summed or averaged, or you can "Extend Dimensions" where a table includes no measures.
-
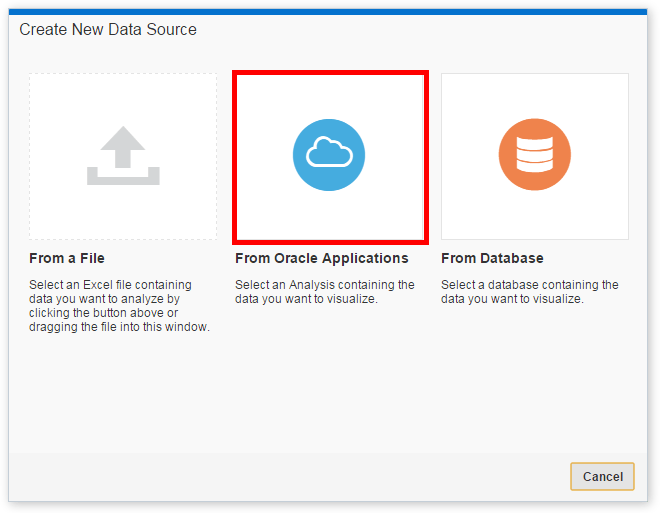
Add data from Oracle Applications data sources. See Connecting to Oracle Applications Data Sources.
-
Add data from a database. See Connecting to Database Data Sources.
Note:
You can match multiple data sources to a subject area, but you can’t match a data source to another data source.Suppose that you have a subject area that contains data about sales, such as Products, Brands, and Salespeople. You have a spreadsheet file that contains Target Revenue sales figures, which do not exist in the subject area. You’d like to create a visualization that combines Product and Brand values from the subject area with the Target Revenue figures from your spreadsheet. When you add the data, you match the Product and Brand columns from the spreadsheet with those in the subject area and add Target Revenue as a measure. The matching connects the spreadsheet with the subject area. When you drag the three columns to the canvas, Data Visualization treats the data as if it is part of one integrated system.
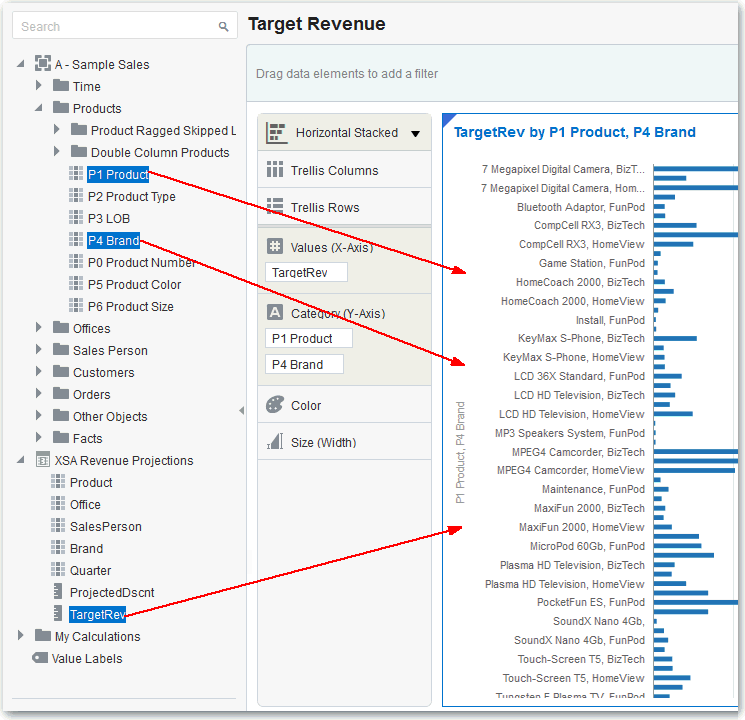
Description of the illustration GUID-3DD96001-AFBE-45BF-87E6-5ED97AEA49F9-default.gif
When you add data to projects, it uses the names and data types of the columns being added to guess the best way to blend the data for you. You can make manual adjustments if that guess is not appropriate. A data model is created as part of your workflow, and you do not need to create one explicitly. The system does the work for you, but you can make manual adjustments if you want to. See Blending Data That You Added and Changing Data Blending.
You can add the data to projects and share it with other users. You can delete the data when you need to preserve space. See Deleting Data Sources.
About Data Sources
A data source is any tabular structure. You get to see data source values after you load a file or send a query to a service that returns results (for example, another Oracle Business Intelligence system or a database).
A data source can contain any of the following:
-
Match columns: These contain values that are found in the match column of another source, which relates this source to the other (for example, Customer ID or Product ID).
-
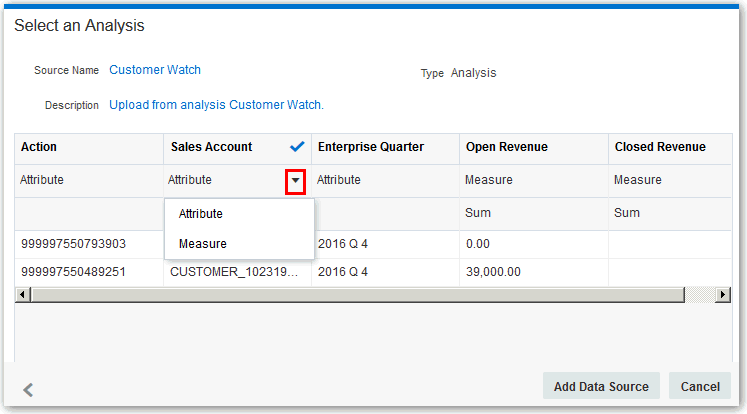
Attribute columns: These contain text, dates, or numbers that are required individually and aren’t aggregated (for example, Year, Category Country, Type, or Name).
-
Measure columns: These contain values that should be aggregated (for example, Revenue or Miles driven).
You can analyze a data source on its own, or you can analyze two or more data sources together, depending on what the data source contains.
When you save a project, the permissions are synchronized between the project and the external sources that it uses. If you share the project with other users, then the external sources are also shared with those same users.
Combining Subject Areas and Data Sources
A subject area either extends a dimension by adding attributes or extends facts by adding measures and optional attributes. Hierarchies can’t be defined in external data sources.
A subject area organizes attributes into dimensions, often with hierarchies, and a set of measures, often with complex calculations, that can be analyzed against the dimension attributes. For example, the measure net revenue by customer segment for the current quarter and the same quarter a year ago.
When you use data from an external source such as an Excel file, it adds information that is new to the subject area. For example, suppose you purchased demographic information for postal areas or credit risk information for customers and want to use this data in an analysis before adding the data to the data warehouse or an existing subject area.
Using an external source as standalone means that the data from the external source is used independently of a subject area. It’s either a single file used by itself or it’s several files used together and in both cases a subject area is not involved.
Note the following criteria to extend a dimension by adding attributes from an external data source to a subject area:
-
Matches can be made to a single dimension only.
-
The set of values in matched columns must be unique in the external data source. For example, if the data source matches on ZIP code, then ZIP codes in the external source must be unique.
-
Matches can be between one or composite columns. An example of a one column match is that product key matches product key. For composite columns, an example is that company matches company and business unit matches business unit.
-
All other columns must be attributes.
Note the following criteria for adding measures from an external data source to a subject area:
-
Matches can be made to one or more dimensions.
-
The set of values in matched columns doesn’t need to be unique in the external data source. For example, if the data source is a set of sales matched to date, customer, and product, then you can have multiple sales of a product to a customer on the same day.
-
Matches can be between one or composite columns. An example of a one column match is that product key matches product key. For composite columns, an example is that company matches company and business unit matches business unit.
A data source that adds measures can include attributes. You can use these attributes alongside the external measures and not alongside curated measures in visualizations. For example, when you add a source with the sales figures for a new business, you can match these new business sales to an existing time dimension and nothing else. The external data might include information about the products sold by this new business. You can show the sales for the existing business with those of the new business by time, but you can’t show the old business revenue by new business products, nor can you show new business revenue by old business products. You can show new business revenue by time and new business products.
Working with Sources with no Measures
Note the following if you’re working with sources with no measures.
If a table has no measures, it’s treated as a dimension. Note the following criteria for extending a dimension:
-
Matches can be between one or composite columns. An example of a one column match is that product key matches product key. For composite columns, an example is that company matches company and business unit matches business unit.
-
All other columns must be attributes.
Dimension tables can be matched to other dimensions or they can be matched to tables with measures. For example, a table with Customer attributes can be matched to a table with demographic attributes provided both dimensions have unique Customer key columns and Demographic key columns.
Working with Sources with Measures
Note the following if you are working with sources with measures.
-
You can match tables with measures to other tables with a measure, a dimension, or both.
-
When you match tables to other tables with measures, they don’t need to be at the same grain. For example, a table of daily sales can be matched to a table with sales by Quarter if the table with the daily sales also includes a Quarter column.
Working with Matching
If you use multiple sources together, then at least one match column must exist in each source. The requirements for matching are:
-
The sources contain common values (for example, Customer ID or Product ID).
-
The match must be of the same data type (for example, number with number, date with date, or text with text).
About Adding a Spreadsheet as a Data Source
Data source files from a Microsoft Excel spreadsheet file must have the XLSX extension (signifying a Microsoft Office Open XML Workbook file).
Before you can upload a Microsoft Excel file as a data source, you must structure the file in a data-oriented way and it mustn‘t contain pivoted data. Note the following rules for Excel tables:
-
Tables must start in Row 1 and Column 1 of the Excel file.
-
Tables must have a regular layout with no gaps or inline headings. An example of an inline heading is one that repeats itself on every page of a printed report.
-
Row 1 must contain the table’s column names. For example, Customer Given Name, Customer Surname, Year, Product Name, Amount Purchased, and so on. In this example:
-
Column 1 has customer given names.
-
Column 2 has customer surnames.
-
Column 3 has year values.
-
Column 4 has product names.
-
Column 5 has the amount each customer purchased for the named product.
-
-
The names in Row 1 must be unique. Note that if there are two columns that hold year values, then you must add a second word to one or both of the column names to make them unique. For example, if you have two columns named Year Lease, then you can rename the columns to Year Lease Starts and Year Lease Expires.
-
Rows 2 onward are the data for the table, and they can’t contain column names.
-
Data in a column must be of the same kind because it’s often processed together. For example, Amount Purchased must have only numbers (and possibly nulls), enabling it to be summed or averaged. Given Name and Surname must be text as they might be concatenated, and you may need to split dates into their months, quarters, or years.
-
Data must be at the same granularity. A table can’t contain both aggregations and details for those aggregations. For example, if you have a sales table at the granularity of Customer, Product, and Year, and contains the sum of Amount Purchased for each Product by each Customer by Year. In this case, you wouldn’t include Invoice level details or a Daily Summary in the same table, as the sum of Amount Purchased wouldn’t be calculated correctly. If you have to analyze at invoice level, day level, and month level, then you can do either of the following:
-
Have a table of invoice details: Invoice Number, Invoice Date, Customer, Product, and Amount Purchased. You can roll these up to day or month or quarter.
-
Have multiple tables, one at each granular level (invoice, day, month, quarter, and year).
-
Connecting to Oracle Applications Data Sources
You can connect to Oracle Applications and create data sources that help you visualize, explore, and understand your Oracle Applications data.
Creating Oracle Applications Connections
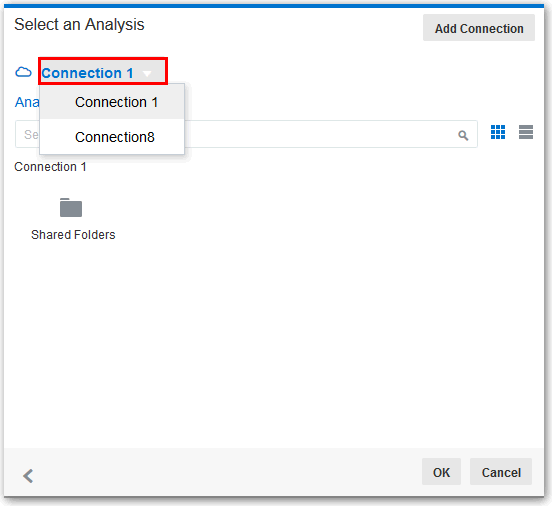
You can create connections to Oracle Applications and use those connections to create data sources.
Note:
The connection is visible only to you (the creator), but you can create and share data sources for it.Composing Data Sources from Oracle Applications Connections
After you create Oracle Applications connections, you can use those connections to create data sources to use in projects.
You must create the Oracle Applications connection before you can create a data source for it. See Creating Connections.
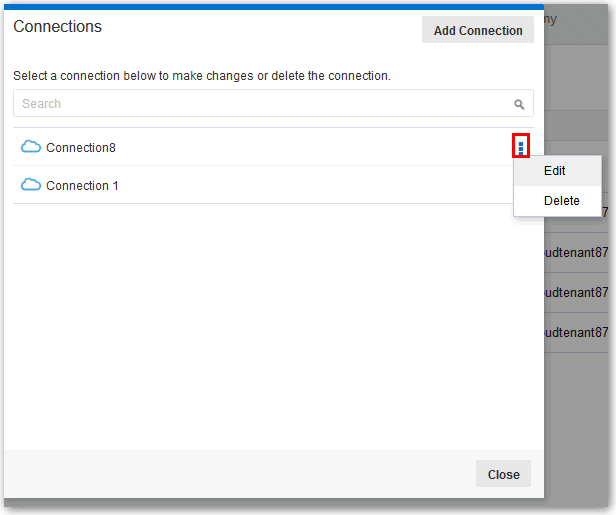
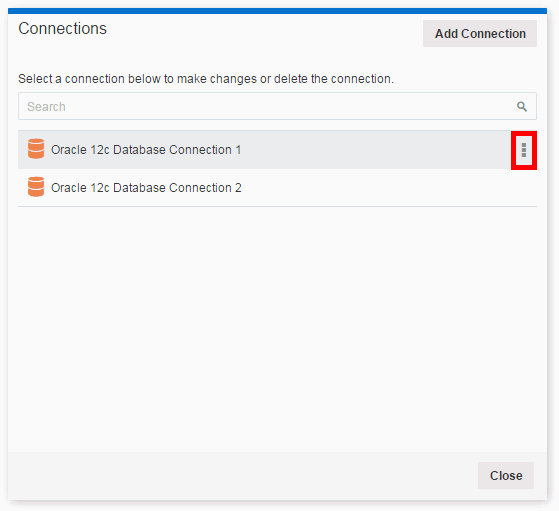
Editing Oracle Applications Connections
You can edit Oracle Applications connections. For example, you must edit a connection if your system administrator changed the Oracle Applications login credentials.
Deleting Oracle Applications Connections
You can delete an Oracle Applications connection. For example, if your list of connections contains unused connections, then you can delete them to help you keep your list organized and easy to navigate.
Note:
If the connection contains any data sources, you must delete the data sources before you can delete the connection. Oracle Applications connections are only visible to the user that creates them (connections aren’t shared), but a user can create data sources using those connections, and share the data sources with others.Connecting to Database Data Sources
You can create, edit and delete database connections, and create data sources from databases which lets you use these data sources to better understand the data using Oracle Data Visualization.
Creating Database Connections
You can create connections to databases and use those connections to source data in projects.
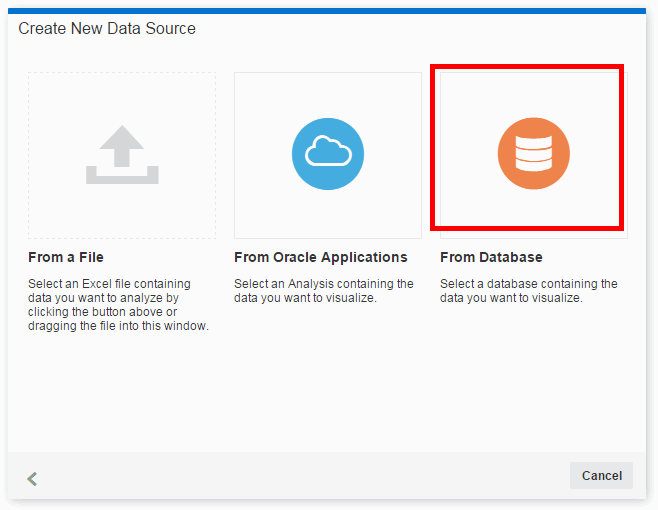
Creating Data Sources from Databases
After you create database connections, you can begin creating data sources for those connections for use in projects.
You must create the database connection before you can create a data source for it. See Creating Database Connections.
Adding Data from Data Sources
This topic covers adding data to projects.
Adding File Based Data
You use uploaded data source files such as .xlsx to create visualizations in projects.
Adding Oracle Applications Data
You can add Oracle Applications data to your projects.
- From the Home page, in the Create section, click VA Project.
- In the Add Data Source dialog, click Create a New Source.
- Select the data source that you want to use.
- Select the analysis you want to use or enter a logical SQL statement. See Composing Data Sources From Connections.
- Preview the data, and make adjustments as needed.
- Click Add to Project to accept the data associations. See Blending Data that You Added for details on manually editing data associations.
Note:
The Oracle Applications connection must be created before you add that data to projects. See Connecting to Oracle Application Data Sources.Adding Database Data
You can add database data to your projects.
- From the Home page, in the Create section, click VA Project.
- In the Add Data Source dialog, select an existing database data source, or click Create a New Source.
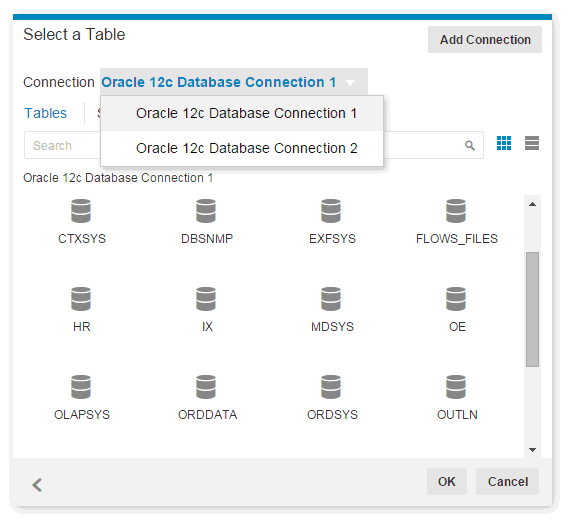
- Select the connection that you want to use.
- Select the database and table you want to use or enter a logical SQL statement. See Creating Data Sources from Databases.
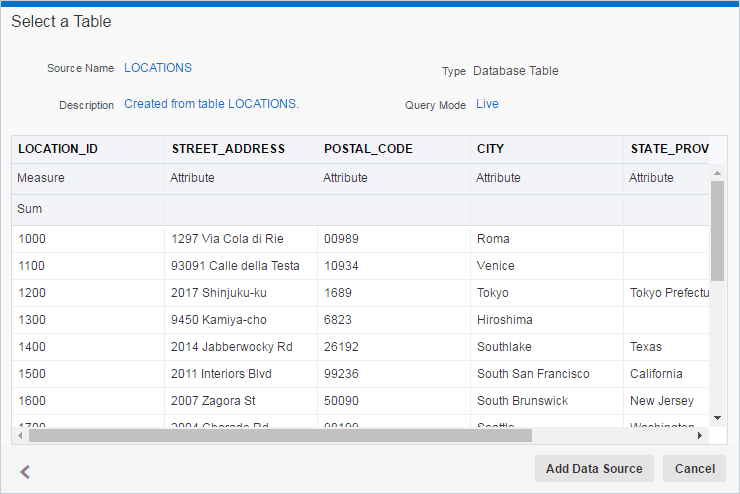
- Preview the data, and make column exclusions as needed.
- Optionally, change the Query Mode for a database table. The default is Live because database tables are typically large and shouldn’t be copied to cache. If your table is small, then choose Auto and the data is copied into the cache if possible. If you select Auto, you will have to refresh the data when it is stale.
- Click Add to Project to accept the data associations. See Blending Data that You Added.
Note:
The database connection must be created before you add that data to projects. See Creating Database Connections.Modifying Uploaded Data Sources
You can modify uploaded data sets to help you further curate (organize and integrate from various sources) data in projects. This is also sometimes referred to as data wrangling.
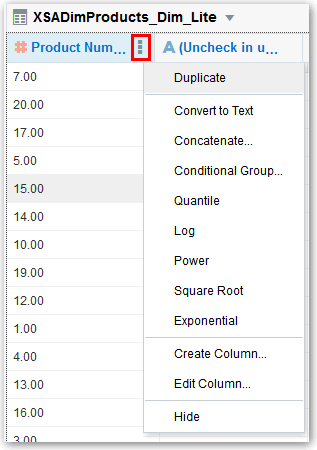
You can create new columns, edit columns, and hide and show columns for a data set. The column editing options depend on the column data type (date, strings, or numeric). Selecting an option invokes a logical SQL function that edits the current column or creates a new one in the selected data set.
For example, you can select the Convert to Text option for the Population column (number data type). It uses the formula of the Population column, and wraps it with a logical SQL function to convert the data to text and adds that newly converted data text column to the data set. Note that the original Population column isn’t altered.
Modifying data sets can be very helpful in cases where you haven’t been able to perform joins between data sources because of dirty data. You can create a column group or build your own logical SQL statement to create a new column that essentially you scrub data (amend or remove data in the database that isn’t correct in some way).
-
For a date or time column, create a year, quarter, month, or day column.
-
For an attribute column, convert a column to a number or convert it to a date. You can concatenate or replace the column. You can group or split the column. You can apply upper case, lower case, or sentence case to the data items in the column.
-
For a measure column, apply operators such as power, square root, or exponential.
Note:
When you edit a data set in this way, it affects all projects that use the data set. For example, if another user has a project that uses the data set that you modified, and they open the project after you change the data set, they see a message in their project that indicates that the data set has been modified.Blending Data That You Added
You might have a project where you added two data sources. You can blend data from one data source with data from another data source.
When you add more than one data source to a project, the system tries to find matches for the data that’s added. It automatically matches external dimensions where they share a common name and have a compatible data type with attributes in the existing data source.
You can specify how you want the system to blend your data. See Changing Data Blending.
- Add data to your project. See Adding Data from External Sources .
- In the Data Sources pane, click Source Diagram.
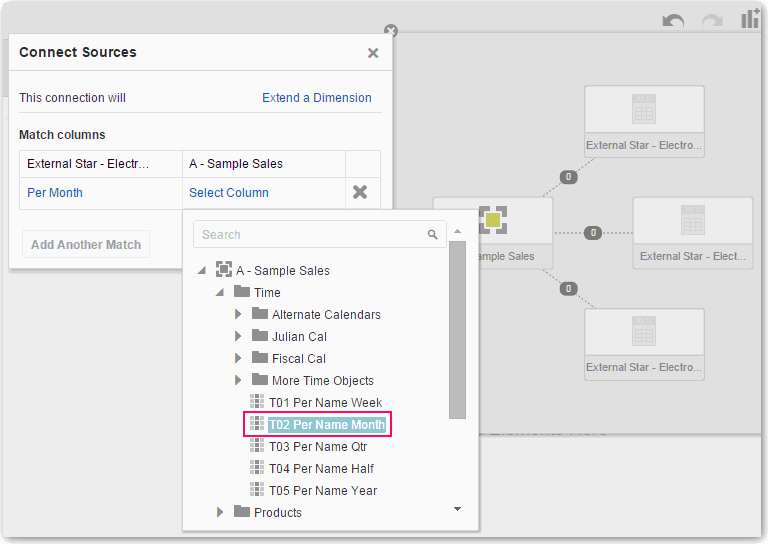
- Click the number along the line that connects the external source to the newly loaded source to display the Connect Sources dialog.
- In the Connect Sources dialog, make changes as necessary.
- Click OK to save the matches from the external source to the data model on the server.
Changing Data Blending
If your project includes data from two data sources that contain a mixture of attributes and values, and there are match values in one source that don’t exist in the other, then sometimes the system might omit rows of data that you may want to see.
For example, we have two data sources (Source A and Source B), which include the following rows. Note that Source A doesn‘t include IN-8 and Source B doesn’t include IN-7.
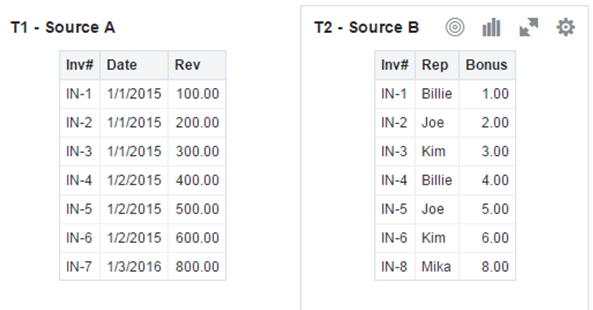
Description of the illustration GUID-E59DBD51-1745-4319-A8CA-0C009E177897-default.gif
The following results are displayed if the All Rows data blending option is selected for Source A and the Matching Rows data blending option is selected for Source B. Because IN-7 doesn’t exist in Source B, the results contain null Rep and null Bonus.

Description of the illustration GUID-1C542D71-9750-490B-98E6-809A8FC7E71E-default.gif
The following results are displayed if the Matching Rows data blending option is selected for Source A and the All Rows data blending option is selected for Source B. Because IN-8 doesn’t exist in Source A, the results contain null Date and null Revenue.

Description of the illustration GUID-1F6068C4-1AD8-4EDD-80F0-C9EC8F8FB795-default.gif
The visualization for Source A includes Date as an attribute, and Source B includes Rep as an attribute, and the match column is Inv#. Under dimensional rules, these attributes can’t be used with a measure from the opposite table unless the match column is also used.
There are two settings for blending tables that contain both attributes and measures. These are set independently in each visualization based on what columns are used in the visualization. The settings are All Rows and Matching Rows and these describe what rows from a source the system uses when returning data to be visualized.
The system automatically assigns data blending according to the following rules:
-
If a match column is in the visualization, then the sources with the match column are set to All Rows.
-
If an attribute is in the visualization, then its source is set to All Rows and the other sources are set to Matching Rows.
-
If multiple attributes are in the visualization and all come from the same source, then that source is set to All Rows and the other sources are set to Matching Rows.
-
If attributes come from multiple sources, then the source listed first in the project's elements panel is set to All Rows and the other sources are set to Matching Rows.
- Select a visualization on the canvas, and in the visualization toolbar click Menu, then click Properties.
- In the Properties dialog, click Data Sets.
- In the Data Sets tab, click Auto and then select Custom to view how the system determined blending.
- Adjust the blending settings as necessary.
- At least one source needs to be assigned to All Rows.
- If both sources are All Rows, then the system assumes that the tables are purely dimensional.
- You can’t assign both sources to Matching Rows.
Refreshing Data that You Added
After you add data, the data might change, so you must refresh the data from its source.
Note:
Rather than refresh a data source, you can replace it by loading a new data source with the same name as the existing one. However, replacing a data source can be destructive and is discouraged. Only replace a data source if you understand the consequences:
-
Replacing a data source breaks projects that use the existing data source if the old column names and data types aren’t all present in the new data source.
-
Any data wrangling (modified and new columns added in the data stage), is lost and projects using the data source are likely to break.
Databases
For databases, the SQL statement is rerun and the data is refreshed.
Excel
To refresh a Microsoft Excel file, you must ensure that the newer spreadsheet file contains a sheet with the same name as the original one. In addition, the sheet must contain the same columns that are already matched with the subject area.
Oracle Applications
You can reload data and metadata for Oracle Applications data sources, but if the Oracle Applications data source uses logical SQL, reloading data only reruns the statement, and any new columns or refreshed data won’t be pulled into the project. Any new columns come into projects as hidden so that existing projects that use the data source aren’t affected. To be able to use the new columns in projects, you must unhide them in data sources after you refresh. This behavior is the same for file-based data sources.
- In the Data Sources pane or the Subject Areas pane, locate the data source you want to refresh.
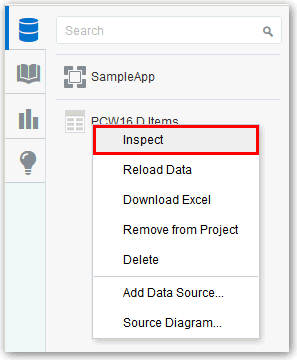
- Right-click the data source and select Reload Data. The Reload Data dialog is displayed.
- If you’re reloading a spreadsheet and the file is no longer in the same location or has been deleted, then the Reload Data dialog prompts you to locate and select a new file to reload into the data source.
- The Reload Data dialog indicates that your data was reloaded successfully. Click OK.
Updating Details of Data that You Added
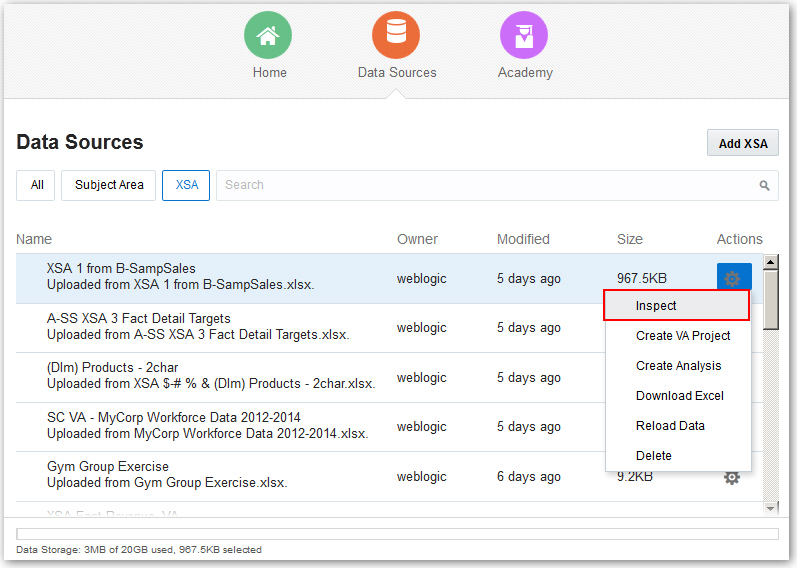
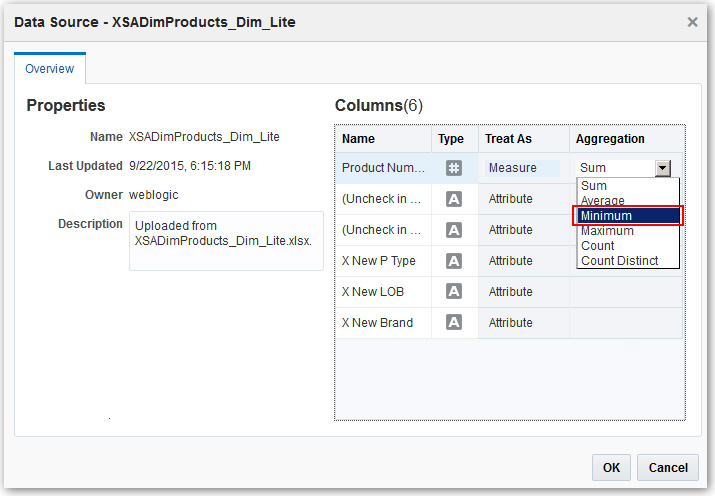
After you add data, you can inspect its properties and update details such as the description and aggregation.
Controlling Sharing of Data You Added
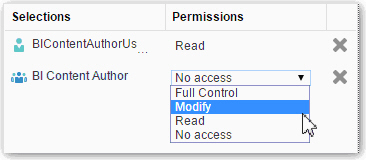
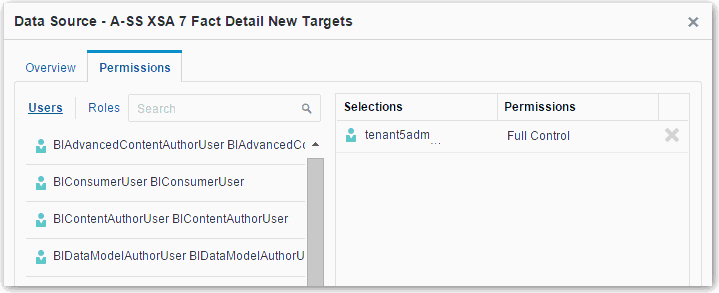
After you add data, the data is visible only to you as the user who uploaded and owns it. You as the owner or other users with appropriate permissions can specify the data as a shared resource that other users who have access to the server environment can include immediately in projects. You control which users can share the external data.
Removing Data that You Added
You can remove data that you’ve added from an external source.
- In the Data Sources pane, right-click the data that you want to remove.
- Select Remove from Project to remove data from the data sources list.
Deleting Data Sources
You can delete data sources when you need to free up space on your system.
- In the Data Sources pane in Oracle Visual Analyzer or the Subject Areas pane of Oracle Business Intelligence, right-click the data that you want to remove.
- Select Delete to erase the data from storage and delete the data source.
Managing Data Sources
You can use the Data Sources page to see all of the available data sources.
Note:
If you have Full Control permissions, you can grant permissions to others and delete uploaded data sets, but be careful not to delete a data file that is still a data source for reports. See Deleting Data that You Added.