

|
The suite of tools included in Oracle JRockit Mission Control are designed to monitor, manage, profile, and gain insight into problems occurring in your Java application without requiring the performance overhead normally associated with these types of tools.
This chapter serves as a generic introduction to the different versions of JRockit Mission Control. You can find more detailed information about the versions, please refer to More Information on JRockit Mission Control Versions.
This chapter contains information on these subjects:
JRockit Mission Control’s low performance overhead is a result of using data collected as part of the Oracle JRockit JVM’s normal adaptive dynamic optimization. This also eliminates the problem with the Heisenberg anomaly that can occur when tools using bytecode instrumentation alters the execution characteristics of the system. JRockit Mission Control functionality is always available on-demand and the small performance overhead is only in effect while the tools are running.
This section provides an architectural overview of all versions of JRockit Mission Control.
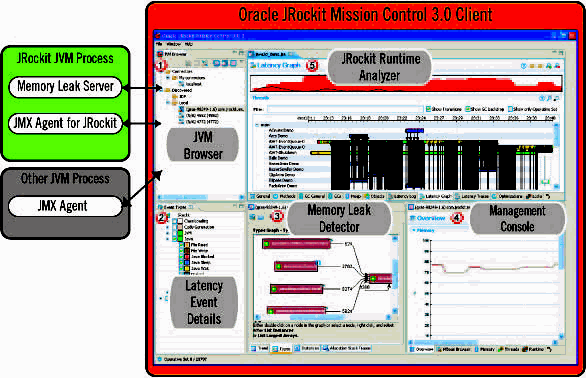
With the Rich Client Platform (RCP) based JRockit Mission Control Client, you can launch the JRockit Memory Leak Detector, the JRockit Runtime Analyzer, and the JRockit Management Console from within the JRockit Mission Control Client. Figure 18-3 depicts how the JRockit Mission Control Client looks when all tools are loaded.

When a JRA recording is started from within the JRockit Mission Control Client, it records the status of the JRockit JVM process for the time that you have specified and creates a ZIP file containing an XML file with the recorded data and optionally a binary file with latency data together with the corresponding data producer specification files. The ZIP file is automatically opened in the JRockit Runtime Analyzer (marked 5 in Figure 18-3) upon completion of the recording for JDK level 1.5 and later; for JDK 1.4.2 it is stored locally on the computer where the recorded JVM was running. Typical information that is recorded during a JRA recording is Java heap distribution, garbage collections, method samples, and lock profiling information (optional). New for the JRockit Mission Control 3.0 release, is that you can also record thread latency data. When viewing Latency data in the JRA Tool, the Latency Events Details become visible (marked 2 in Figure 18-3).
To view real-time behavior of your application and of the JRockit JVM, you can connect to an instance of the JVM and view real-time information through the JRockit Management Console (marked 4 in Figure 18-3). Typical data that you can view is thread usage, CPU usage, and memory usage. All graphs are configurable and you can both add your own attributes and redefine their respective labels. In the Management Console you can also create rules that trigger on certain events, for example sending an e-mail if the CPU load reaches 90%.
With the JMX Agent you have access to all MBeans deployed in the platform MBean server. From these MBeans, you can read attribute information, such as garbage collection durations.
To find memory leaks in your Java application, you connect the JRockit Memory Leak Detector to the running JRockit JVM process. The JRockit Memory Leak Detector connects to the JMX (RMP) Agent that instructs to start a Memory Leak server with which all further communication takes place.
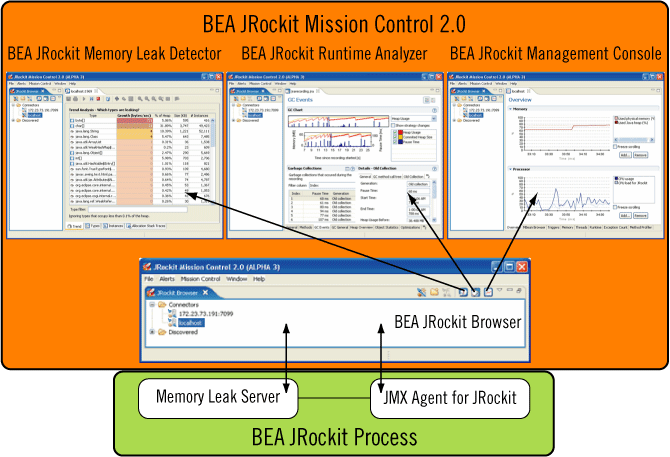
With the new Client Platform (RCP) based JRockit Mission Control Client, you can launch the JRockit Memory Leak Detector, the JRockit Runtime Analyzer, and the JRockit Management Console from within the JRockit Mission Control Client (see Figure 18-2).

Through the JMX Agent, you have access to all MBeans deployed in the platform MBean server. From these MBeans, you can read attributes information, such as garbage collection duration.
When a JRA recording is started from within the JRockit Mission Control Client, it records the status of the JRockit JVM process for the time that you have specified and creates an XML file. This file is automatically opened in the JRockit Runtime Analyzer. Typical information that is recorded during a JRA recording is Java heap distribution, garbage collections, method optimizations, and method profiling information.
To find memory leaks in your Java application, you connect the JRockit Memory Leak Detector to the running JRockit JVM process. The Memory Leak Detector connects to the JMX (RMP) Agent that instructs to start a Memory Leak server with which all further communication takes place.
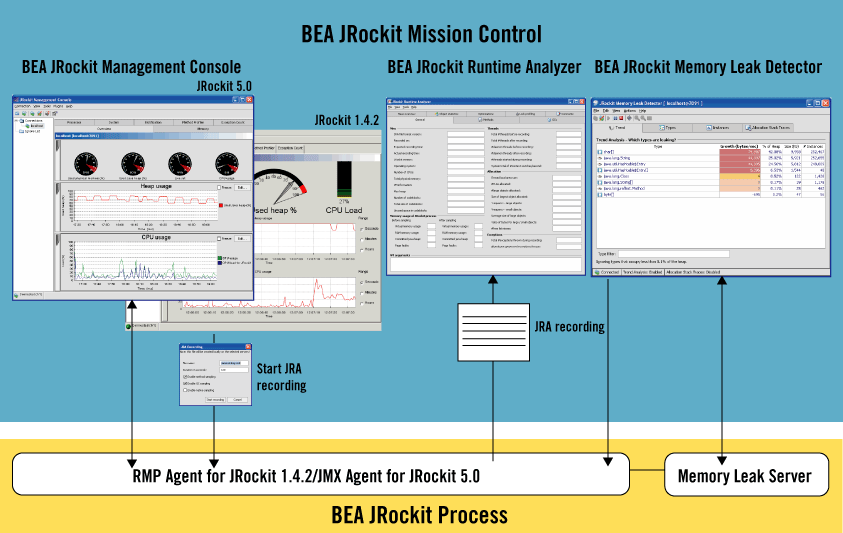
JRockit Mission Control 1.0 is available on the JRockit JDK 1.4.2 (R26.2 and later) and JRockit JDK 5.0 (R26.0 and later), see Figure 18-3. The difference between the two is the connection agent used by the JRockit Management Console and the JRockit Management Console user interface itself.
The RMP Agent (JRockit JDK 1.4.2) provides access, among other things, to live data about memory and CPU usage. With the addition of the JMX Agent (available with JRockit JDK 5.0) you will also get access to MBeans available to the platform MBean server. From these MBeans, you can read attributes information, such as garbage collection pauses.
When a JRA recording is started, for example, from the Management Console, it records the status of the JRockit JVM process for the time that you have specified. When the recording is completed, the information is saved to an XML file. This XML file can be viewed and analyzed in the JRockit Runtime Analyzer. Typical information that is recorded during a JRA recording is Java heap distribution, garbage collections, and method optimizations.
To find memory leaks in your Java application, you connect the JRockit Memory Leak Detector to the running JRockit JVM process. The Memory Leak Detector connects to the JMX (RMP) Agent that instructs to start a Memory Leak server where all further communication takes place.

The JRockit Browser is available only with JRockit Mission Control 2.0 and later versions. This tool allows you to set up and manage all running instances of the JRockit JVM on your system. From the JRockit Browser you activate recordings, set up a tree view of different JRockit JVMs to monitor, start other JRockit Mission Control tools, etc. Each JRockit JVM instance is referred to as a Connector.
The JRockit Management Console is used to monitor and manage multiple (or single) JRockit JVM instances. It captures and presents live data about memory, CPU usage, and other runtime metrics. For the Management Console that is running on JRockit JDK 5.0, information from any JMX MBean deployed in the JRockit JVM internal MBean server (JMX Agent in Figure 18-3) can be displayed as well. JVM management includes dynamic control over CPU affinity, garbage collection strategy, memory pool sizes, and more.
The JRockit Runtime Analyzer (JRA) is an on-demand “flight recorder” that produces detailed recordings about the JVM and the application it is running. The recorded profile can later be analyzed off line by using the JRA. Recorded data includes profiling of methods and locks, as well as garbage collection statistics, optimization decisions, and latency analysis (JRockit Mission Control 3.0).
The Latency Analysis Tool is a subset of the JRockit Mission Control 3.0 version of the JRA that allows you to create JRA recordings that contain latency information for your application. Latency events occur when thread execution stops temporarily, for example when a thread waits for its turn to enter a synchronized method, or waits for data from a socket. The JRA now contains three additional tabs that all show latency data from different perspectives. These tabs are prefixed Latency and named: Latency Log, Latency Graph, and Latency Traces. Together with these three tabs and two auxiliary tabs, you can activate and deactivate event types on the latency tabs and view properties.
Beginning with the JRockit JVM R27.5 and JRockit Mission Control 3.0.2, you can access three sample JRA recordings that demonstrate the features of the Latency Analysis Tool. The files are located at JROCKIT_HOME/missioncontrol/samples/jrarecordings/. They are:
pricing_server_logging_on.jra — this recording shows an application experiencing problems with latencies because several threads try to access a java.util.logging Logger.pricing_server_logging_off.jra — this file contains a recording of the same application in pricing_server_logging_on.jra, but with logging turned off.java2d_demo.jra — this recording shows how to use the
Jump-to-Source feature. It is a recording of the demo located at JROCKIT_HOME/demo/jfc/Java2D. The Java2D demo folder contains the source, allowing this recording to demonstrate Jump-to-Source.| Note: | Jump-to-Source is only available when running the JRockit Mission Control Client within Eclipse. To run the JRockit Mission Control Client within Eclipse, please install it from the update site. For more information see
dev2dev.bea.com/jrockit/tools.html. You also need to set up a Java project containing the source you wish to jump to; in this case the Java2D demo. |
You can open a sample either from within the JRockit Mission Control Client or directly from the file system, as described below:
With the JRockit Mission Control Client running, do the following:
With the JRockit Mission Control Client running and your file system (for example, Windows Explorer) open, do the following:
The JRockit Memory Leak Detector is a tool for discovering and finding the cause for memory leaks in a Java application. The JRockit Memory Leak Detector’s trend analyzer discovers slow leaks, it shows detailed heap statistics (including referring types and instances to leaking objects), allocation sites, and it provides a quick drill down to the cause of the memory leak. The Memory Leak Detector uses advanced graphical presentation techniques to make it easier to navigate and understand the sometimes complex information.
Complete information on using JRockit Mission Control is available in the respective versions documentation. Because of the difference in deployment mechanisms between JRockit Mission Control 1.0, JRockit Mission Control 2.0, and JRockit Mission Control 3.0, each version has its own set of documentation:


|