Inserting Graphs

When inserting graphs, Oracle Smart View for Office attempts to map the Oracle Business Intelligence Answers graph into a chart type supported by Microsoft Office 2007 charts. Further, Smart View attempts to match visual effects, such as 2D or 3D, and other graph properties such as canvas size, axis scale, data format, and formatting in terms of font styles and colors.

When a matching chart type is not available, the graph view can only be inserted as image.

See Supported Oracle BI EE Chart and Object Types and Unsupported Oracle BI EE Chart and Object Types.

To insert a graph:

  1. From the catalog, right-click a graph view.
  2. Select an option:
    • Insert—The selected graph is inserted as an Excel chart, which can be edited, masked, and refreshed.

      If prompts are defined for the graph in BI Answers, the Prompt Selector dialog box is displayed where you make selections on the data to display (otherwise, the graph is inserted directly). After the initial insert, you may edit the prompts by clicking the Edit Prompts icon in the Oracle BI EE ribbon. See Working with Prompts.

      If page prompts are defined for the graph (view prompts in BI Answers), you may edit them by clicking the Edit Page Prompts icon in the Oracle BI EE ribbon. See Working with Prompts for more information.

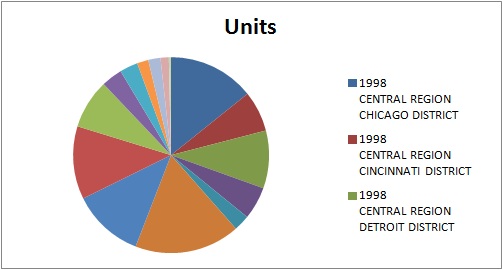
      If no prompts are defined for this analysis, then the graph is inserted directly. See Figure 19-7.

      Figure 19-7 A Pie Chart View Inserted as an Excel Chart


      An example of a pie chart view inserted as a graph.

      You can edit graphs inserted this way as described in Editing Views Created in BI Answers.

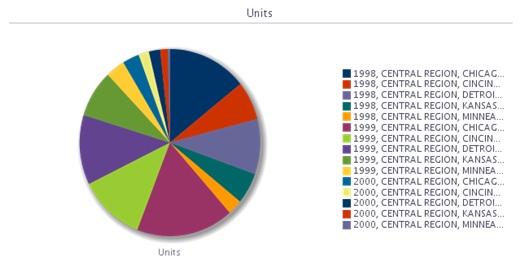
    • Insert as Image—The selected graph is inserted as an image of the graph, which cannot be edited or customized.

      When a graph is inserted directly as an image, prompts, page prompts, and sections that are defined in BI Answers are not available.

      Note that gauge and funnel objects can only be inserted using the Insert as Image command.

      Figure 19-8 A Pie Chart View Inserted as an Image


      An example of a pie chart view inserted as an image.

Once inserted, whether as an Excel chart or as an image, both types of graphs shown can be resized by stretching them.