Release 2 (8.1.6)
A76937-01
Library |
Product |
Contents |
Index |
| Oracle 8i Data Cartridge Developer's Guide Release 2 (8.1.6) A76937-01 |
|
Power Demand Cartridge Example , 2 of 8
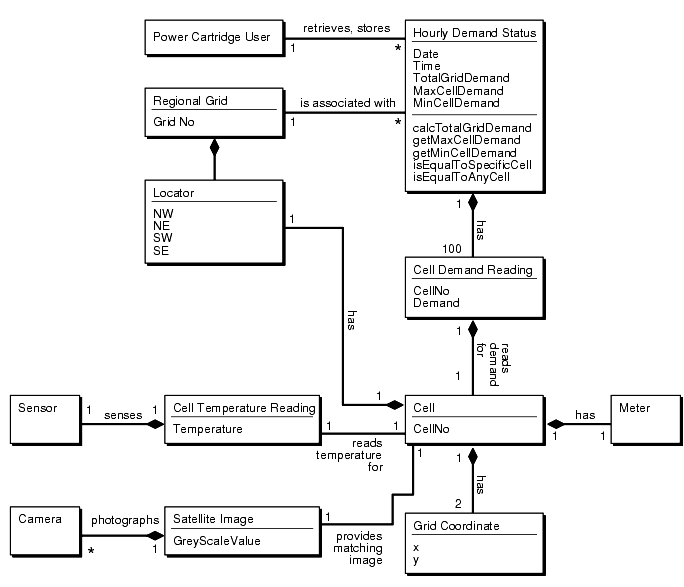
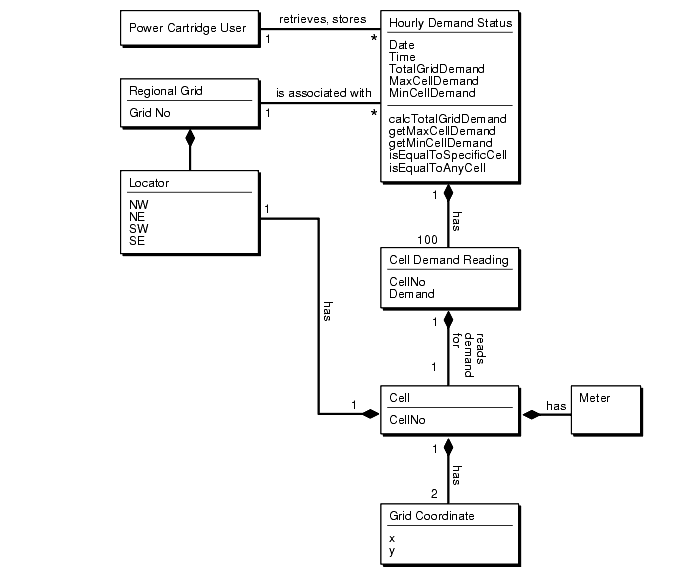
The following Class Diagram describes the application objects using the Unified Modelling Language (UML) notation.

Modelling the application in this way, makes possible the following specific queries:
These queries are, of course, only a short list of the possible information that could be gleaned from the system. For instance, it is obvious that the developer of such an application would want to build queries that are based on the information derived from prior queries e.g.,
The Power Demand cartridge as implemented is described in the class diagram below.

The utility gets ongoing reports from weather centers about current conditions and from power stations about ongoing power utilization for specific geographical areas (represented by cells on a 10x10 grid). It then compares this information to historical data in order to predict demand for power in the different geographic areas for given time periods.
Each service area for the utility is considered as a 10x10 grid of cells, where each cell's boundaries are associated with spatial coordinates (longitude/latitude). The geographical areas represented by the cells can be uniform or can have different shapes and sizes. Within the area represented by each cell, the power used by consumers in that area is recorded each hour. For example, the power demand readings for a particular hour might be represented by Table 11-2.
The numbers in each cell reflect power demand (in some unit of measurement determined by the electric utility) for the hour for that area. For example, the demand for the first cell (1,1) was 23, the demand for the second cell (1,2) was 21, and so on. The demand for the last cell (10, 10) was 32.
The utility uses this data for many monitoring and analytical applications. Readings for individual cells are monitored for unusual surges or decreases in demand. For example, the readings of 98 for (6,3) and 87 for (8,1) might be unusually high, and the readings of 19 for (4,7) and 12 for (10,4) might be unusually low. Trends are also analyzed, such as significant increases or decreases in total, per-neighborhood, and per-station demand over time.
|
|
 Copyright © 1999 Oracle Corporation. All Rights Reserved. |
|