Release 8.0.6 for Windows NT
A69942-01
Library |
Product |
Contents |
Index |
| Oracle Parallel Server Getting Started Release 8.0.6 for Windows NT A69942-01 |
|
Specific topics covered in this appendix are:
A large fraction of cluster problems that have been reported to Oracle Corporation are due to incorrect cluster configuration, particular of the Cluster Manager (CM) and interconnect components.
The information in this section is based on Oracle Corporation's reference implementation of the cluster Operating System Dependent (OSD) modules. Consequently, some of this information may not be applicable to your particular cluster environment.
Make sure all nodes have the exact same cluster OSD software installed, as well as the same registry configuration. Software can be verified by ensuring nodes have the same time stamps and file sizes.
Typically, each node in a cluster will have at least two cards, one for the corporate network and one for the cluster interconnect. A computer, however, can only have one host name associated with it. To get around this problem, a host name for the computer can be assigned just for the cluster interconnect.
C:\> PING OPS1-NT.US.ORACLE.COM

A message similar to the one below appears:
Reply from 144.25.188.247: bytes=32 time<10ms TIL=126
The IP address returned is for the corporate network, not the cluster interconnect.
C:\> IPCONFIG /ALL
The output looks similar to the sample shown below:
Windows NT IP Configuration

              Host Name . . . . . . . . . : ops1-nt.us.oracle.com

Ethernet adapter El90x1:

              Description . . . . . . . . : 3Com 3C90x Ethernet Adapter
              IP Address. . . . . . . . . : 144.25.188.247

Ethernet adapter CpqNF31:

              Description . . . . . . . . : Compaq NetFlex-3 Driver
              IP Address. . . . . . . . . : 144.25.190.247
In this case, the first interface is used for the corporate network, while the second interface is (144.25.190.247) is the one intended for the cluster interconnect.
144.25.190.247 ops1-ipc
144.25.190.248 ops2-ipc
144.25.190.249 ops3-ipc
144.25.190.250 ops4-ipc
The HOSTS file should have one entry for each node's interconnect, and should be copied to all nodes of the cluster so that they can see each other. To verify that they can see each other, try pinging each host from each node. For example
C:\> PING OPS3-IPC
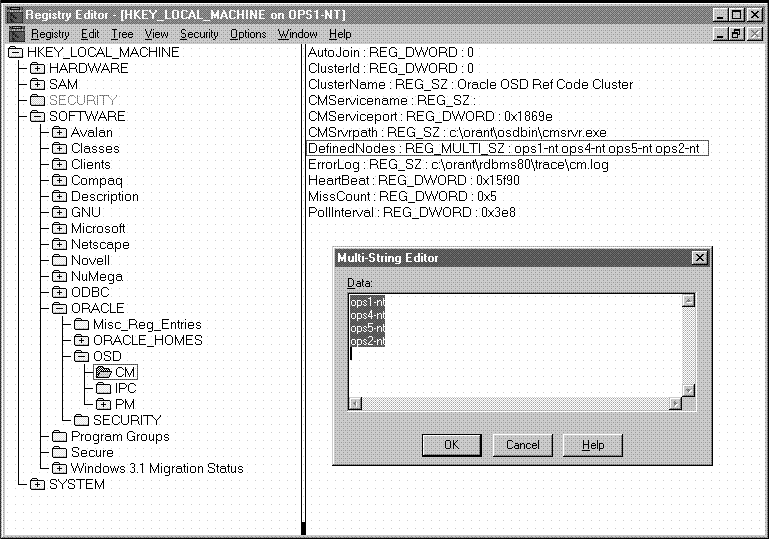
DefinedNodes: REG_MULTI_SZ: ops1-ipc ops4-ipc ops5-ipc ops2-ipc

CmHostName: REG_SZ: ops1-ipc
15:06:46 | MESSAGE | 006f | HandleReconfig(): Reconfig OK - nodes(2)
rcfgGen(5) master(0)
During normal operation, CM on each node checks in with one another to ensure the health of each member. These check-ins occur at interval of N in milliseconds, as specified by the PollInterval registry value in HKEY_LOCAL_MACHINE>SOFTWARE>ORACLE>OSD>CM. A node is allowed to miss M check-ins before it is cast out of the cluster, as specified by the MissCount value in HKEY_LOCAL_MACHINE>SOFTWARE>ORACLE>OSD>CM.
Failed check-ins are recorded to the CM error log file (CM.LOG). These check-in packets are typically UDP packets, and may be lost:
If one of your database instances is dropping out of the cluster under heavy activity, you may see messages in CM.LOG file similar to:
05:01:25 | MESSAGE | PollingThread(): node(1) missed(3) checkin(s)
05:01:27 | MESSAGE | PollingThread(): node(1) missed(5) checkin(s)
05:01:28 | MESSAGE | PollingThread(): node(1) failure detected
This occurs if the check-in messages were lost because of the heavy activity. Make sure there is a dedicated interconnect for Oracle Parallel Server that is separate from the rest of the network. Slightly increasing the MissCount value may also help.
If you are using the secondary disk backup feature of the CM, try to use a partition on a disk that is not heavily used. The backup disk file is written to by every node member during each check-in. If the backup disk is heavily used, it may cause the CM to miss check-ins and falsely drop node members.
The CM error log file (CM.LOG) is specified by the ErrorLog value in HKEY_LOCAL_MACHINE>SOFTWARE>ORACLE>OSD>CM:
ErrorLog: REG_SZ: c:\orant\rdbms80\trace\cm.log
Oracle Corporation recommends specifying an error log location of ORANT\RDBMS80\TRACE\CM.LOG.
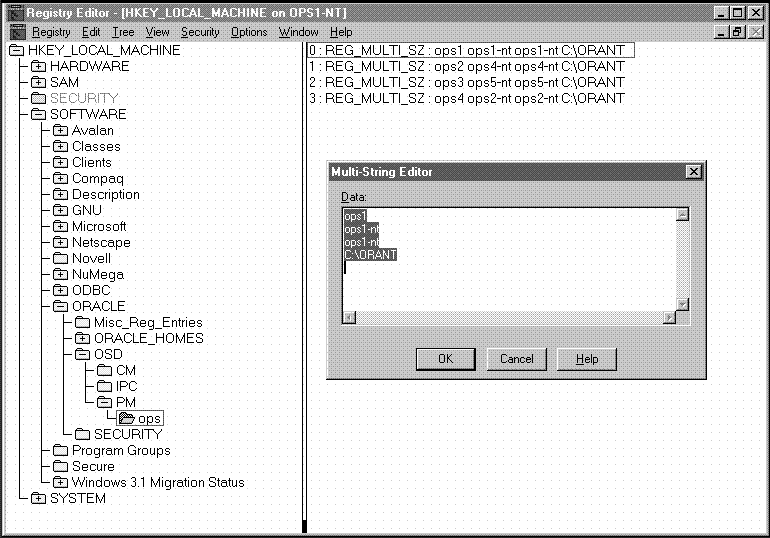
You must configure the Performance and Management (PM) module so that PGMS can determine the cluster configuration. Each Oracle Parallel Server database corresponds to a PGMS group or domain. For example, the INITSID.ORA and INIT_COM.ORA files could have the following parameters defined:
INITOPS1.ORA:
instance_number=1
INITOPS2.ORA:
instance_number=2
INITOPS3.ORA:
instance_number=4
INITOPS4.ORA:
instance_number=4
INIT_COM.ORA:
db_name=ops
The HKEY_LOCAL_MACHINE>SOFTWARE>ORACLE>OSD>PM key would then contain:

where:

If the instance numbers in the PM key do not match those specified in the INITSID.ORA file, you will receive the following error in ORACLE_HOME\RDBMS80\TRACE\SIDLMON.TRC upon instance startup:
ORA-29702: error occurred in Group Membership Service operation
If you are having difficulty starting services or the database, check the PGMS.LOG file stored in SYSTEMROOT\SYSTEM32\PGMS.LOG.
If you used the CRTSRV script in "Step 4: Create Services", OraclePGMSService automatically starts up and shuts down when the OracleServiceSID service is started.
If you did not use the CRTSRV script, you can still have OraclePGMSService start up automatically with a OracleServiceSID service by entering the following at the command for each node:
C:\> OPSREG80 ADDSID
You can also discontinue the OraclePGMSService service automatic start up with OracleServiceSID service with the following at the command line for each node:
C:\> OPSREG80 DELSID
The following messages appear if LM_RESS and LM_LOCKS values are not sufficient, and additional IDLM locks or resources must be allocated dynamically from the SGA:
If these messages appear often, it may lead to SGA exhaustion. To resolve this, increase LM_RESS and LM_LOCKS parameters appropriately based on your database needs to avoid exhausting the SGA.
|
Additional Information: See Chapter 15, "Allocating PCM Instance Locks Oracle Parallel Server," of the Oracle8 Parallel Server Concepts and Administration guide. |
This section discusses the following trace file subjects:
Oracle Parallel Server background threads use trace files to record occurrences and exceptions of database operations, as well as errors. These detailed trace logs are helpful to Oracle support to debug problems in your cluster configuration. Background thread trace files are created regardless of whether the BACKGROUND_DUMP_DEST parameter is set in the INIT_COM.ORA initialization parameter file. If BACKGROUND_DUMP_DEST is set, the trace files are stored in the directory specified. If the parameter is not set, the trace files are stored in the ORACLE_HOME\RDBMS80\TRACE directory.
Oracle8 database creates a different trace file for each background thread. The name of the trace file contains the name of the background thread, followed by the extension .TRC, such as:
Oracle Parallel Server trace information is reported in the following trace files:
Trace files are also created for user threads if the USER_DUMP_DEST parameter is set in the initialization parameter file. The trace files for the user threads have the form ORAXXXXX.TRC, where XXXXX is a 5-digit number indicating the Windows NT thread ID.
The alert file, SIDALRT.LOG, contains important information about error messages and exceptions that occur during database operations. Each instance has one alert file; information is appended to the file each time you start the instance. All threads can write to the alert file.
SIDALRT.LOG is found in the directory specified by the BACKGROUND_DUMP_DEST parameter in the INIT_COM.ORA initialization parameter file. If the BACKGROUND_DUMP_DEST parameter is not set, the SIDALRT.LOG file is generated in ORACLE_HOME\RDBMS80\TRACE.
Oracle Worldwide Support may ask you to create an error call trace stack for a particular trace file. An error call trace stack provides program trace of specific background or user threads in the database.
C:\> SVRMGR30
SVRMGR30> CONNECT INTERNAL/PASSWORD
SELECT PID "Oracle Process Id",
       NAME
    FROM V$PROCESS, V$BGPROCESS
    WHERE V$PROCESS.ADDR = V$BGPROCESS.PADDR;
Oracle Pro NAME
---------- -----
         2 PMON
         3 LMON
         4 LMD0
         5 DBW0
         6 LGWR
         7 CKPT
         8 SMON
         9 RECO
        10 SNP0
        11 SNP1
        13 LCK0
SVRMGR30> ORADEBUG SETORAPID 3
SVRMGR30> ORADEBUG DUMP ERRORSTACK 3
CM and PGMS tracing can be helpful to Oracle Worldwide Support in debugging your cluster configuration problems in cases where the database is not starting, a particular node is hanging, or there is a node crash.
PGMS tracing is stored in the PGMS log file, SYSTEMROOT\SYSTEM32\PGMS.LOG.
PGMS /R
PGMS /I:"C:ORANT\BIN\PGMS.EXE /D /V /S"
where:
|
/D |
debug tracing |
|
/V |
verbose tracing |
|
/S |
spy on PGMS network packets |
To disable tracing:
PGMS /R
PGMS /I:C:"ORANT\BIN\PGMS.EXE"
CM tracing is stored in the error log file, CM.LOG. The location of CM.LOG is defined by the ErrorLog value in HKEY_LOCAL_MACHINE>SOFTWARE>ORACLE>OSD>CM.
CMSrvrpath: REG_SZ: c:\orant\osdbin\cmsrvr.exe /v /c /s
where:
|
/v |
verbose |
|
/c |
trace client request |
|
/s |
spy on CM network traffic |
When creating symbolic links for the logical partitions with SETLINKS utility, do not use prefix \\.\PhysicalDrive. If you use \\.\PhysicalDrive as a symbolic link, you may corrupt the database files. Use the symbolic links provided in the ORALINKx.TBL files, described in Chapter 5, "Configuring Oracle Parallel Server".
SHUTDOWN ABORT is not recommended. Oracle Corporation recommends shutting down the OracleServiceSID service so that resources, such as memory usage or files, will be cleaned up by the Windows NT operating system correctly.
C:\> NET STOP OracleServiceSID
If after reading this appendix, you still cannot resolve your problems, call Oracle Worldwide Customer Support to report the error. Please have the following information at hand:
If an ORA-600 error occurred, it will be printed to SIDALRT.LOG file. If an ORA-600 error or any other severe errors appear in the SIDALRT.LOG file, then provide all files in ORACLE_HOME\RDBMS80\TRACE and PGMS.LOG located in SYSTEMROOT\SYSTEM32.
|
|
Copyright © 1999 Oracle Corporation. All Rights Reserved. |
|