Release 1 (9.0.1)
Part Number A89852-02
Home |
Book List |
Contents |
Index | Master Index | Feedback |
| Oracle9i Supplied PL/SQL Packages and Types Reference Release 1 (9.0.1) Part Number A89852-02 |
|
DBMS_DEBUG is a PL/SQL API to the PL/SQL debugger layer, Probe, in the Oracle server.
This API is primarily intended to implement server-side debuggers and it provides a way to debug server-side PL/SQL program units.
This chapter discusses the following topics:
To debug server-side code, it is necessary to have two database sessions: one session to run the code in debug-mode (the target session), and a second session to supervise the target session (the debug session).
The target session becomes available for debugging by making initializing calls with DBMS_DEBUG. This marks the session, so the PL/SQL interpreter runs in debug-mode and generates debug events. As debug events are generated, they are posted from the session. In most cases, debug events require return notification: the interpreter pauses awaiting a reply.
Meanwhile, the debug session must also initialize itself using DBMS_DEBUG: This tells it what target session to supervise. The debug session may then call entrypoints in DBMS_DEBUG to read events that were posted from the target session and to communicate with the target session.
|
See Also:
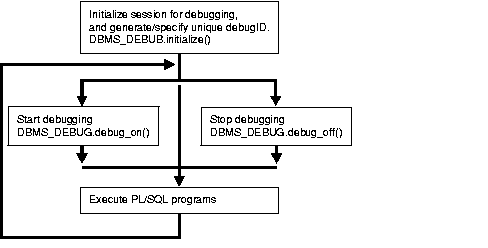
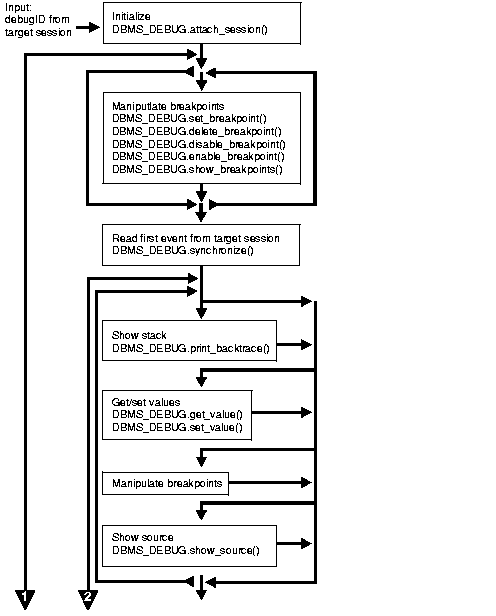
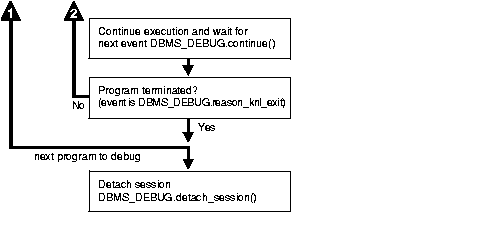
Figure 9-1 and Figure 9-2 illustrate the flow of operations in the session to be debugged and in the debugging session. |
DBMS_DEBUG does not provide any interface to the PL/SQL compiler; however, it does depend on debug information optionally generated by the compiler. Without debug information, it is not possible to examine or modify the values of parameters or variables. There are two ways to ensure that debug information is generated: through a session switch, or through individual recompilation.
To set the session switch, enter the following statement:
ALTER SESSION SET PLSQL_DEBUG = true;
This instructs the compiler to generate debug information for the remainder of the session. It does not recompile any existing PL/SQL.
To generate debug information for existing PL/SQL code, use one of the following statements (the second recompiles a package or type body):
ALTER [PROCEDURE | FUNCTION | PACKAGE | TRIGGER | TYPE] <name> COMPILE DEBUG;
ALTER [PACKAGE | TYPE] <name> COMPILE DEBUG BODY;


The interpreter pauses execution at the following times:
DBMS_DEBUG.CONTINUE in the breakflags parameter.
There is no event for session termination. Therefore, it is the responsibility of the debug session to check and make sure that the target session has not ended. A call to DBMS_DEBUG.SYNCHRONIZE after the target session has ended causes the debug session to hang until it times out.
The diagram suggests that it is possible to set breakpoints prior to having a target session. This is true. In this case, Probe caches the breakpoint request and transmits it to the target session at first synchronization. However, if a breakpoint request is deferred in this fashion, then:
SET_BREAKPOINT does not set the breakpoint number (it can be obtained later from SHOW_BREAKPOINTS if necessary).
SET_BREAKPOINT does not validate the breakpoint request. If the requested source line does not exist, then an error silently occurs at synchronization, and no breakpoint is set.
To debug Probe, there are diagnostics parameters to some of the calls in DBMS_DEBUG. These parameters specify whether to place diagnostic output in the RDBMS tracefile. If output to the RDBMS tracefile is disabled, then these parameters have no effect.
This type specifies a program location. It is a line number in a program unit. This is used for stack backtraces and for setting and examining breakpoints. The read-only fields are currently ignored by Probe for breakpoint operations. They are set by Probe only for stack backtraces.
EntrypointName |
Null, unless this is a nested procedure or function. |
LibunitType |
Disambiguate among objects that share the same namespace (for example, procedure and package specifications). See the Libunit Types for more information. |
TYPE program_info IS RECORD
(
    -- The following fields are used when setting a breakpoint
    Namespace        BINARY_INTEGER,  -- See 'NAMESPACES' section below.
    Name             VARCHAR2(30),    -- name of the program unit
    Owner            VARCHAR2(30),    -- owner of the program unit
    Dblink           VARCHAR2(30),    -- database link, if remote
    Line#            BINARY_INTEGER,
    -- Read-only fields (set by Probe when doing a stack backtrace)
    LibunitType      BINARY_INTEGER,
    EntrypointName   VARCHAR2(30)
);
This type gives context information about the running program.
TYPE runtime_info IS RECORD
(
    Line#            BINARY_INTEGER,  -- (duplicate of program.line#)
    Terminated       BINARY_INTEGER,  -- has the program terminated?
    Breakpoint       BINARY_INTEGER,  -- breakpoint number
    StackDepth       BINARY_INTEGER,  -- number of frames on the stack
    InterpreterDepth BINARY_INTEGER,  -- <reserved field>
    Reason           BINARY_INTEGER,  -- reason for suspension
    Program          program_info     -- source location
);
This type gives information about a breakpoint, such as its current status and the program unit in which it was placed.
TYPE breakpoint_info IS RECORD
(
   -- These fields are duplicates of 'program_info':
   Name        VARCHAR2(30),
   Owner       VARCHAR2(30),
   DbLink      VARCHAR2(30),
   Line#       BINARY_INTEGER,
   LibunitType BINARY_INTEGER,
   Status      BINARY_INTEGER   -- see breakpoint_status_* below
);
This type is used by GET_INDEXES to return the available indexes for an indexed table.
TYPE index_table IS table of BINARY_INTEGER INDEX BY BINARY_INTEGER;
This type is used by PRINT_BACKTRACE.
TYPE backtrace_table IS TABLE OF program_info INDEX BY BINARY_INTEGER;
This type is used by SHOW_BREAKPOINTS.
TYPE breakpoint_table IS TABLE OF breakpoint_info INDEX BY BINARY_INTEGER;
This type is used by SHOW_SOURCE.
TYPE vc2_table IS TABLE OF VARCHAR2(90) INDEX BY BINARY_INTEGER;
A breakpoint status may have these values:
breakpoint_status_unused |
Breakpoint is not in use. |
Otherwise, the status is a mask of the following values:
Program units on the server reside in different namespaces. When setting a breakpoint, specify the desired namespace.
Namespace_cursor contains cursors (anonymous blocks).
Namespace_pgkspec_or_toplevel contains:
Namespace_pkg_body contains package bodies and type bodies.
Namespace_trigger contains triggers.
These values are used to disambiguate among objects in a given namespace. These constants are used in PROGRAM_INFO when Probe is giving a stack backtrace.
LibunitType_cursor |
|
LibunitType_procedure |
|
LibunitType_function |
|
LibunitType_package |
|
LibunitType_package_body |
|
LibunitType_trigger |
|
LibunitType_Unknown |
|
These are values to use for the breakflags parameter to CONTINUE, in order to tell Probe what events are of interest to the client. These flags may be combined.
These are flags which may be passed as the info_requested parameter to SYNCHRONIZE, CONTINUE, and GET_RUNTIME_INFO.
info_getStackDepth |
Get the current depth of the stack. |
info_getBreakpoint |
Get the breakpoint number. |
info_getLineinfo |
Get program unit information. |
After CONTINUE is run, the program either runs to completion or breaks on some line.
These values are returned by the various functions called in the debug session (SYNCHRONIZE, CONTINUE, SET_BREAKPOINT, and so on). If PL/SQL exceptions worked across client/server and server/server boundaries, then these would all be exceptions rather than error codes.
success |
Normal termination. |
Statuses returned by GET_VALUE and SET_VALUE:
Statuses returned by SET_VALUE:
Statuses returned by the breakpoint functions:
General error codes (returned by many of the DBMS_DEBUG subprograms):
illegal_init |
|
The following exceptions are raised by procedure SELF_CHECK:
default_timeout |
The timeout value (used by both sessions).The smallest possible timeout is 1 second. If this value is set to 0, then a large value (3600) is used. |
The following subprograms may be called in either the target or the debug session:
The following subprograms should be run in the debug session only:
Exceptions that are declared in PL/SQL programs are known as user-defined exceptions. In addition, there are Oracle Errors (OERs) that are returned from the Oracle kernel. To tie the two mechanisms together, PL/SQL provides the "exception_init" pragma that turns a user-defined exception into an OER, so that a PL/SQL handler may be used for it, and so that the PL/SQL engine can return OERs to the Oracle kernel. As of the current release, the only information available about an OER is its number. If two user-defined exceptions are exception_init'd to the same OER, they are indistinguishable.
|
|
 Copyright © 1996-2001, Oracle Corporation. All Rights Reserved. |
|