Release 9.0.1
Part Number A88749-02
Home |
Book List |
Contents |
Index | Master Index | Feedback |
| Oracle Enterprise Manager Getting Started with the Oracle Standard Management Pack Release 9.0.1 Part Number A88749-02 |
|
![]()
![]()
This chapter discusses the following Oracle TopSessions topics:
You can use Performance Manager to assist you in identifying performance bottlenecks within your system and database environment. The TopSessions chart displays database sessions that are contributing most heavily to database activity. You can display various details for these sessions, including the SQL statements, and resource usage.
You can obtain an overview of session activity by displaying the top sessions sorted by a statistic of your choosing. For any given session you can then drill down for more detail, or if you choose, you can terminate the session using the Kill Session option.
The TopSessions chart provides a methodology for identifying and correcting certain database performance problems. For example, when sudden file I/O load is detected, you can first identify the sessions contributing most to the problem and then isolate the executing SQL statements in user applications for those sessions. You can then analyze the SQL explain plans for those SQL statements to determine how best to resolve the problem.
Once populated with data, the TopSessions chart includes a multi-column list of summary information for each session connected to the database instance or for each of the top n sessions as measured by the selected sort statistic.
You can also access the TopSessions chart from the Enterprise Manager console by selecting TopSessions from the Diagnostics Pack tool drawer. You can access information about individual sessions via drill downs from this chart.
The TopSessions chart displays the sessions sorted by the statistic specified on the Options tab of the TopSessions property sheet. By using the Set Options button in the toolbar the chart can be customized to show only the items of interest and the sort criteria can be changed. You can specify the number of sessions to display on the Options tab as well. See "Customizing the Session Information You Display" for more information about customizing the TopSessions display.
You can re-sort the sessions by clicking on the statistic column you want to use as the sort criterion. Clicking on the column header toggles the sort order in descending or ascending order. This changes only the display sort order and has no effect on the top "n" sorting/reduction done by selecting the sort item in the Options page.
The File, View, Collection, Tools and Help menus are the same as those in the chart window for Performance Manager. The Drilldown menu is customized to reflect some of the tasks specific to TopSessions.
Before you can use the TopSessions chart on pre-Oracle 9i databases, you must first run a SQL script that defines the OEM_MONITOR role which contains all the privileges required to use the Diagnostics Pack products. Granting the
OEM_MONITOR role is the best way to ensure that a user has the correct privileges to use the TopSessions functions. The OEM_MONITOR role has been granted more privileges in the 9i version that help to provide better functionality and performance.
For 9i databases, the SQL script, catsnmp.sql, is run by default as part of the 9i database creation process. For all versions of the database prior to 9i, you must manually run a SQL script to define the OEM_MONITOR role and create the necessary views.
For versions 8.1.5, 8.1.6, and 8.1.7 of the database, you must run the script
catsnmp_8i.sql. For versions 8.0.5 and 8.0.6 of the database, you must run the script catsnmp_80.sql. For version 7.3.4 of the database, you must run script
catsnmp_734.sql. The selected script must be executed by a user with SYS privileges.
The sql files are located in the Oracle home of the Oracle Enterprise Manager installation, $ORACLE_HOME/SYSMAN/ADMIN. You must run the appropriate version of the SQL script manually on all pre-9i databases.
The OEM_MONITOR role must be granted to any user wishing to use the Oracle Diagnostics Pack. Performance Manager does not require any of these new views in order to run, but if you attach to a database that does not have the views, or your process does not have the required privileges, or the OEM_MONITOR role does not exist, then an informational message displays.
You can display the TopSessions chart from the Oracle Enterprise Manager console, from the Start menu, or from within Performance Manager.
You can display the TopSessions chart from the Oracle Enterprise Manager console in any of the following ways:
On the Start menu, follow the path: Start=>Programs=>
ORACLE - $Oracle _Home=>Standard Management Pack=>TopSessions.
When you launch TopSessions from the Start menu, a database logon dialog box appears. By default, you are connected to the database via Direct Connect, allowing the application to run in Standalone mode. You can change the connection details from the logon dialog to connect to an OMS if you choose.
You can display the TopSessions chart from within Performance Manager by following these steps:
The Data Tab appears in the right-side pane.
By default, the top n sessions in the main display are sorted by the session logical reads statistic. If you want to change the sort statistic and/or the statistic filter, choose Options on the Session menu. This displays the Options property sheet, on which you can customize the session information displayed in the main display. See "Customizing the Session Information You Display" for more information about using the Options property sheet.
Figure 7-1 shows the Oracle TopSessions chart.
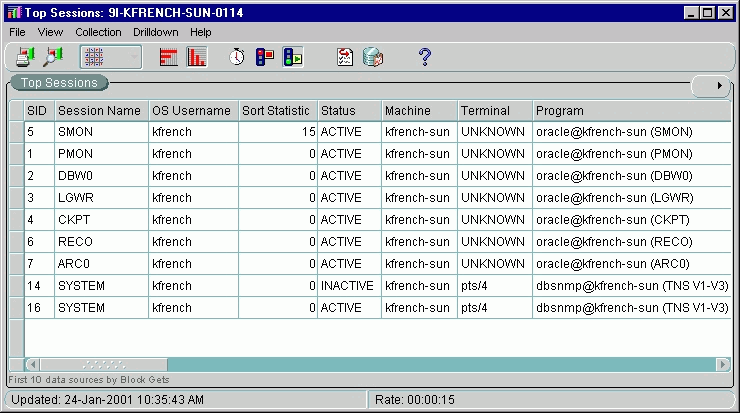
As Figure 7-1 shows, the Oracle TopSessions chart includes the following components:
The following sections describe each of these components.
The menu bar of the Oracle TopSessions chart includes the following pull-down menus:
The File menu on the Charts display window has the following options:
Prints the displayed TopSessions chart.
Generates a report for the TopSessions chart. When you click the Report Chart button, Performance Manager creates a TopSessions chart report in HTML format and saves it for you. You can also preview the report by displaying it in your Web browser.
Closes the displayed TopSessions chart.
The View menu on the Charts display window has the following options:
Changes the current display to a table chart. Table charts present text information, or a large number of instances, in a format that is easy to review.
Changes the chart orientation to horizontal.
Changes the chart orientation to vertical.
The Collection menu on the Charts display window has the following options:
Allows you to stop or resume collections for the chart displayed in the chart window.
This option lets you set the amount of elapsed time between data samples. The maximum interval is one day and the minimum is one second.
Choose one or all of the following:
Displays the Options property sheet, from which you can specify the sorting criterion, the refresh mechanism, and the number of entries for statistics displayed in the Oracle TopSessions main window.
The Drilldown menu shows the same items available from the Performance Manager chart window as well as available drilldowns for the selected sessions. The drilldowns available depend on the tools available on your system. If you choose Session Details from the Drilldown menu when no session is selected in the TopSessions chart, Performance Manager displays the Select Data Source dialog box where you can select from a list of data sources. After you choose the data sources, the Session Details window appears.
The Drilldown menu in the TopSessions chart also includes items specific to TopSessions. You can end a user session that you select on the TopSessions chart by choosing Kill Session from the Drilldown menu. When you kill a session, the session is removed from the chart. If a Session Detail window is open when you kill its session, the Session Detail window stops refreshing and reports an error.
The Drilldown menu on the TopSessions chart has the following options:
Displays the Oracle Capacity Planner Database Logon dialog box. Supply the user name, password, and target information as needed. Once you have logged into Capacity Planner, you can display historical data for this chart or start collecting historical data.
Displays the Session Details window for the session selected from the Oracle TopSessions chart. This menu item is disabled when no session in the Oracle TopSessions main display has been selected.
List of chart statistics for which you can view additional information (charts).
You can kill a session from the Top Sessions chart. This tool requires the Intelligent Agent release 8.0.6 or higher.
Highlight an item in a Top Sessions chart and choose the Tune SQL statement menu option. If the Tuning Pack is installed, this action activates the SQL Analyze application.
The Help menu items allow you to obtain help on Oracle TopSessions chart items or property sheets.
The toolbar of the Oracle TopSessions chart contains icons representing certain Oracle TopSessions menu items, including the following:
Prints the displayed chart.
Generates a report for the displayed chart. When you click the Report Chart button, a chart report in HTML format is automatically created and saved for you. Performance Manager allows you to preview the report by displaying it on your screen.
Changes the current display to the chart type you select from the drop-down list. You can select a bar chart, pie chart, strip chart, or table chart. Bar charts show discrete measurements at the current time. Pie charts show the relationship or proportions of parts to a whole. Strip charts show trends or changes in data over a period of time. When you first display a Strip chart, you will notice the addition over time of tics at the bottom of the chart. Each point represents a polling event. Table charts present text information, or a large number of instances, in a format that is easy to review.
Changes the chart orientation to horizontal.
Changes the chart orientation to vertical.
Allows you to set the time between collections. The time can be set in hours, minutes, and seconds.
Allows you to stop the collection for a chart displayed in the chart window.
Allows you restart the collection of a chart displayed in the chart window.
Allows you to choose the data sources, data, sort criteria, and number of rows to display for the collection.
Displays the Oracle Capacity Planner Database Logon dialog box. Supply the user name, password, and service information as needed. Once you have logged into Capacity Planner, you can display historical data for this chart or start collecting historical data.
Starts recording the current TopSessions Chart.
Stops recording the current TopSessions Chart.
Displays help about the TopSessions chart.
Once populated with data, the Oracle TopSessions chart includes a multi-column list of summary information for each session connected to the database instance, or for each of the top n sessions, as measured by the selected sort statistic listed in Table 7-1.
In the Oracle TopSessions chart, you can click on a username with the right mouse button and then select one of the menu items that appears in the context menu. The list contains the Print Screen, Report Chart, and Help on Chart menu items, and then lists the View, Collection, and Drilldown menus from which you can then select related items from the flyout menus.
By default, the value of the sort statistic determines the order of session entries in the Oracle TopSessions chart. However, you can use any field in the list to sort the order of displayed session entries by clicking on any column header in the list.
Use the Chart Status button in the upper right corner of the TopSessions chart to access many of the same options available from the Drilldown menu. You can display Advice about the current chart, view the Session Details page, kill the current session, and turn SQL Trace on or off. The contents of the menu that displays when you press the Chart Status button is subject to the context of the chart.
To obtain more information about a given session, you can drill down by right mouse clicking on a session in the Oracle TopSessions chart. Click on the Drilldown menu item and choose Session Details. Optionally, you can select a session and then choose Session Details from the Drilldown menu on the menu bar.
A Session Details window for that session appears as seen in Figure 7-2.
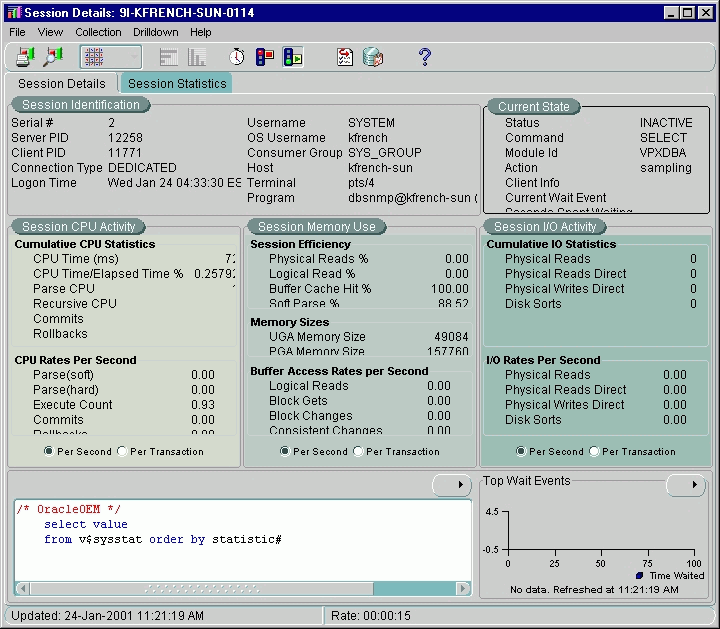
The Session Details page presents a tabular view of a sessions details and includes the following sections:
The Statistics page of the Session Details window provides a large number of performance statistics for the selected session. The particular statistics this page displays can vary, depending on the Oracle server instance.
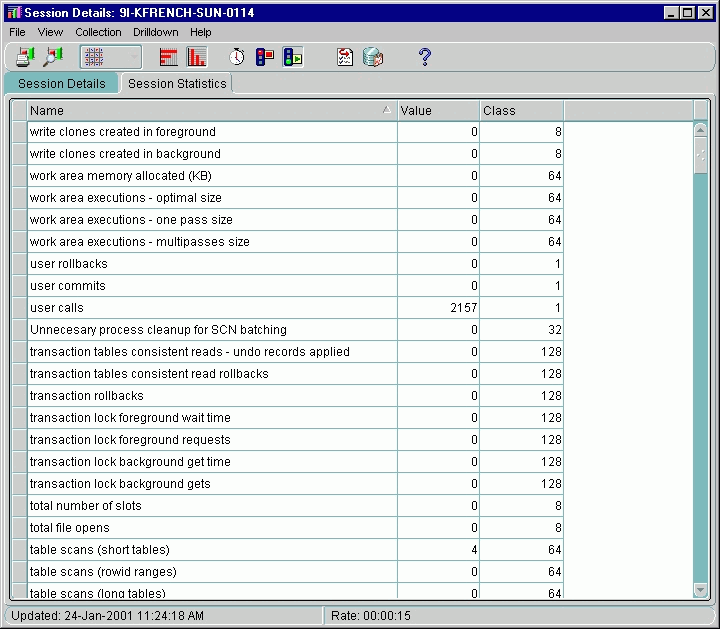
For information about the statistics that can be displayed for a session, see the Oracle Server Reference. For information on how to make use of these statistics, see Oracle Server Tuning.
To customize how session information is displayed in the Oracle TopSessions chart, choose Options from the Collection menu or click on the Options button on the toolbar. The Options property sheet that appears includes the following pages:
To select one of these pages, click on the appropriate tab title near the top of the Options property sheet.
When TopSessions is selected from the Oracle Performance Manager navigator tree, the Data Tab appears in the right-hand pane. The Data Tab presents information about the selected TopSessions collection such as the Data Sources and the collection types of the selected data. You can personalize the Data Tab view by selecting or deselecting the collected data items.
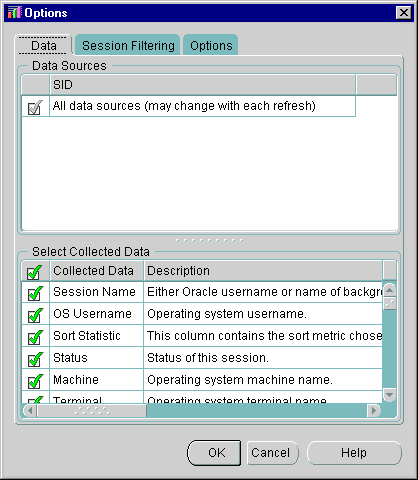
The "All data sources" option is selected by default.
You can specify which data items should appear in the chart by selecting or deselecting the items in this list. By default, a check mark appears in the "Collected Data" row, all data items will automatically appear in the chart.
By default, a TopSessions collection will show any session that is currently active or any session that has executed a SQL statement since the last sample. These sessions are selected based on a default set of pre-defined filters. If you prefer, you can also customize the TopSessions collection by defining your own set of TopSessions filters. The TopSessions Filtering tab allows you to specify your own set of filters.
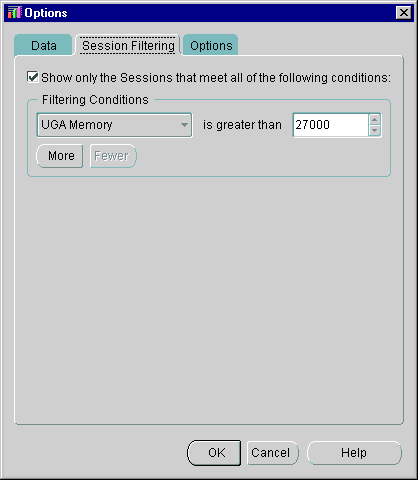
To enable the filtering options, check the box labeled: Show only the statements that meet all of the following conditions. Select a filtering condition and value, then click the More button to add additional filters. You can eliminate filters by pressing the Fewer button.
Before you create your own set of TopSessions filters, it is important to note the following filtering restrictions:
For a complete list of filtering conditions and their descriptions, see Table 7-1, "TopSessions Sort Statistics" .
The Options tab provides two display options. These options should be set prior to showing the TopSessions chart. You can also change the options after starting the chart to reduce the number of sessions to a smaller sample set based upon some abnormality you see in the default chart.
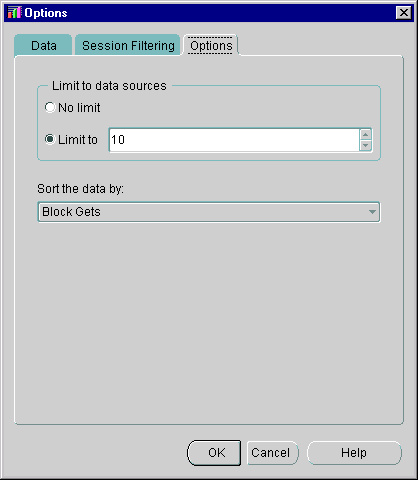
No limit--The TopSessions chart will display all of the statements that meet the filtering criteria(n).
Limit to--By default the TopSessions chart will only display the top 25 statements that meet the filtering criteria(n). You can, however, view more or fewer statements by adjusting this number.
This option allows you to specify a sorting parameter. When the chart is displayed, the data items will be organized by the sorting parameter you have specified. The chart is sorted by disk reads by default.
|
|
 Copyright © 1996-2001, Oracle Corporation. All Rights Reserved. |
|