Release 1 (9.0.1)
Part Number A89870-02
Home |
Book List |
Contents |
Index | Master Index | Feedback |
| Oracle9i Real Application Clusters Deployment and Performance Release 1 (9.0.1) Part Number A89870-02 |
|
![]()
![]()
This appendix describes a case study that presents a methodology for designing systems optimized for Oracle Real Application Clusters.
The case study presented in this appendix provides techniques for designing new applications for use with Real Application Clusters. You can also use these techniques to evaluate existing applications and determine how well suited they are for migration to Real Application Clusters.
This case study assumes you have made an initial database design. To optimize your Real Application Clusters design, follow this methodology:
Part II, "Scaling Applications and Designing Databases for Real Application Clusters", for detailed information on this methodology
See Also:
This case study is a practical demonstration of analytical techniques. Although your specific applications will differ from the example in this appendix, this case study should help you to understand the process. The topics in this section are:
The case study is about the fictitious Eddie Bean catalog sales company. This company has many order entry clerks processing telephone orders for various products. Shipping clerks fill orders and accounts receivable clerks handle billing. Accounts payable clerks handle orders for supplies and services the company requires internally. Sales managers and financial analysts run reports on the data. This company's financial application has three business processes operating on a single database:
Tables from the Eddie Bean database include:
Various application users access the database to perform different functions:
Operation of the Eddie Bean application is fairly consistent throughout the day: order entry, order processing, and shipping occur all day. These functions are not for example, segregated into separate one-hour time slots.
About 500 orders are entered each day. Each order header is updated about 4 times during its lifetime. So we expect about 4 times as many updates as inserts. There are many selects, because many employees are querying order headers: people doing sales work, financial work, shipping, tracing the status of orders, and so on.
There are on average 4 items for each order. Order items are never updated: an item can be deleted and another item entered. The order_header table has four indexes. Each of the other tables has a primary key index only.
Budget and forecast activity has a much lower volume than the order tables. They are read frequently, but modified infrequently. Forecasts are updated more often than budgets, and are deleted once they go into actuals.
The vast bulk of the deletes are performed as a nightly batch job. This maintenance activity does not, therefore, need to be included in the analysis of normal functioning of the application.
Begin by analyzing the existing (or expected) access patterns for tables in your database. Then decide how to partition the tables and group them according to access pattern.
List all your high-activity database tables in a worksheet like the one shown in Table B-2:
| Table Name | Daily Access Volume | |||||||
| Read Access | Write Access | |||||||
| Select | Insert | Update | Delete | |||||
| Operations | I/Os | Operations | I/Os | Operations | I/Os | Operations | I/Os | |
|
|
|
|
|
|
|
|
|
|
|
|
|
|
|
|
|
|
|
|
|
|
|
|
|
|
|
|
|
|
|
|
|
|
|
|
|
|
|
|
To complete this worksheet, estimate the volume of each type of operations. Then calculate the number of reads and writes (I/Os) the operations entail.
For each type of operation to be performed on a table, enter a value reflecting the normal volume you would expect in a day.
For each value in the Operations column, calculate the number of I/Os that will be generated using a worst-case scenario. The SELECT operation involves read access, and the INSERT, UPDATE and DELETE operations involve both read and write access. These operations access not only data blocks, but also any related index blocks.
For example, Figure B-1 illustrates read and write access to data in a large table in which two levels of the index are not in the buffer cache and only a high level index is cached in the System Global Area (SGA).
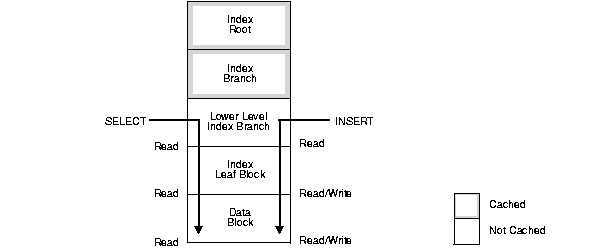
In this example, assuming that you are accessing data by way of a primary key, a SELECT requires three I/Os:
An INSERT or DELETE statement requires at least five I/Os:
One UPDATE in this example entails seven I/Os:
In the case study, the number of I/Os for each operation differs from table to table because the number of indexes differs from table to table.
Table B-3 shows how many I/Os are generated by each type of operation on the order_header table. It assumes that the order_header table has four indexes.
| Operation | SELECT | INSERT | UPDATE | DELETE |
|
Type of Access |
read |
read/write |
read/write |
read/write |
|
Number of I/Os |
3 |
14 |
7 |
14 |
Table B-4 shows how many I/Os generated for each operation for each of the other tables in the case study, assuming each of them has a primary key index only.
| Operation | SELECT | INSERT | UPDATE | DELETE |
|
Type of Access |
read |
read/write |
read/write |
read/write |
|
Number of I/Os |
3 |
5 |
7 |
5 |
For this analysis, you can disregard the fact that changes made to data also generate rollback segment, entailing additional I/Os. These I/Os are instance-based. Therefore, they should not cause problems with your Real Application Clusters applications.
Table B-5 shows rough figures reflecting normal use of the application in the case study.
You can make the following conclusions from the data in Table B-5:
order_header and order_item tables have significant levels of write access.
organizations, by contrast, is predominantly a read-only table. While a certain number of INSERT, UPDATE, and DELETE operations will maintain it, its normal use is SELECT-only.
Begin by analyzing the existing (or expected) access patterns for tables in your database. Then partition the tables and group them according to access pattern.
For each table with a high volume of write access, analyze the transaction volume per day for each type of user.
Use worksheets like the one in Table B-6:
| Table Name: | |||||||||
| Type of User | No.Users | Daily Transaction Volume | |||||||
| Read Access | Write Access | ||||||||
| Select | Insert | Update | Delete | ||||||
| Operations | I/Os | Operations | I/Os | Operations | I/Os | Operations | I/Os | ||
|
|
|
|
|
|
|
|
|
|
|
|
|
|
|
|
|
|
|
|
|
|
|
|
|
|
|
|
|
|
|
|
|
|
|
|
|
|
|
|
|
|
|
|
Begin by estimating the volume of transactions by each type of user and then calculate the number of I/Os required.
The following tables show transaction volume analysis of the three tables in the case study that have high write access levels: order_header, order_item, and accounts_payable.
Table B-7 shows rough estimates for values in the order_header table in the case study.
You can make the following conclusions from the data in Table B-7:
Deletes are performed as a maintenance operation, so you do not need to consider them in this analysis. Furthermore, the application developers realize that sales managers normally access data for the current month, whereas financial analysts access mostly historical data.
Table B-8 shows rough estimates for values in the order_item table in the case study.
The following conclusions can be drawn from Table B-8:
The order_header table has more writes than order_item because the order header tends to require more changes of status, such as address changes, than the list of available products. The order_item table is seldom updated because new items are listed as journal entries.
Table B-9 shows rough figures for the Accounts_payable table in the case study. Although this table does not have a particularly high level of write access, we have analyzed it because it contains the main operation that the accounts payable clerks perform.
You can make the following conclusions from the data in this table:
Deletes are performed as a maintenance operation, so you do not need to consider them in this analysis.
In the case study, the large number of order entry clerks doing heavy insert activity on the order_header and order_item tables should not be separated across machines. You should concentrate these users on one node along with the two tables they use most. A good starting point is to set aside one node for the Order Entry clerks, and one node for all other users as illustrated in Figure B-2.
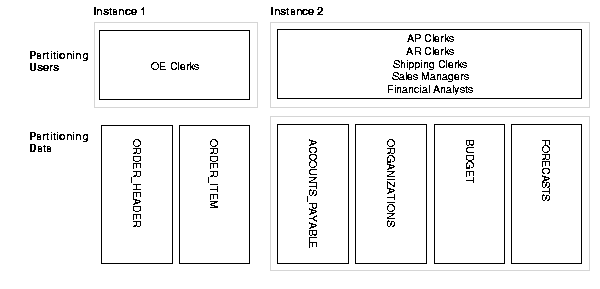
The system in Figure B-2 is probably well balanced across nodes. The database intensive reporting done by financial analysts takes a significant amount of system resources, whereas the transactions run by the order entry clerks are relatively simple.
Attempting to use load balancing by manipulating the number of users across the system is typically useful, but not always critical. Reducing contention has a more significant effect on tuning than implementing load balancing does.
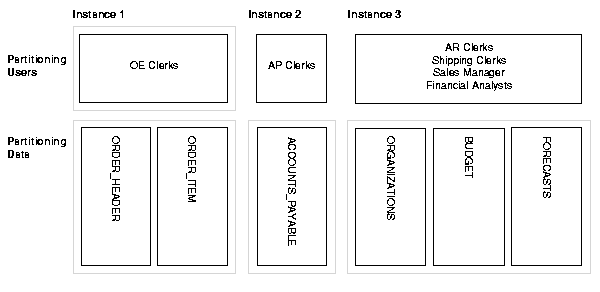
In the case study it is also clear that accounts payable data is written exclusively by accounts payable clerks. You can thus effectively partition this data onto a separate instance as shown in Figure B-3.
When all users needing write access to a certain part of the data are concentrated on one node, the global enqueues all reside on that node. In this way, resource ownership does not move between instances. Based on this analysis, you have two design options as described under the following headings.
You can set up your system as shown in Figure B-3 with all order entry clerks on one instance to minimize contention for exclusive GCS resources on the tables. This allows sales managers and financial analysts to get up-to-the-minute information. Since they do want data that is predominantly historical, there should not be too much contention for current records.
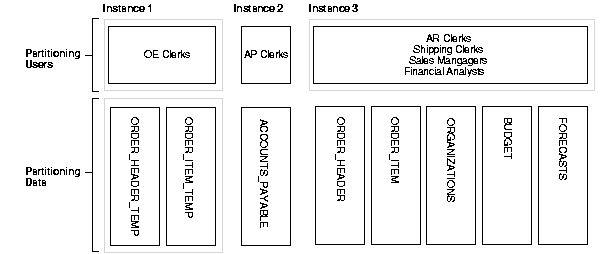
Alternatively, you could implement a separate temporary table for order_item/ order_header as shown in Figure B-4. This table is only for recording new order information. Overnight, you could incorporate changes into the main table against which all queries are performed. This solution would work well if it is not required that financial analysis have current data. This is probably an acceptable solution only if they are primarily interested in looking at historical data. This would not be appropriate if the financial analysts needed up-to-the-minute data.
You need to consider index partitioning if multiple nodes in your system are inserting into the same index. In this situation, you must ensure that different instances insert into different points within the index.
Up to this point, you conducted an analysis using estimated figures. To finalize your design you must now either prototype the application or actually implement it. By observing the actual system, you can tune it further.
To do this, try the following techniques:
|
|
 Copyright © 1996-2001, Oracle Corporation. All Rights Reserved. |
|