Release 9.0
Part Number A90900-01
Home |
Solution Area |
Contents |
Index |
| Oracle9i Reports Tutorial Release 9.0 Part Number A90900-01 |
|
Estimated completion time: 5 minutes
In Chapter 6, "Creating a Graph for the Web Report", you added a graph to a JSP-based Web report. This chapter reviews the source code added for the graph.
Open the Web Source view for the report you created in Chapter 6, "Creating a Graph for the Web Report" called emprevb_<your initials>.jsp.
The rw:graph tag brackets the graph information and links the graph to the data source. It also identifies the categories and the data fields.
<rw:graph> JSP tag.
The code within the rw:graph tag is XML.
<O1Axis lineWidth="1"/>
<O1MajorTick lineWidth="1"/>
...
These lines define the attributes associated with the X-axis.
<SeriesItems> tag, for example:
<SeriesItems>
<Series id="0" color="#ff3300"/>
<Series id="1" markerShape="MS_SQUARE"/>
<Series id="2" markerShape="MS_SQUARE"/>
...
</SeriesItems>
This tag defines the attributes for the values along the X-axis.
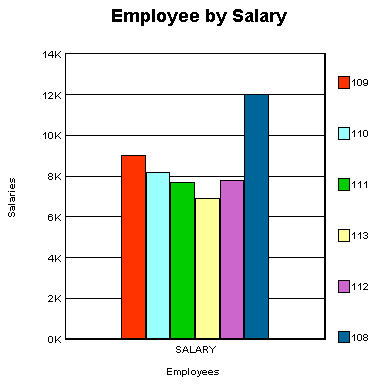
FF3300 is applied to the first bar along the x-axis:
<Title> tag, located here:
</SeriesItems>
<Title text="Employee by Salary"...>
This tag adds the graph title to your Web report, shown here:
</rw:graph> JSP tag, located here:
</Graph> --> </rwgraph> <p> </p ...
The XML that produces the graph is closed before the <rw:graph> JSP tag is closed.
Congratulations! You have finished reviewing the source code for your new graph and completed the Oracle9i Reports Tutorial. For more information on creating Web reports, adding report blocks and data, and creating graphs, see the Reports Builder online help.
|
|
 Copyright © 2002 Oracle Corporation. All Rights Reserved. |
|