Skip Headers

Oracle9i Reports Tutorial
Release 9.0

Part Number A90900-01
Go To Documentation Library
Home
Go To Product List
Solution Area
Go To Table Of Contents
Contents
Go To Index
Index

Go to previous page Go to next page

6
Creating a Graph for the Web Report

Estimated completion time: 15 minutes

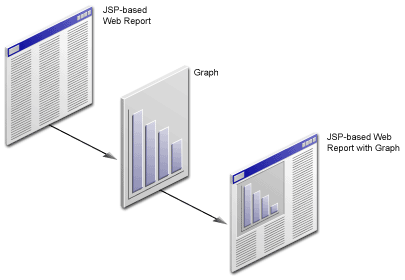
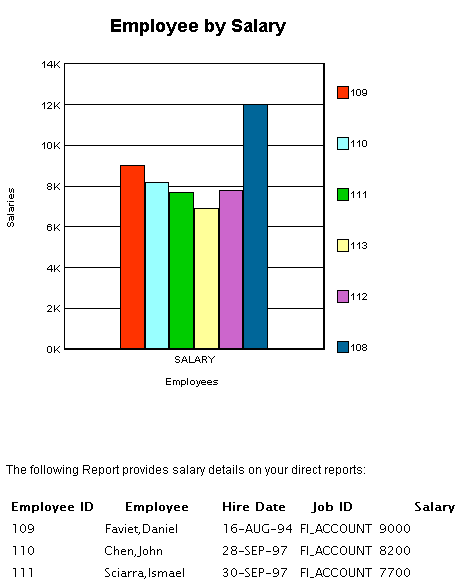
This chapter describes how to use the Graph Wizard to create a graph that will enable managers to view their employees' salaries, and where each employee's compensation rate falls within a specific department.

If you already know how to use the Graph Wizard, refer to Appendix A.3, "Entries for the Graph Wizard"for a quick reference guide.

Figure 6-1 Adding a Graph to a JSP-based Web Report

Text description of graph_xg.gif follows.

Text description of the illustration graph_xg.gif

6.1 Open the source for the report in Reports Builder

To open the Web source in Reports Builder:

  1. In the Object Navigator, make sure the file empreva_<your initials>.jsp is open.


    Note:

    If you have not already created your own JSP-based Web report, open the file we've provided, named empreva.jsp.


  2. In the Object Navigator, under the report name, double-click the Web Source icon to display the source code in the Web Source view.

  3. In the Web Source view, click Edit > Find to find and delete the following text:

    <!-- Replace this text with the graph in Chapter 6 of the Tutorial.-->


    Warning:

    Make sure you delete the entire line of HTML (including the &tags). This location is where you will add the XML and JSP tags for the graph.


6.2 Create a graph using the Graph Wizard

In this section, you will use the Graph Wizard to insert the JSP and XML code for the graph into the Web page for your Web report. The steps show you how to choose the type of graph you want, and the definitions of the X and Y axes. Note that you will base the graph on the same query you created in Section 2.2, "Use the Data Wizard to add data to a sample Web page".

If you already know how to use the Graph Wizard, you can refer to Appendix A, "Quick Reference Guide" for the entries for the Graph Wizard.

To create a graph:

  1. Make sure your cursor is where you deleted the text, and choose Insert > Graph to display the Graph Wizard.

Figure 6-2 Inserting a Graph into your Web Source

Text description of graph_add_sm.gif follows.

Text description of the illustration graph_add_sm.gif

  • On this first page of the Graph Wizard, notice that you can choose from a variety of graph styles. For our simple report, let's choose a Bar graph.

    In the Graph Wizard, make sure the default graph type (Bar) is selected, then click Next.

  • Move EMPLOYEE_ID to the X-Axis Category list, then click Next.

  • Move SALARY to the Y-Axis Data list, then click Next.

  • On the Layout page, click Next.

  • On the Graph Titles page, select Show Title, and in the first text box, type Employees by Salary, then click Next.

  • Make sure Show Legend is selected.

  • From the Location list, choose Right, then click Next.

  • In the Show X-Axis title field, type Employees, then click Next.


    Note:

    Show X-Axis Title is automatically selected when you type text into the field.


  • In the Show Y1-Axis title field, type Salaries, then click Next.

  • Click the Row 1 Color and choose a different color.

    Choose other colors for the other rows, if desired.

  • Click Finish.

  • Click the Run Web Layout icon in the toolbar to preview the report in your Web browser.

    The report should look something like this:

    Figure 6-3 JSP-based Web Report with Graph

    Text description of final_sm.gif follows.

    Text description of the illustration final_sm.gif

    6.3 Save your report with the new graph

    Saving your report with a different filename enables you to compare your results with those we've provided with the tutorial. This way, you can also roll back to the results of a previous chapter, if necessary.

    1. Choose File > Save As.

    2. In the Save dialog box, change the name to emprevb_<your initials>.jsp and click Save.

    6.4 Summary

    Congratulations! You have added a graph to a JSP-based Web report. You now know how to:

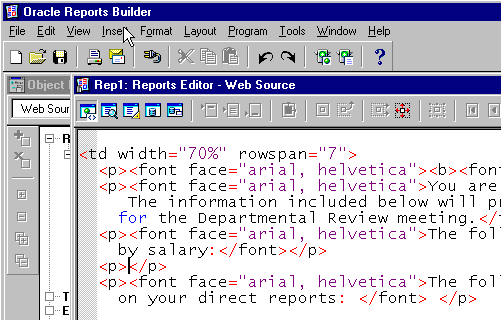
    To review your results, continue to Chapter 7, "Reviewing the Source Code for the Graph".


  • Go to previous page Go to next page
    Oracle
    Copyright © 2002 Oracle Corporation.

    All Rights Reserved.
    Go To Documentation Library
    Home
    Go To Product List
    Solution Area
    Go To Table Of Contents
    Contents
    Go To Index
    Index