Release 2 (9.0.2)
Part Number A92171-02
Home |
Solution Area |
Contents |
Index |
| Oracle9i Application Server Administrator's Guide Release 2 (9.0.2) Part Number A92171-02 |
|
This chapter provides an introduction to monitoring application server instances and components.
It contains the following topics:
This chapter provides an introduction to monitoring components using the Oracle Enterprise Manager Web site. It discusses the available metrics for three key components: Oracle HTTP Server, Oracle9iAS Containers for J2EE, and Oracle9iAS Web Cache.
You can use the Enterprise Manager Web site to monitor the activity of Oracle HTTP Server. The following sections describe the HTTP Server Home Page and related pages, which allow you to monitor the server status, server modules, and the server load and response metrics.
The HTTP Server Home Page provides you with a high-level overview of the HTTP Server. You can access the HTTP Server Home Page in the Name column of the System Components table on the Instance Home Page. Figure 9-1 displays the HTTP Server Home Page. This is where you begin your HTTP Server monitoring tasks:
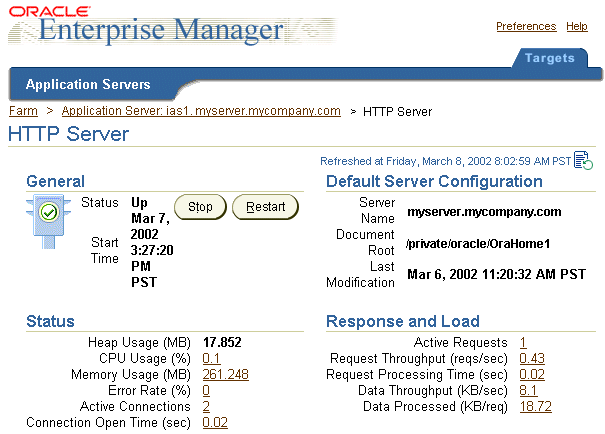
To monitor the HTTP Server from a more detailed point of view, use the Performance section of the HTTP Server Home Page to access the following metric pages:
You can view detailed status information about your HTTP Server on the Status Metrics Page on the Oracle Enterprise Manager. Table 9-1 shows you what to look for in each section of the page.
To view status information:
You can determine the performance of individual Oracle HTTP Server modules using the Module Metrics Page on the Oracle Enterprise Manager.
HTTP Server modules extend your system by allowing you to add features, develop and test features independently, and enable or disable features as needed.
|
Note:
To use a module, you must first register it with Oracle HTTP Server. This is done by modifying the |
To view metrics for your Oracle HTTP Server modules:
The Module Metrics page displays four request metrics for each Oracle HTTP Server module. If you detect poor performance of a particular module, see the error log to determine the cause.
You can view an overall snapshot of how the server is performing on the Response and Load Metrics Page on the Oracle Enterprise Manager.
Response metrics indicate (on average) how many requests were submitted and how long it took for the server to respond to a user's request. The Load metrics indicate (on average) how many bytes of data the server processed with the requests.
You should expect response times to be slower when larger loads are being processed, but you should also account for heavy usage in your server's initial configuration. See the Oracle9i Application Server Performance Guide for more information on handling response and load time.
You can use the Enterprise Manager Web site to view the running status of OC4J instances and monitor the availability, usage, and overall performance of the OC4J server and its applications.
The OC4J Home Page is the starting point for monitoring OC4J. You can access the OC4J Home Page by selecting the OC4J instance in the Name column of the System Components table on the Instance Home Page. Figure 9-2 displays the OC4J Home Page, which displays usage and performance data for OC4J applications. Using the applications table, you can determine which application is incurring the highest volume of requests or longest response time. You can examine an application further by drilling down into the application to view the performance of individual objects, such as servlets and EJBs.
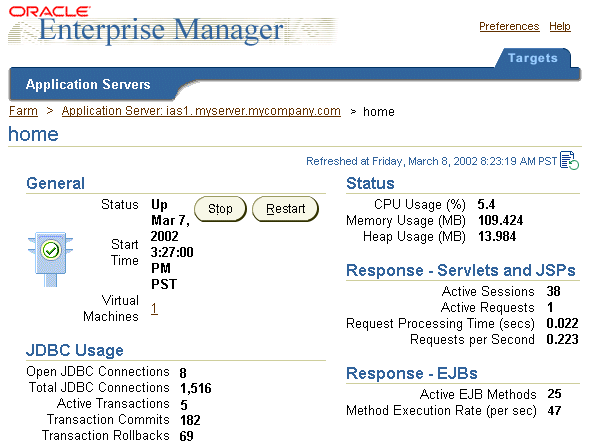
The OC4J Home Page displays a single view of the instance and presents a roll up of status and performance metrics, including:
The OC4J Home Page is divided into several sections that cover server status and metrics, data about deployed applications, and property and default settings information.
The General section displays the current running status of the selected OC4J instance. This section includes the Status, Start Time, and number of virtual machines used to execute OC4J application code for the current OC4J instance. You can choose to stop or restart the server from this section.
The Status section displays the key metrics listed in Table 9-2 for monitoring the overall OC4J instance health. In general, these metrics focus on three factors: volumes, rates, and duration.
The JDBC Usage section provides information about the JDBC connections and transactions and includes the metrics listed in Table 9-3.
The Response - Servlets and JSPs section provides the transactional details about the server and includes the metrics listed in Table 9-4.
The Response - EJBs section provides transactional details about the Enterprise Java Beans and includes the metrics seen in Table 9-5.
| Metric | Description |
|---|---|
|
Active EJB Methods |
Number of EJB Methods currently active |
|
Method Execution Rate (per sec) |
Rate of completion of the EJB Client Methods |
The Deployed Applications section displays a list of all OC4J applications deployed in the OC4J instance, including the status of each application measured by the number of active requests and average processing time for the application. You can perform the following tasks in this section:
The Applications table displays a list of all installed applications in the OC4J instance. You can select any application to display the Application Page for that application, which includes more performance statistics for the specified application.
The Administration section enables you to set instance properties, such as server and Web site properties, and application defaults, such as data sources and principals. The Administration section also includes related links to the UDDI registry and JAAS Policy Management.
The OC4J Application Page displays information and metrics about the specified application. You can access the Application Page by selecting the name of the application in the Name column of the Application table on the OC4J Home Page.
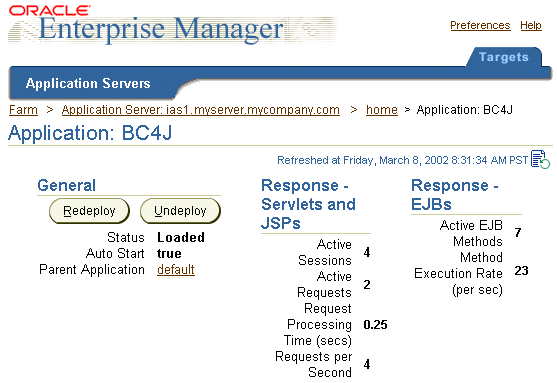
The Application Page provides application status information along with response metrics for Servlets, JSPs, and EJBs. There are two tables in the center of the page that list Web Modules and EJB Modules.
The General section shows the current status of the selected OC4J application and includes a Response section for Servlets, JSPs, and EJBs. You can redeploy or undeploy an OC4J application from the General section.
The Response - Servlets and JSPs section provides transactional details about the server and includes the metrics seen in Table 9-6.
The Response - EJBs section provides transactional details about the Enterprise Java Beans and includes the metrics seen in Table 9-7.
| Metric | Description |
|---|---|
|
Active EJB Methods |
Number of EJB Methods currently active |
|
Method Execution Rate (per sec) |
Rate of completion of the EJB Client Methods |
The Web Modules table displays a list of all Web modules used in the OC4J application. You can select a Web module in the Name column to drill down to the Overview Page for the Web module. The Web Module table includes the Web module name, the path, the number of active requests, the request processing time, and the number of active sessions.
The EJB Modules table displays a list of all Enterprise Java Beans modules used in the OC4J application. You can select an EJB module in the Name column to drill down to the Overview Page for that specific EJB module. The EJB Modules table lists the EJB Module name, the path, the number of EJBs deployed, the number of active EJB methods, and the method execution rate per second for each EJB module.
The Administration section provides access to basic and advanced configuration functions, data sources and their settings, and security principals and roles.
You can use the Application Page to diagnose and isolate problems involving specific servlets or JSPs. For example, if your Web application is experiencing user delays, you can use the OC4J Application Page to diagnose and isolate the servlets or JSPs responsible for the longest response times. You can use the Overview for Web Module Page or the EJB Module Page to break down further the performance of servlets, JSPs, or EJBs, looking at load times, service times, and overhead.
Oracle9iAS Web Cache is a content-aware server accelerator, or reverse proxy server, that improves the performance, scalability, and availability of Web sites that run on Oracle9i Application Server.
By storing frequently accessed URLs in memory, Oracle9iAS Web Cache eliminates the need to repeatedly process requests for those URLs on the application Web server.
Unlike legacy proxy servers that handle only static documents, Oracle9iAS Web Cache caches both static and dynamically generated content from one or more application Web servers. Because Oracle9iAS Web Cache can cache more content than legacy proxies, it provides optimal performance by greatly reducing the load on application Web servers.
Oracle9iAS Web Cache sits in front of application Web servers, caching their content and providing that content to Web browsers that request it. When Web browsers access the Web site, they send HTTP protocol or HTTPS protocol requests to Oracle9iAS Web Cache. Oracle9iAS Web Cache, in turn, acts as a virtual server to the application Web servers. If the requested content has changed, Oracle9iAS Web Cache retrieves the new content from the application Web servers. The application Web servers may retrieve their content from an Oracle database.
The Web Cache Home Page enables you to monitor the running status of Oracle9iAS Web Cache, as well as the overall performance statistics for Oracle9iAS Web Cache. You can access the Web Cache Home Page by selecting an Oracle9iAS Web Cache server in the Name column of the System Configuration table on the Oracle9iAS Instance Home Page. Figure 9-4 displays the Web Cache Home Page.
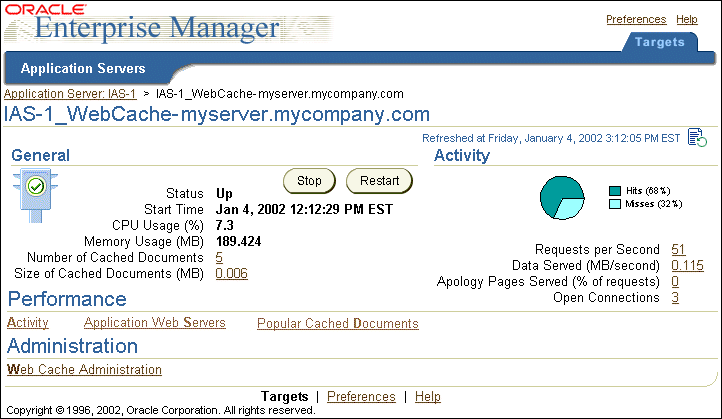
The General section displays the current running status of Oracle9iAS Web Cache. It also displays the key metrics listed in Table 9-8 for monitoring overall Oracle9iAS Web Cache health.
The Activity section displays the cache resource and performance information listed in Table 9-9.
The Performance section provides access to the following pages:
The Web Cache Activity Page enables you to monitor the efficiency of the cache. It displays metrics for cache hit requests, compression requests, and apology page requests.
To access the Activity Page:
Figure 9-5 displays the Web Cache Activity Page.
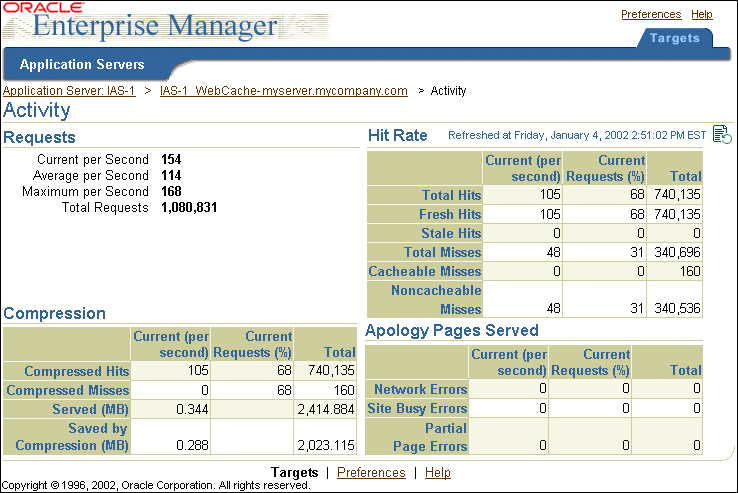
For cache hit rates, compression, and apology pages, the page provides the following information:
The Web Cache Application Web Servers Page enables you to view the status of the application Web servers to which Oracle9iAS Web Cache forwards requests.
To access the Web Cache Activity Page:
Figure 9-6 displays the Web Cache Application Web Servers Page.
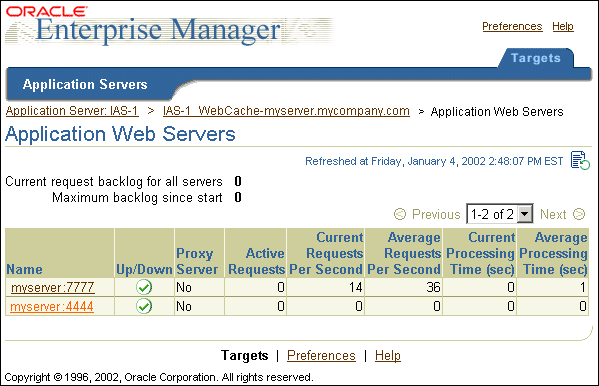
View the Up/Down column. An Up status specifies that the last communication with the server was successful. A Down status specifies that the server is down. If this is the last server in a single or multiple server configuration, Oracle9iAS Web Cache continues to forward requests to the server. If this is not the last server, then no new requests are sent to server. However, Oracle9iAS Web Cache polls the inactive server until it is back online.
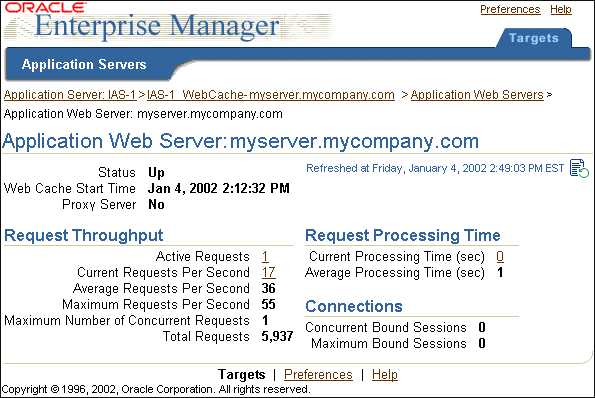
To view detailed metrics for a specific application Web server:
Figure 9-7 displays the Web Cache Application Web Server Page for myserver.mycompany.com:4444.
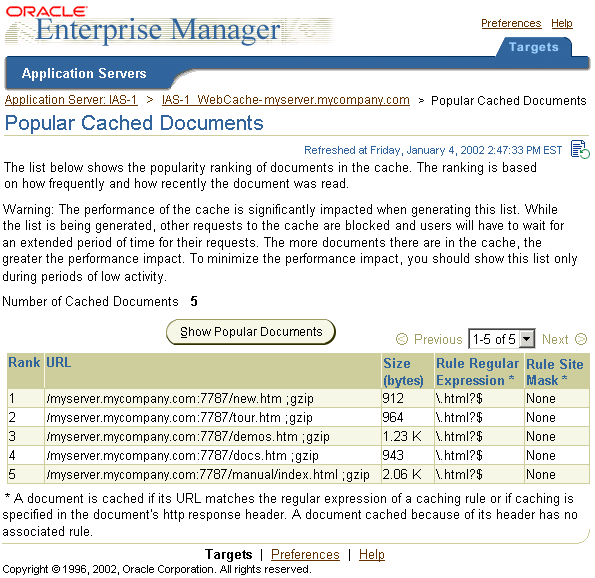
The Web Cache Popular Cached Documents Page enables you to view the URLs of the most popular documents in the cache and to generate a list of the URLs of all the objects currently in the cache. This information helps you verify that the cacheability rules are configured correctly: that the objects that you want cached are being cached. Figure 9-8 displays the Web Cache Popular Cached Documents Page.
To access the Popular Cached Documents Page:
|
|
 Copyright © 2002 Oracle Corporation. All Rights Reserved. |
|