Release 3 (8.1.7)
Part Number A83725-01
Library |
Solution Area |
Contents |
Index |
| Oracle8i Enterprise JavaBeans Developer's Guide and Reference Release 3 (8.1.7) Part Number A83725-01 |
|
Until Java IDEs and JVMs support remote debugging, you can adopt several techniques for debugging your CORBA client and server code.
DebugAgent object for debugging objects executing on a server. See "Using a Debug Agent for Debugging Server Applications" for more information.
Debug by placing both the client and server in a single address space in a single process. Use of an IDE for client or server debugging is optional, though highly desirable.
In the client, the output of System.out.println() goes to the screen. However, in the Oracle8i ORB, all messages are directed to the server trace files. The directory for trace files is a parameter specified in the database initialization file. Assuming a default install of the product into a directory symbolically named $ORACLE_HOME, then the trace file would appear as
${ORACLE_HOME}/admin/<SID>/bdump/ORCL_s000x_xxx.trc
where ORCL is the SID, and x_xxx represents a process ID number. Do not delete trace files after the Oracle instance has been started, or no output is written to a trace file. If you do delete trace files, stop and then restart the server.
For debugging only, set the MTS_SERVERS parameter in your INITSID.ORA file to MTS_SERVERS = 1, and set the MTS_MAX_SERVERS to 1. Having multiple MTS servers active means that a trace file is opened for each server process, and, thus, the messages get spread out over several trace files, as objects get activated in more than one session.
demo/examples/corba/basic/printback.
The procedure for setting up your debugging environment is discussed fully in the Oracle8i Java Developer's Guide. However, it discusses starting the debug agent using a DBMS_JAVA procedures. Within a CORBA application, you can start, stop, and restart the debug agent using the oracle.aurora.debug.DebugAgent class methods. These methods perform exactly as their DBMS_JAVA counterparts perform.
public void start( java.lang.String host, int port, long timeout_seconds)
throws DebugAgentError public void stop() throws DebugAgentError public void restart(long timeout) throws DebugAgentErrorExample 2-3 Starting a DebugAgent on the Server
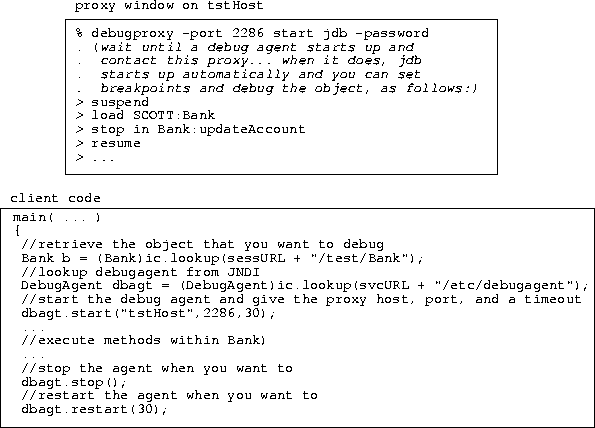
The following example shows how to debug an object that exists on the server. First, you need to start a debug proxy through the debugproxy command-line tool. This example informs the debugproxy to start up the jdb debugger when contacted by the debug agent.
Once you execute this command, start your client, which will lookup the intended object to be debugged, lookup the DebugAgent that is prepublished as "/etc/debugagent", and start up the DebugAgent.
Once the DebugAgent starts, the debugproxy starts up the jdb debugger and allows you to set your breakpoints. Since you have a specified amount of time before the DebugAgent times out, the first thing you should do is suspend all threads. Then, set all of your breakpoints before resuming. This suspends the timeout until you are ready to execute.

|
|
 Copyright © 1996-2000, Oracle Corporation. All Rights Reserved. |
|