3
Creating a line of business page for your intranet portal
This chapter describes how to use Oracle Portal to build a portal for a Sales department within the Healthy Living Company intranet. You will create components and pages to make it easy for Healthy Living salespeople to access their customer database, quickly browse product information, and update their own sales information. They will also be able to view their monthly quotas and commission standings relative to the other salespeople in the company.
You will create a tabbed page for the Healthy Living intranet portal, then add the page you created in Chapter 2, "Creating an intranet portal and adding simple portlets". If you did not complete Chapter 3, you can simply create a new portal in this chapter.
This chapter shows you how to build somewhat more advanced applications than you learned in Chapter 3. You will learn how to create different views of your data using the Report, Chart, and Form wizards, and display these three views in the same portlet. You will also learn how to tailor your applications to serve a particular line of business.
You need Edit or higher access privileges on the <DEMO_SCHEMA> schema to complete this chapter. You also need Edit or higher application privileges to build the components in this chapter. If you do not have these privileges, contact your portal administrator.
The completed portal is available in the installation package that contains the demo schema.
This chapter contains the following sections:
3.1 Create a tabbed page and add a page as a portlet
In this section, you will create the layout for the Sales page of the Inside Healthy Living portal. You will also create tabs on the page and add the Main page from Chapter 3 as a portlet.
Note: In order to add the <YourName>_Main page as a portlet, you must select the Publish as Portlet check box on the Access tab of the Customize Main Page dialog.
For more information on creating pages: Visit the Oracle Portal Online Help. From the Categories list, choose Page Tasks and click Go. In the right pane, click Creating a page.
- Log into Oracle Portal
Note: If you do not have a user ID and password, contact your portal administrator.
- In the Navigator, click the Pages tab.
Note: Next to Path, make sure it reads: Path: Pages.
- Next to My Pages, click Create.
- In the Name field, enter <YourName>InsideHLW.
- In the Display Name field, enter <Your Name> Inside Healthy Living.
- Click Next.
- From the Layout Template list, choose Plain Layout.
- From the Style list, choose Healthy Living Page Style.
- Click Next.
- Click
 to add a tab to the page.
- Next to your new tab, called New Tab click
 to add another tab to the page.
- On the first new tab, click
 to edit the tab name.
- In the Display Name field, enter Main.
- Click Apply.
- Click Close.
- On the tab called "New Tab," click
 to edit the tab name.
- In the Display Name field, enter Sales.
- Click Apply.
- Click Close.
- Make sure the Main tab is active.
- Click
 to add a portlet.
Note: Make sure you are at the Sub-folders level.
- Click Other Providers.
The bottom of the page should read Portlet Repository : Other Providers.
- Click Oracle Portal Pages.
- Under General, next to <YourName>_Main, click
 to add the page as a portlet.
Note: If you did not complete Section 2.1 to create <YourName>_Main , add HLW Main Page as a portlet instead. This is a page we've created for you to add.
- Click OK.
You should now see the layout for the Main page display on the Main tab of your portal.
- Click Finish.
Note: You can change the graphic in the banner by clicking on the Edit Defaults link in the banner located on the Portliest tab of the Customize Page dialog. Under Banner Logo Settings, enter the filename of the logo you want to use.
You have created a page containing tabs, and added a page as a portlet. Your portal should look something like this:

3.2 Add an existing folder as a portlet
The steps in this section help you to add an existing folder as a portlet. When you add items to a content area, you must organize them into folders so that others can access the items via a portal. Once you've created these folders, you can expose them as portlets. Note that you cannot expose an item as a portlet.
For more information about folders: Visit the Oracle Portal Online Help. From the Categories list, choose Content Area Tasks and click Go. In the right pane, click Working With Folders.
You can also follow these steps to add a content area as a portlet (just select a content area instead of a folder), but only the information in the root folder and the sub-folders will display in the portlet.
- In the Navigator, click the Pages tab.
- Click My Pages.
- Navigate to the <YourName> Inside Healthy Living page.
- Click Edit.
- Click the Portlets tab.
- Click the Sales tab.
- Click
 .
.
- Click Other Providers.
- Scroll down until you see Inside Healthy Living Repository.
- Next to Our Company, click
 to add the folder as a portlet.
Note: If you do not see the folder in the list of providers, contact your portal administrator.
- Click OK.
- Click Close.
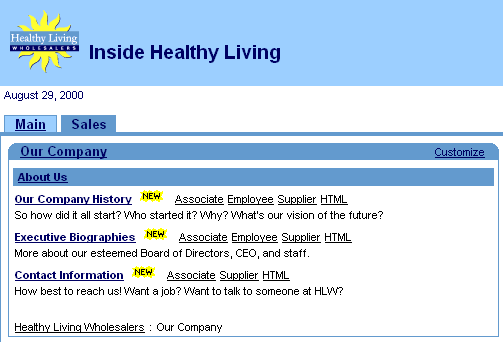
Your portal, containing the folder, should look something like this:
3.3 Create a sales chart portlet that links to a report
The steps in this section help you create a report using the Query Wizard. Here, you will link a chart to the report, then display the chart as portlet. This way, users can view the chart, then drill down to the report for more information.
If you have not created an application, follow the steps in Section 2.4.1, "Create an event calendar using the Calendar Wizard" to create an application under your name. When you create the application, make sure you select the Expose as Provider check box on the Access tab for the applications.
For more information: Visit the Oracle Portal Online Help. From the Categories list, choose Application Tasks and click Go. In the right pane, click Building Components.
3.3.1 Create the report
To create a chart that links to a report, you must first create the report that displays information related to that displayed in the chart. You will create the chart in Section 3.3.4, "Create a sales chart".
- In the Navigator, click the Applications tab.
- Click Casebook30_Application.
Note: If you do not see this application, contact your portal administrator or refer to Appendix A.
- Next to Create New, click Report.
- Click Reports From Query Wizard.
- In the Name field, enter <YourName>_REGIONAL_SALES_REPORT.
- In the Display Name field, enter <YourName> Regional Sales Report.
- Make sure Casebook30_Application is chosen from the Application list.
- Click Next.
- In the Tables or Views field <DEMO_SCHEMA>.HLW_SALES_VIEW where <DEMO_SCHEMA> is where the objects for the demos in this book are installed
- Click Add.
The view displays under Selected Tables/Views.
- Click Next.
- On the Table or View Columns page, click
 to move all the columns to the Selected Columns list.
- Use
 and
and
 to reorder the columns, so that they display like this:
SALES_VIEW.REGION
SALES_VIEW.ID
SALES_VIEW.CUSTOMER
SALES_VIEW.AMOUNT
- Click Next. On the Column Conditions page, click Next.
- On the Report Layout page, make sure Tabular is selected.
- Click Next.
- On the Column Formatting page, next to HLW_SALES_VIEW.ID, change the Column Heading to Order#.
- Next to SALES_VIEW.ID, under Align, choose Left.
- Click Next.
- On the Formatting Conditions page, make the following changes to the first row:
- From the Column list: choose NO CONDITION.
- From the Row/Col list: choose
<DEMO_SCHEMA>HLW_SALES_VIEW.AMOUNT.
- From the Background Color list: choose Green, Pale.
- Click Next.
- On the Display options tab, under Full Page Options, choose Thin Border from the Border list.
- From the Heading Background color list, choose Green, Pale.
- From the Table Row Color(s) list, choose Gray, Light.
- Under Portlet Options, make the same changes to the Border, Heading Background, and Table Row Color.
- Under Break Options, choose Left Break from the Break Style list.
- From the First Break Column list, choose HLW_SALES_VIEW.REGION.
- Under Row Order options, choose HLW_SALES_VIEW.REGION from the Order By list. Make sure Ascending is chosen.
- From the first Then By list, choose HLW_SALES_VIEW.CUSTOMER, then make sure Ascending is chosen.
- From the second Then By list, choose HLW_SALES_VIEW.ID, then make sure Ascending is chosen.
- Click Next.
- Under Customization Form Display Options, make the following changes to the first row:
- Select the Value Required check box.
- From the Column Name list, choose HLW_SALES_VIEW.REGION.
- In the Prompt field, enter Region.
- Under Formatting Options, clear all of the check boxes:
- Output Format
- Maximum Rows
- Break Columns
- Font Size
- Order By
- Layout format
- Display Name
- Click Finish.
- Click the Access tab.
- Select the Publish to Portal check box.
- Click Apply, then click Close. Your report is now finished.
3.3.2 Testing the sales report
Before you create the chart, you should test the sales report to make sure it works.
- Click the Develop tab of the Manage Component dialog for the
<YourName>_REGIONAL_SALES_REPORT. This tab dialog should already display if you are continuing from Section 3.3.1, "Create the report".
- Click Run. The component displays in a new Web browser window.
Note: You should get an error: Required field not set yet. This error occurs because you set the report's customization form to request a value.
- Close the browser window and return to the Web browser window that currently displays the Manage Component dialog for the REGIONAL_SALES_REPORT.
- In the Manage Component dialog, click Customize.
- In the Query Option field, enter Southeast.
Note: This field is case-sensitive.
- From the REGION list, choose =.
- Click Run Report.
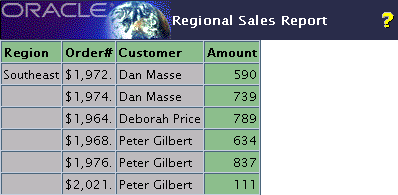
The report that displays should look something like this:
3.3.3 Create a link to your sales report
In this section, you create a link that connects the sales chart to the report. This enables you to click on the returned values in the chart to drill down to that value displayed in the Regional Sales report you created in Section 3.3.1, "Create the report".
For more information about links: Visit the Oracle Portal Online Help. From the Categories list, choose Application Tasks and click Go. In the right pane, click Building Components, then click Using a link between components.
- In the Navigator, click the Applications tab.
- Click Casebook30_Application.
- Next to Create New, click Link.
- In the Link Name field, enter <YourName>_REGIONAL_SALES_REPORT_LINK.
- From the Application field, make sure Casebook30_Application is chosen.
- Click Next.
- Make sure the Oracle Portal Component radio button is selected.
- In the Target Component or URL field, enter CASEBOOK30_APPLICATION.<YourName>_REGIONAL_SALES_REPORT.
- Click Finish.
3.3.4 Create a sales chart
The steps in this section help you create the chart that you will then link to the report you created in Section 3.3.1, "Create the report".
- In the Navigator, click the Applications tab.
- Click Casebook30_Application.
- Next to Create New, click Chart.
- Click Charts From Query Wizard.
- In the Name field, enter <YourName>_TOTAL_SALES_CHART.
- In the Display Name field, enter <YourName> Total Sales Chart.
- From the Application list, make sure Casebook30_Application is chosen.
- Click Next.
- In the Table/Views field, enter <DEMO_SCHEMA>.HLW_SALES_VIEW.
Tip: If you get an error when trying to use this view, try using the Search window. If you do not see the <DEMO_SCHEMA> schema, contact your portal administrator.
- Click Next.
- On the Table or View Columns page, from the Label list, choose REGION.
- From the Link list, choose <YourName>_REGIONAL_SALES_REPORT_LINK (the link you just created in Section 3.3.3, "Create a link to your sales report").
- Next to the Link list, click
 .
.
- In the window that displays, from the Condition list, choose =.
- From the first Column Name list, choose REGION.
- Click OK.
- From the Value list, choose AMOUNT.
- From the Group Function list, choose SUM.
- Click Next.
- On the Column Conditions page, click Next.
- On the Display Options page, under Common Options, choose ORDER BY VALUE from the Order By list.
- Under Full Page Options, in the Value Format Mask field, enter $ in front of the numerals 999,999,999,999,999.
- Click Finish.
- In the Manage Component dialog, click Access.
- Select the Publish to Portal check box.
- Click Apply, then Close. Your chart is now finished.
3.3.5 Test the chart with links
Now that you've create the report, the link, and the chart, try testing the chart to make sure the links display the corresponding data in the report.
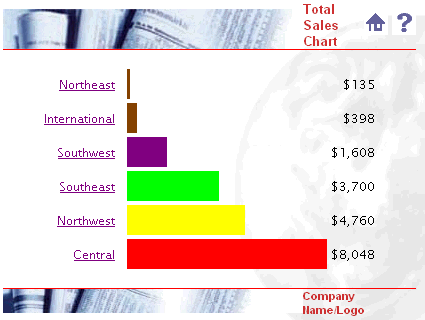
- In the Manage Component dialog for MY_TOTAL_SALES_CHART, on the Develop tab, click Run. You should see something like this:
- Click Northeast. The following should display:

3.3.6 Display the chart as a portlet
After you've created the chart with links, you can now display it as a portlet. When you click the links in the chart, the corresponding field in the report will display.
- In the Navigator, click the Pages tab.
- Navigate to <YourName> Inside Healthy Living.
- Click Edit.
- Make sure the Sales tab is highlighted.
- Click
 to add a new region.
The Sales page should now be divided into two regions, with the folder portlet you added in Section 3.2, "Add an existing folder as a portlet" displaying in the left region.
- On the Portlets tab, in the left pane, click
 .
.
- In the Add Portlets dialog, click Other Providers.
- Click Casebook30_Application.
- Under Casebook30_Application, click YourName> Total Sales Chart.
- Click OK.
- Click Close.
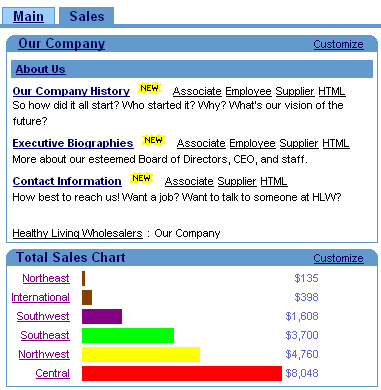
The chart displays in your portal.
3.4 Create a multi-tabbed region containing two charts
The steps in this section help you create two different charts: one that displays the sales budget for the year, and one that displays the top revenue for each product. You will then display the two charts in a single portlet, along with the chart you created in Section 3.3, "Create a sales chart portlet that links to a report". Doing so enables the salespeople to easily reference each chart, as well as organize their information. You can also use multiple tabs in a region to easily display different views of the same data in the same region.
3.4.1 Use the available charts
For your convenience, we've created the two charts you will add to a single portlet. To access these charts, you must have Edit or higher access privileges on the application that owns them. If you do not have these privileges (or do not know), contact your portal administrator.
Note: For the purposes of this exercise, you can use any charts that you can access.
3.4.2 Add the charts to the same portlet
In this section, you will create a multi-tabbed portlet, then add a chart to each of the tabs.
- In the Navigator, click the Pages tab.
- Click My Pages.
- Next to the <YourName> Inside Healthy Living Page, click Edit.
- On the Portlets tab, make sure the Sales tab is highlighted.
- In the right-hand column, click
 to add a row to your new column.
- In the top region of the right-hand column, click
 to add a tab to the region.
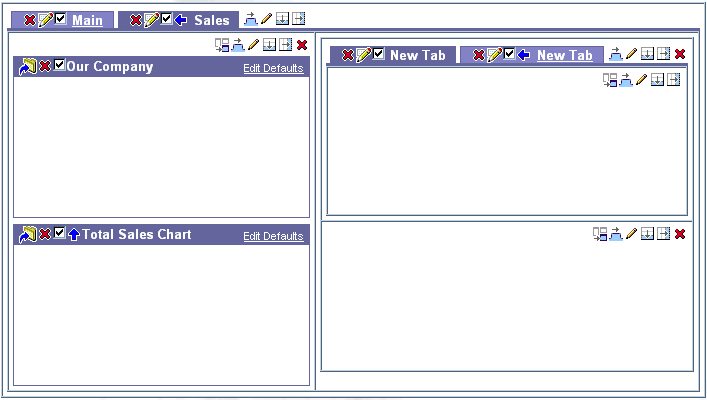
- Repeat step 7 so that two tabs display in the same region.
The layout should now look something like this:
- Next to the first new tab, click
 .
.
- In the Display Name field, enter Sales Budget by Region.
- Click Apply.
- Click Close.
- Follow steps 10 - 12 for the second tab and name it Top Revenues.
- Click the Sales Budget by Region tab.
- Click
 .
.
- In the Add Portlets dialog, click Other Providers.
- Click Casebook30_Application.
- Next to the chart named Budget Region Chart, click
 .
.
- Click OK.
- Click the Top Revenues tab.
- Click
 .
.
- In the Add Portlets dialog, click Other Providers.
- Click Casebook30_Application.
- Next to the chart named Top Revenue Chart, click
 .
.
- Click OK.
- Click Close.
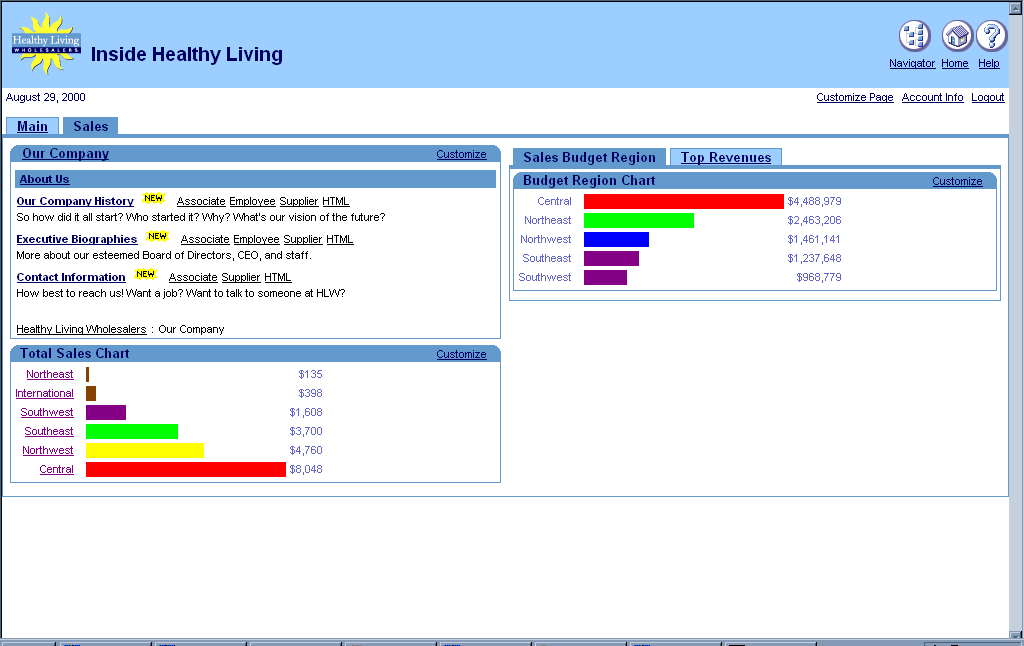
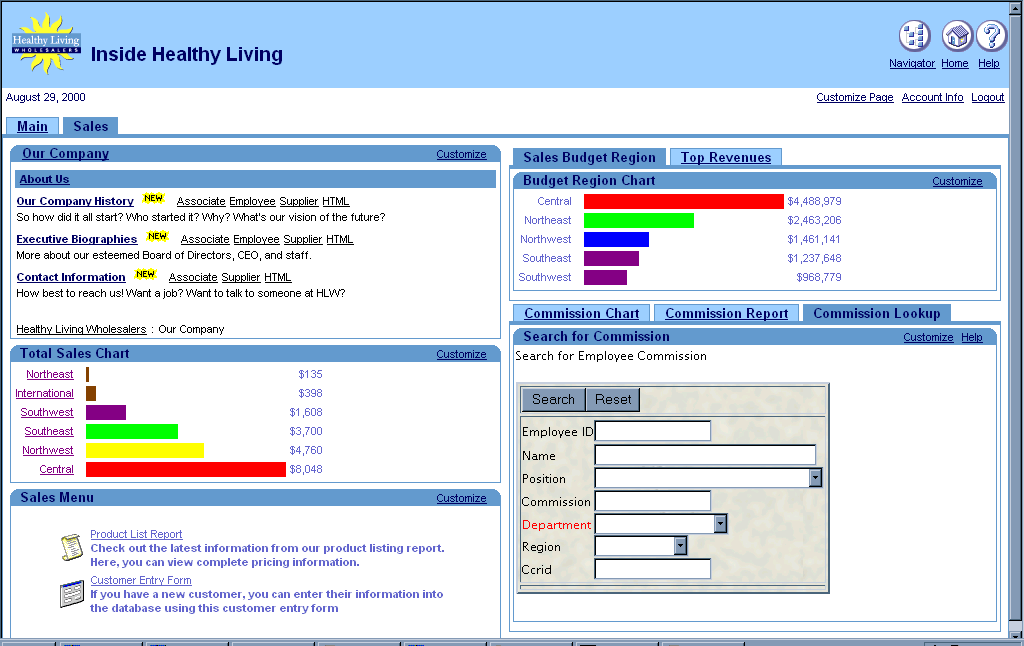
The tabbed portlet displays on the Sales tab of the portal. The resulting page should look something like this:
3.5 Create a multi-tabbed region containing a form, report, and chart
The steps in this section help you create a chart, a report, and a search form that lets you access all sales commission information. You will then display these three components in a single region. Doing so will make it easy for salespeople to view their department's commission information in three different ways.
3.5.1 Create a sales commission chart
In this section, you use the Charts from SQL Query Wizard. Creating a chart based on a SQL query is powerful because you can create your own SQL statement. If you want to add a link to this chart, you can also add the link's SQL statement to the SQL statement in the chart.
- In the Navigator, click the Applications tab.
- Click Casebook30_Application.
- Next to Create New, click Chart.
- Click Charts From SQL Query.
- In the Name field, enter <YourName>_COMM_REG_CHART.
- In the Display Name field, enter <YourName> Sales Commission Chart.
- Make sure Casebook30_Application is chosen from the Application list.
- Click Next.
- In the SQL Query field, enter something like this:
select
    null     the_link,
    r.region_name Region,
    sum(e.commission) Commission
from <DEMO_SCHEMA>.hlw_staff e, <DEMO_SCHEMA>.hlw_regions r
where r.region_id = e.region_id
group by region_name
order by 1

Notes:
You must change <DEMO_SCHEMA> to the schema where the objects for the demos in this book are installed.
- Click Next.
- In the Value Format Mask field, enter $ in front of the 999,999,999,999,999.
- Click Next.
- On the Customization Form Display Options tab, click Next.
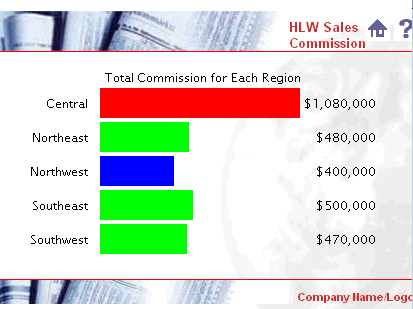
- In the Header Text field, enter Total Commission for Each Region.
- Click Finish.
- In the Manage Component dialog, click Access.
- Select the Publish to Portal check box.
- Click Apply.
- Click Develop.
- Click Run to test the new chart. The chart should look something like this:
3.5.2 Create a sales commission report
In this section, you use the Reports from Query Wizard to create a report that will display on one of the tabs in the multi-tabbed portlet.
- In the Navigator, click the Applications tab.
- Click Casebook30_Application.
- Next to Create New, click Report.
- Click Reports From Query Wizard.
- In the Name field, enter <YourName>_COMMISSION_REPORT.
- In the Display Name field, enter <YourName> Sales Commission Report.
- Make sure Casebook30_Application is chosen from the Application list.
- Click Next.
- Add the two following tables:
<DEMO_SCHEMA>.HLW_STAFF
<DEMO_SCHEMA>.HLW_REGIONS
where <DEMO_SCHEMA> is where the objects for the demos in this book are installed. To add the tables, enter each table name in the field, then click Add. Once you've added the tables, the table names display below the field.
- Click Next.
- On the Join Conditions page, create the following join condition:
HLW_REGIONS.REGION_ID = HLW_STAFF.REGION_ID
- Click Next.
- Select the following columns by clicking on each in the Columns list, then clicking
 to move the column to the Selected Columns list:
HLW_REGIONS.REGION_NAME
HLW_STAFF.EMPLOYEE_ID
HLW_STAFF.NAME
HLW_STAFF.COMMISSION
- Click Next.
- In the first row, from the Column Name list, choose HLW_STAFF.COMMISSION.
- From the Condition list, choose not null.
- Click Next.
- Make sure Tabular Layout is chosen.
- Click Next.
- Under Column Heading, change Region Name to Region.
- Change Employee Id to Employee#.
- Next to HLW_STAFF.COMMISSION, under Format Mask, enter $999,999.
- Click Next.
- On the Formatting Conditions tab, click Next.
- Under Full Page Options, choose Thick Border from the Border list.
- Under Portlet Options, change the Border to Thick Border and the Heading Background Color to Green, Pale.
- From the Heading Background Color list, choose Green, Pale.
- Under Break Options, make sure Left Break is chosen.
- From the First Break Column list, choose HLW_REGIONS.REGION_NAME.
- Under Row Order Options, choose HLW_REGIONS.REGION_NAME from the Order By list, then choose Ascending.
- In the next row, choose HLW_STAFF.COMMISSION from the Order By list, then choose Descending.
- Click Next.
- On the Customization Form Display Options tab, click Next.
- On the Report and Customization Form Text tab, in the Header Text field, enter:
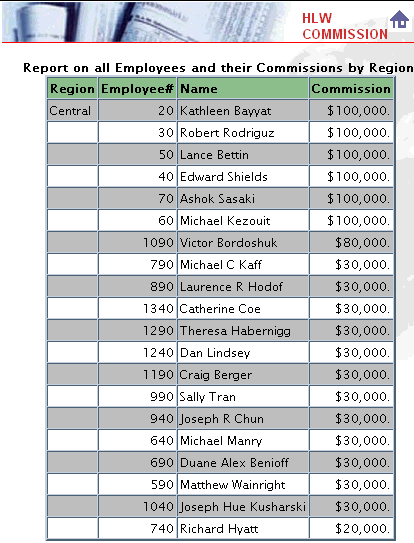
<H4>Report on all Employees and their Commissions by Region</H4>.
- Click Finish.
- In the Manage Component dialog, click Access.
- Select the Publish to Portal check box.
- Click Apply.
- Click Develop.
- Click Run to test the report. The report should look something like this:
3.5.3 Create two LOVs for the commission search form
In this section you will create two lists of values (LOVs) that you will then use in Section 3.5.4, "Create a commission search form". One of these LOVs will depend on the items you choose in another LOV.
For more information: Visit the Oracle Portal Online Help. From the Categories list, choose Application Tasks and click Go. In the right pane, click Building Components, then click Building Lists of Values.
3.5.3.1 Create the DEPARTMENT_LOV static list of values
This LOV will control the items that display in the LOV you will create in Section 3.5.3.2, "Create the EMP_LOV dynamic list of values with a bind variable". When you choose a department number from this LOV, the employees of that department will display in the Employee LOV.
- In the Navigator, click the Applications tab.
- Click Casebook30_Application.
- Next to Create New, click List of Values.
- Click Static List of Values.
- Make sure Casebook30_Application is chosen in the Owner list.
- In the Name field, enter <YourName>_DEPARTMENT_LOV.
- From the Default format list, choose Combo box.
- From the Show Null Value list, choose Yes.
- In the first row, in the Display Value field, enter Head Office.
- In the Return Value field, enter 10.
- In the Display Order field, enter 1.
- Add the following values in the rest of the rows on this page:
Table 3-1 Department Static List of Values
Note: Click More to add more rows.
- Click OK.
3.5.3.2 Create the EMP_LOV dynamic list of values with a bind variable
This LOV will change depending on the item chosen from the Department List of Values. When you choose a department number from the DEPARTMENT_LOV, the employees of that department will display in this LOV. To create an LOV that depends on another, you must use a bind variable in its SQL query.
- Follow steps 1 through 3 from Section 3.5.3.1, "Create the DEPARTMENT_LOV static list of values".
- Click Dynamic List of Values.
- In the Name field, enter <YourName>_EMP_LOV.
- Make sure Casebook30_Application is selected in the Owner list.
- From the Default format list, choose Combo box.
- From the Show Null Value list, choose Yes.
- In the SQL Query field, enter something like this:
select NAME, employee_id
from <DEMO_SCHEMA>.hlw_staff
where department_no = :deptno
order by name

Note: You must replace <DEMO_SCHEMA> with the schema where the objects for
the demos in this book are installed.
- Click OK.
3.5.4 Create a commission search form
Before you can complete this section, you must create the lists of values (see Section 3.5.3, "Create two LOVs for the commission search form"). If you do not want to create the lists of values first, you can always add them to the form later.
- In the Navigator, click the Applications tab.
- Click Casebook30_Application.
- Next to Create New, click Form.
- Click Forms based on table or view.
- In the Name field, enter <YourName>_COMM_SEARCH_FORM.
- In the Display Name field, enter <YourName> Sales Commission Lookup.
- Make sure Casebook30_Application is chosen from the Application list.
- Click Next.
- In the Table or View field, enter
<DEMO_SCHEMA>.HLW_STAFF where <DEMO_SCHEMA> is where the objects for the demos in this book are installed
- Click Next.
- Make sure Tabular is selected.
- Click Next.
- In the left pane, display the items below FORM.
Note: If you do not see any items listed below FORM in the left pane, click
 next to FORM.
- Delete the fields and buttons that you do not need for this form. If you're just creating this form for learning purposes, you can skip this step.
Next to each of the following items, click
 to remove the item from the form, then click OK to accept the dialog:
- INSERT_TOP
- UPDATE_TOP
- DELETE_TOP
- NAME
- JOB
- REGION_ID
- EMPLOYEE_GENDER
- MARITAL_STATUS
- USER_ID
- EMAIL_ID
- HIRE_DATE
- ANNUAL_SALARY
- MANAGER_ID
- BUDGET
- VACATION_DAYS
- EMPLOYEE_ADDRESS
- EMPLOYEE_CITY
- EMPLOYEE_ZIP
- EMPLOYEE_STATE
- EMPLOYEE_PHONE
- INSERT_BOTTOM
- UPDATE_BOTTOM
- DELETE_BOTTOM
- QUERY_BOTTOM
- RESET_BOTTOM
- In the left pane, click FORM. The form's Formatting and Validation Options display in the right pane.
- From the Box Background Image list, choose Brown.
- From the Box Border list, choose Thick Border.
- Clear the Show Timing check box.
- Next to Order By, choose EMPLOYEE_ID from the list, and make sure Ascending is chosen.
- In the left pane, next to DEPARTMENT_NO, click
 until DEPARTMENT_NO displays above EMPLOYEE_ID.
- In the left pane, click QUERY_TOP. This displays Formatting and Validation options for the query button that will appear at the top of the finished form.
- In the Label field, enter Search.
- In the left pane, click DEPARTMENT_NO.
- From the Item Type list, choose Combobox.
- In the Label field, enter Department.
- From the List of Values list, choose <YourName>_DEPARTMENT_LOV.
Tip: Choose the LOV you created in Section 3.5.3.1, "Create the DEPARTMENT_LOV static list of values".
- In the left pane, click EMPLOYEE_ID.
- From the Item Type list, choose Combobox.
- In the Label field, enter Employee.
- From the Font Color list, choose Black.
- From the List of Values list, choose <YourName>_EMP_LOV.
Tip: Choose the LOV you created in Section 3.5.3.2, "Create the EMP_LOV dynamic list of values with a bind variable".
- From the Set binding(s) for the bind variable(s) defined in the lov deptno list, choose DEPARTMENT_NO.
- Click Next.
- In the Header Text field, enter Search for Employee Commission.
- Click Finish.
- In the Manage Component dialog, click Access.
- Select the Publish to Portal check box.
- Click Apply.
- Click Develop.
- Click Run to test the form. The form should look something like this:
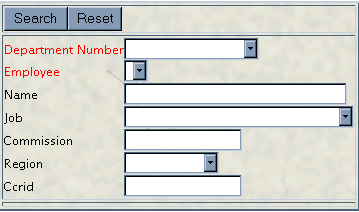
Note: You should be able to choose a department name from the Department LOV, then an employee name from the Employee LOV for the department you selected. These lists are based on the two LOVs you created in Section 3.5.3, "Create two LOVs for the commission search form".
3.5.5 Add the chart, report, and form to the same portlet
In this section, you will add all the components you created to the same portlet.
- In the Navigator, click the Pages tab.
- Click My Pages.
- Next to <YourName> Inside Healthy Living, click Edit.
- Follow the steps in Section 3.4.2, "Add the charts to the same portlet"and create three tabs with the following names in the bottom right region:
- Add the chart, <YourName> Sales Commission Chart, to the Commission Chart tab.
- Add the report, <YourName> Sales Commission Report, to the Commission Report tab.
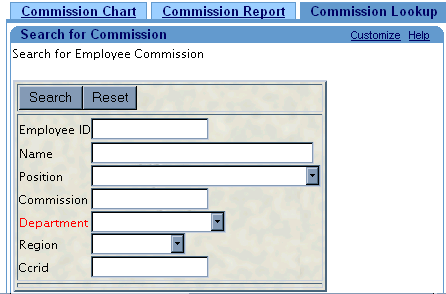
- Add the form, <YourName> Sales Commission Lookup, to the Commission Lookup tab.
- Close the Customize Page dialog. The portlet should look something like this (the tab containing the commission form is currently active):
3.6 Create a customer entry form
The steps in this section help you create an entry form in which salespeople can add, update, and remove customer information from the database. You can create forms in Oracle Portal that display as portlets, These enable users to easily update and access information in the database.
3.6.1 Create a database sequence
In this section, you create a database sequence for the form that assigns each employee record a unique ID. The sequence automatically increments the Employee ID by 1 each time a new employee is added
For more information about building sequences: Visit the Oracle Portal Online Help. From the Categories list, choose Administration Tasks and click Go. In the right pane, click Building Database Objects.
- In the Navigator, click Database Objects.
Note: You must have the MANAGE ALL SCHEMAS global privilege or Manage privileges on the <DEMO_SCHEMA> schema to create the sequence.
- Under Name, click <DEMO_SCHEMA>.
- Next to Create New, click Sequence.
- In the Sequence Name field, enter <YourName>_NEW_CUSTOMER.
- In the Schema list, make sure <DEMO_SCHEMA> is chosen.
- Click Next.
- In the Increment By field, enter 1.
- In the Start With field, enter 1000.
Note: Setting the two fields with these values causes the customer entries in the database to begin with the number 1000. Every following record will increment by 1, so the second customer record will have the ID of 1001.
- Click Finish.
- In the Navigator, find the new database sequence (<YourName>_NEW_CUSTOMER) on the Database Objects tab.
Note: You can use the Find field to search for a specific database object.
- Next to the sequence, click Grant Access.
- In the User/Role field, enter PUBLIC.
- Click SELECT in the list.
- Click Add to List.
- Click Close.
You have now created a database sequence number that can be used by the form you create in the next section.
3.6.2 Create a REGION LOV for the form
- In the Navigator, click the Applications tab.
- Click Casebook30_Application
- In the Owner field, make sure Casebook30_Application is selected.
- Next to Create New, click List of Values.
- Click Dynamic List of Values.
- In the Name field, enter <YourName>_REGION_LOV.
- From the Default format list, choose Combo box.
- From the Show Null Value list, choose Yes.
- In the SQL Query field, enter something like this:
select region_name, region_id
from <DEMO_SCHEMA>.HLW_REGIONS
Note: You must replace <DEMO_SCHEMA> with the schema where the objects for the demos in this book are installed
- Click OK.
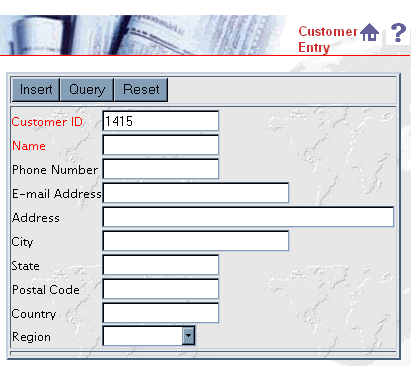
3.6.3 Create a customer entry form
In this section, you will create a form where salespeople within the Healthy Living company can enter new customers, or update existing customers' information.
- In the Navigator, click the Applications tab. The objects for Casebook30_Application should display.
Note: If Casebook30_Application does not display, navigate to it using the links at the top of the page.
- Next to Create New, click Form.
- Click Form based on table or view.
- In the Name field, enter <YourName>_CUSTOMER_ENTRY_FORM.
- In the Display Name field, enter <YourName> Customer Entry Form.
- In the Application field, make sure Casebook30_Application is chosen.
- Click Next.
- In the Table or View field, enter <DEMO_SCHEMA>.HLW_CUSTOMERS.
Note: DEMO_SCHEMA is the name of the schema where the demo schema objects are installed.
- Click Next.
- Select the Tabular radio button.
- Click Next.
- In the left pane, under FORM, you should see a list of table columns. If you do not see anything listed under FORM, click
 , next to FORM.
- Next to each of the following items, click
 to remove the item from the form, then click OK to accept the dialog:
- PASSWORD
- GENDER
- AGE
- INCOME
- CURRENCY
- CREDIT_CARD_OWNER_NAME
- CREDIT_CARD_TYPE
- CREDIT_CARD_NUMBER
- CREDIT_CARD EXPIRATION_DATE
- ADDRESS_LINE2
- INSERT_BOTTOM
- UPDATE_BOTTOM
- DELETE_BOTTOM
- QUERY_BOTTOM
- RESET_BOTTOM
- At the top of the left pane, click FORM to display the Form-Level properties for the form.
- In the right pane, under Form Level Options, choose World from the Box Background Image list.
- From the Box Border list, choose Thick Border.
- Clear the Show Timing check box.
- From the Order by list, choose ID, then make sure Ascending is chosen.
- In the left pane, click ID to display the Item Level Options for ID.
- In the right pane, in the Label field, enter Customer ID.
- Under Validation Options, in the Default Value field, enter #<DEMO_SCHEMA>.<YourName>_NEW_CUSTOMER.nextval.
Note: DEMO_SCHEMA is the name of the schema where the schema objects are installed. Also, entering a default value tells this item to base the customer ID number on the database sequence you created in Section 3.6.1, "Create a database sequence".
- In the left pane, click PHONE_NUMBER to display its properties.
- In the right pane, in the Label field, enter Phone Number.
- In the left pane, click EMAIL_ADDRESS to display its properties.
- In the right pane, in the Label field, enter E-mail Address.
- In the Input Width field, enter 25.
- In the left pane, click ADDRESS_LINE1 to display its properties.
- In the right pane, in the Label field, enter Address.
- In the Input Width field, enter 40.
- In the left pane, click CITY.
- In the right pane, in the Input Width field, enter 25.
- In the left pane, click POSTAL_CODE.
- In the right pane, in the Label field, enter Postal Code.
- In the left pane, click REGION_ID.
- In the right pane, choose ComboBox from the Item type list.
- In the Label field, enter Region.
- In the List of Values field, choose <YourName>_REGION_LOV.
- Click Finish. Since this form will be accessed via the menu you create in Section 3.8, "Create a menu containing links", you do not need to publish it to the portal.
Note: You can always go back and change the Input Width for each of the fields, depending on the data you are using.
3.7 Create a product report
The steps in this section help you create a report that lists all the products contained in the database. In Section 3.8, "Create a menu containing links", you create a menu portlet that enables users to access this report via a link. You can skip this section if you've already created a report.
You will also use the customization form to allow users to customize the report. The details you specify on this form display when users click the Customize link in the portlet. This way, you can control the default data that displays on the portal page, but users can narrow the report results using the form you create.
- In the Navigator, click the Applications tab.
- Click Casebook30_Application.
- Next to Create New, click Report.
- Click Reports From Query Wizard.
- In the Report Name field, enter <YourName>_PRODUCT_LISTINGS.
- In the Display Name field, enter <YourName> Product Listings.
- In the Application field, make sure Casebook30_Application is chosen.
- Click Next.
- In the Table or Views field, enter <DEMO_SCHEMA>.HLW_PRODUCTS.
Note: DEMO_SCHEMA is the name of the schema where the demo schema objects are installed.
- Click Add. The table displays in the Selected Tables/Views list.
- Click Next.
- In the Columns list, select the following columns (in Windows, you can press CTRL and click to select multiple columns):
- HLW_PRODUCTS.ID
- HLW_PRODUCTS.NAME
- HLW_PRODUCTS.PRICE
- HLW_PRODUCTS.DESCRIPTION
- Click
 to move the selected columns to the Selected Columns list.
- In the Selected Columns list, click HLW_PRODUCTS.PRICE.
- Click
 to move this column to the end of the list.
- Click Next.
- On the Column Conditions page, click Next.
- On the Report Layout page, make sure the Tabular Layout radio button is selected, then click Next.
- Next to HLW_PRODUCTS.ID, change the Column Heading from Id to Product #.
- Next to HLW_PRODUCTS.ID, from the Align list, choose Left.
- Next to HLW_PRODUCTS.DESCRIPTION, from the Width Type list, choose Char.
- Next to HLW_PRODUCTS.DESCRIPTION, in the Width field, enter 90.
- Next to HLW_PRODUCTS.PRICE, in the Format Mask field, enter $999,999.99.
- Click Next.
- On the Formatting Conditions tab, click Next.
- Under Full Page Options, choose Thin Border from the Border list,.
- From the Heading Background Color list, choose Green, Pale.
- Under Portlet Options, change the Heading Background Color to Green, Pale. Change the border to Thin Border.
- Under Row Order Options, choose HLW_PRODUCTS.ID from the Order By list, then choose Ascending.
- Click Next.
- On the Customization Form Display Options tab, click Next.
- In the Header Text field for the report, enter <CENTER>.
- In the Footer Text field for the report, enter </CENTER>.
- Click Finish.
- In the Manage Components dialog, click Access.
- Select the Publish to Portal check box.
- Click Apply.
- Click Develop.
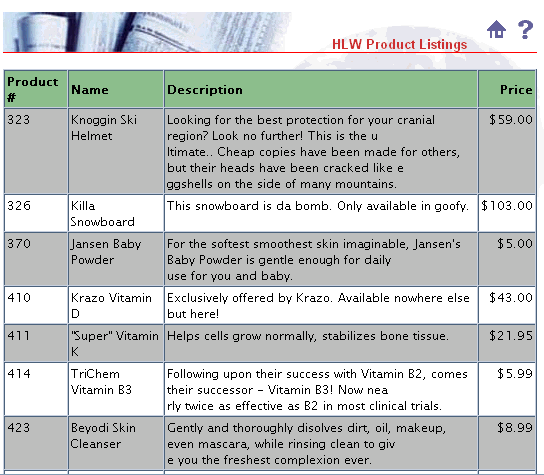
- Click Run. The report that displays should look something like this:
3.8 Create a menu containing links
In this section, you will create a menu that provides access to various components you've created, such as the Customer Entry Form. Creating menus provides a way of organizing components, folders, and HTML pages in Oracle Portal that users want to easily access from the portal.
3.8.1 Create two links for your menu
Before you create a menu, you must create the links that the menu will hold. When the user clicks these links, the corresponding component, page, or item will display.
- In the Navigator, click the Applications tab.
- Click Casebook30_Application.
- Next to Create New, click Link.
- In the Link Name field, enter <YourName>_PRODUCT_REPORT.
- Click Next.
- Select the Oracle Portal Component radio button.
- In the Target Component or URL field, enter Casebook30_Application.<YourName>_PRODUCT_LISTINGS.
Note: This field is case-sensitive.
- Click Finish.
- In the Manage Component dialog, click Access.
- Make sure the Inherit Privileges from Application check box is selected.
- Click Close.
- Follow steps 3 through 11 to create a second link with the following details:
- Name = <YOURNAME>_ADD_NEW_CUSTOMER
- Target Component or URL = Casebook30_Application.<Your_Name>_CUSTOMER_ENTRY_FORM
When you've finished, your links should display in the Navigator.
3.8.2 Create a menu
In this section, you will create a menu with links to the Product Report and Customer Entry Form you created in this chapter. This menu uses the links you created in Section 3.8.1, "Create two links for your menu".
- In the Navigator, click the Applications tab.
- Click Casebook30_Application.
- Next to Create New, click Menu.
- In the Menu Name field, enter <YourName>_SALES_MENU.
- In the Display Name field, enter <YourName> Sales Menu.
- In the Application field, make sure Casebook30_Application is chosen.
- Click Next.
- On the Menu Items and Submenus tab, make sure My Menu is highlighted in the left pane.
- In the Name field, enter <YourName> Sales Menu.
- Next to My Menu in the left pane, click
 .
.
Note: The menu name updates when you click
 .
.
- Make sure MENU_ITEM_1 is selected in the left pane.
- In the Name field, enter Product List Report.
- In the Bullet Icon field, enter sql.gif.
- Next to the Link field, click
 .
.
- In the Search window, find <YourName>_PRODUCT_LISTINGS (SHOW) (the first link you created in Section 3.8.1, "Create two links for your menu").
- In the Description field, enter:
- Check out the latest information from our product listing report. Here, you can view complete pricing information.
- From the Font Face list, choose Arial.
- In the left pane, next to Sales Menu, click
 .
.
- In the Name field, enter Customer Entry Form.
- In the Bullet Icon field, enter sql.gif.
- In the Link field, click
 .
.
- In the Search window, click <YourName>_CUSTOMER_ENTRY_FORM (SHOW) (the second link you created in Section 3.8.1, "Create two links for your menu"). The link should display in the Link field.
- In the Description field, enter:
If you have a new customer, you can enter information into the database using this customer entry form.
- From the Font Face list, choose Arial.
- Click Finish.
- In the Manage Component dialog, click Access.
- Select the Publish to Portal check box.
- Clear the Inherit Privileges from Application check box.
- Click Apply.
- Click Develop.
- Click Edit.
- Make sure Sales Menu is selected in the left pane.
- Under Common Options (you may have to scroll down the right pane to find this heading), clear the following check boxes:
- Show Timing
- Show Find Option Button
- Log Activity
- In the left pane, click Product List Report.
- Click OK.
- In the Manage Component dialog, click Run. The menu displays like this:
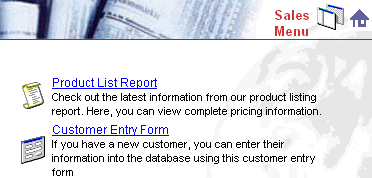
Try clicking the links to make sure the Product Report and Customer Entry Form both display.
3.8.3 Add the menu as a portlet
- In the Navigator, click the Pages tab.
- Navigate to <YourName> Inside Healthy Living.
- Click Edit.
- Make sure the Sales tab is highlighted.
- In the left region, click
 .
.
- In the Portlet Repository list, find the Sales Menu and click
 to add it.
- Click OK.
- Click Close.
- Display the page in your browser. The final portal should look something like this:
3.9 Summary
Congratulations! You have created an intranet portal specific to a line of business, and added different types of portlets to it. You now know how to:
- Create a page.
- Add a folder as a portlet.
- Create a report using the Report Based on a SQL Query.
- Create a chart containing links to a report
- Create a multi-tabbed portlet containing three charts
- Create a multi-tabbed portlet containing three views of the same data (report, chart, and form)
- Create a customer entry form containing:
- static list of values
- dynamic list of values
- a dynamic list of values that depends on a static list of values
- Create a report using the Report from Query Wizard.
- Create a menu containing links
- Create a bind variable list of values
For more information about creating a portal and using portlets, see the Oracle Portal Online Help.
 to add a tab to the page.
 to add another tab to the page.
 to edit the tab name.
 to edit the tab name.
 to add a portlet.
 to add the page as a portlet.

 .
.
 to add the folder as a portlet.

 to move all the columns to the Selected Columns list.
 and
and
 to reorder the columns, so that they display like this:

 .
.


 to add a new region.
 .
.

 to add a row to your new column.
 to add a tab to the region.

 .
.
 .
.
 .
.
 .
.
 .
.


 to move the column to the Selected Columns list:

 next to FORM.
 to remove the item from the form, then click OK to accept the dialog:
 until DEPARTMENT_NO displays above EMPLOYEE_ID.


 , next to FORM.
 to remove the item from the form, then click OK to accept the dialog:

 to move the selected columns to the Selected Columns list.
 to move this column to the end of the list.

 .
.
 .
.
 .
.
 .
.
 .
.

 .
.
 to add it.

