Release 9.0.1
Part Number A88749-02
 Home |
 Book List |
 Contents |
 Index |
 Master Index |
 Feedback |
| Oracle Enterprise Manager Getting Started with the Oracle Standard Management Pack Release 9.0.1 Part Number A88749-02 |
|


Oracle Performance Manager is an Oracle Enterprise Manager application that allows you to monitor the performance of the database and its related applications and operating systems in real time. It allows system and database administrators to monitor performance statistics for Oracle database servers, web servers, Oracle concurrent managers, operating systems, and other managed targets. Performance Manager also allows you to record statistics and play them back at a later time.
You can display these statistics in a number of formats including horizontal and vertical tables, strip charts, horizontal and vertical bar charts, and pie charts. You can also drill down for more detail on some predefined charts.
For most targets, Performance Manager integrates Event system thresholds with charts so that events and charts share common performance thresholds you can set from either monitoring point. This provides consistent monitoring of thresholds across Enterprise Manager and allows access to graphical and historical diagnostics information from the Event system. You can investigate event notifications by launching charts, historical data and diagnostic advice directly from the Event Viewer. Performance Manager charts incorporate event notification through chart threshold state indicators. Performance Manager threshold and event features are available for node and database data.
You can use activity diagnostic charts such as TopSessions for finding and troubleshooting high impact sessions. These charts provide graphical performance data to help you diagnose a problem session or SQL statement.
Oracle Performance Manager uses the Intelligent Agent (Agent) to collect performance data. To monitor some types of data, you must install the Agent on the system (or systems) where you want to monitor data. See the Oracle Intelligent Agent User's Guide for information on managing the Agent on a system.
If you are using Oracle Performance Manager to monitor database performance, the Agent can be installed on another system. See "Accessing Performance Data Through an Intermediate Host" for more information on accessing data through an Agent on another system.
The types of performance data that Oracle Performance Manager can monitor on a system depends on the products that are installed. Table 3-1 shows the types of data (or targets) that Oracle Performance Manager can monitor when various Oracle products are installed.
If additional products from Oracle or other vendors are installed, Oracle Performance Manager may be able to monitor additional types of data not shown in Table 3-1.
Oracle Performance Manager relies on the Agent to monitor a target (such as a node, a database, or a concurrent manager). Usually, the collection of the data is done on the system where the target is located. However, for some types of targets Oracle Performance Manager can also monitor data on a system by using the Agent on another system (an intermediate host).
This intermediate host could be the client system where the Oracle Performance Manager is running, or any other system on the network on which the Agent is available.
There are three ways to set the location of the Agent. The method you use depends on how you connect to the target. Consider the following three scenarios:
Performance Manager attempts to connect to the Agent on the host where the target is located. If this connection fails or cannot be attempted because no preferred credentials have been set for the target, you can use the Connection Details dialog box to specify logon credentials for the target. This dialog box also contains a field to specify the location of the Agent that will be used to collect performance data.
Performance Manager displays a Logon dialog box. You can use the Connection Details dialog box to specify the location of the Agent that will be used to collect performance data.
Performance Manager displays the Logon dialog box for the selected target. Use the Connection Details dialog box to specify the location of the Agent that will be used to collect performance data.
Using Oracle Performance Manager, you can:
You can start Oracle Performance Manager from the Oracle Enterprise Manager console, from the UNIX command line, or from the Windows Start menu.
You can start Oracle Performance Manager from the Oracle Enterprise Manager console in any of the following ways:
To start Performance Manager from the UNIX command line, set default to the ORACLE_HOME/bin directory, then type the following command:
./oemapp pm
When you start Performance Manager from the UNIX command line, you are given a choice of logging in to the Oracle Management Server and running Performance Manager in Enterprise mode or Standalone mode.
See "Running Performance Manager in Enterprise Mode" and "Running Performance Manager in Standalone Mode" for more information about running Performance Manager in Enterprise mode and Standalone mode.
On the Start menu of Windows NT, follow the path: Start=>Programs=>ORACLE_HOME=>Standard Management Pack=>Performance Manager.
When you start Performance Manager from the Start menu, you are given a choice of logging in to the Oracle Management Server and running Performance Manager in Enterprise mode or Standalone mode.
To run Oracle Performance Manager in Enterprise mode:
To select an alternate Management Server, click the Management Server button next to the Management Server drop-down list. In the resulting dialog box, you can add another node that is running Oracle Management Server software. The Oracle Management Server and its associated repository must already exist.
For information on the fields in the Management Servers dialog box, click Help.
|
Note: If the repository was created using Enterprise Manager Release 2.1 or earlier, you must upgrade the repository or create a new repository. For more information, see the Oracle Enterprise Manager Configuration Guide. |
When Performance Manager is running in Enterprise mode and the navigator is first displayed with a target type folder expanded, the targets of that type that were discovered in the Enterprise Manager console are displayed. When you expand a target, Performance Manager attempts to connect to the target. When the target is a database and preferred credentials for the database have been saved in the Oracle Enterprise repository, Performance Manager attempts to connect to the database using those credentials. Otherwise, the Oracle Database Logon dialog box prompts you for the logon information.
To run Oracle Performance Manager in standalone mode (not connected to the Oracle Enterprise Manager repository), click Standalone, no repository connection, then click OK.
When Performance Manager is running in Standalone mode Performance Manager displays any targets that were added to the console in Standalone mode. You can add nodes or databases to the collection view for the current standalone mode session only. Click on the Add Service toolbar button after selecting the folder for the desired target type.
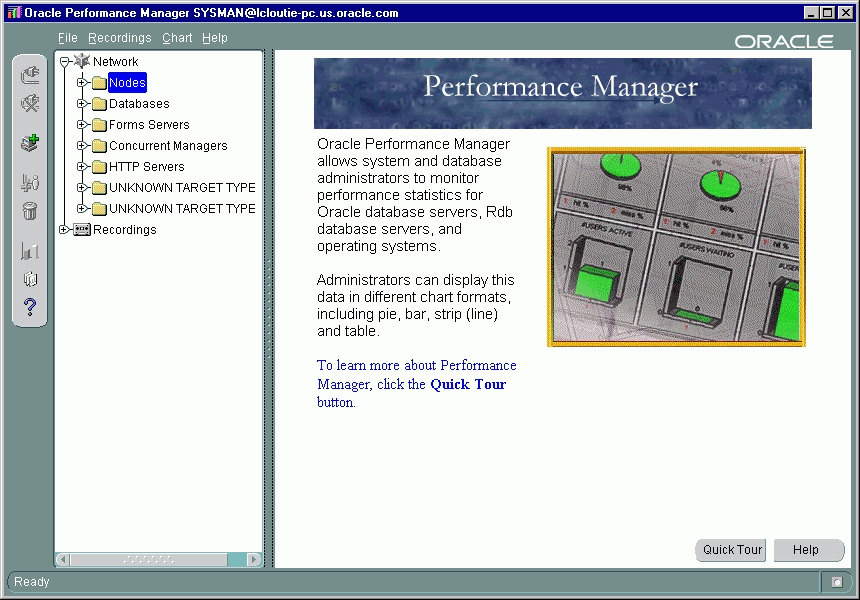
The primary component of the Oracle Performance Manager user interface is the main window (see Figure 3-1), which contains two panels. The navigator or tree panel appears on the left side of the main window and the property sheet panel appears on the right side. When you select an item in the navigator panel, the property sheet panel displays the properties of the selected item.
When you first start Oracle Performance Manager, the navigator panel displays the target type folders and the property sheet panel displays the Performance Manager welcome screen.
A vertical toolbar appears on the left side of the window and a menu bar appears across the top of the window. For more information about the buttons in the toolbar and the commands available from the Performance Manager menus, choose Window from the Performance Manager Help menu.
In the navigator panel, the Network folder contains a folder for each target type. For example, when you have the Standard Management Pack installed, the target types are Nodes, Databases, and SQL Servers. Not all target types may be available on all systems.
In addition to the Network folders, the Recordings folder contains any recordings of chart data that exist. For more information about the Recordings folder, see "Recording Chart Data" .
Expand a target type folder to view the corresponding targets previously discovered through the Oracle Enterprise Manager console.
To connect to a discovered target, select the target in the navigator tree and click Connect to service in the Performance Manager toolbar, or click the plus sign (+) next to the target in the navigator. You can also connect to the target by double clicking on it in the navigator tree . You may be prompted with a Logon dialog box if credentials are required to connect to the target. For information on the fields in the Logon dialog box, click Help.
You can manually add additional targets that have not been discovered using the Enterprise Manager console.
To add and connect to a target manually:
Performance Manager displays a Logon dialog box.
For information on the fields in the Logon dialog box, click Help.
After you connect to a target, Performance Manager displays the classes of performance information you can monitor for the selected target. Expand a class to see the individual performance data charts available for the selected class.
You can display a chart using one of the following methods:
Performance Manager displays each chart or chart group in its own window, which is separate from the main window. This window is called the Chart Display window. For more information, see "Using the Chart Display Window" .
You can view charts from multiple targets concurrently by connecting to the targets from the navigator tree and displaying charts.
Some types of data include a chart group, which is two or more charts that are displayed within a single Chart Display window. You display a chart group the same way as you view any other chart (see "Viewing Performance Manager Charts").
You can display a special chart group that contains the Overview Charts for a selected target:
Performance Manager displays a chart group containing some key statistics most likely of interest to database administrators monitoring the selected target.
Charts in a chart group are displayed within a single window. You perform actions, such as setting options and displaying drilldown charts, on one chart at a time within a chart group. The currently selected chart within a chart group window is identified by a highlighted title or a black box. For example, the Memory Faults chart is the currently selected chart in Figure 3-2.
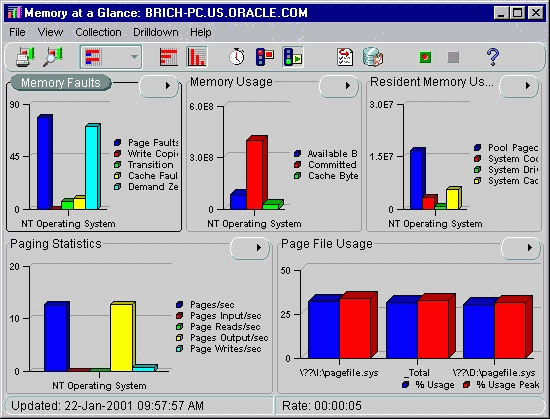
Besides viewing the Overview Charts for a selected target, you can also view a chart group provided with a data class. For example, you can select the Memory data class for a Windows NT node and display the Memory at a Glance chart group. Not all data classes provide chart groups, however.
For some charts, the chart's property sheet allows you to select the collected data to display and the data sources for which the collected data should be displayed.
The collected data are the statistics that can be monitored and displayed in the chart. The data sources are the items from which Oracle Performance Manager is able to collect the data. For example, the data source of disk statistics may be disk1 or disk2, and the data source of file statistics may be file1 or file2.
By clicking in the column next to the name of the collected data or the name of the data source in the chart property sheet, you can specify whether or not to monitor that collected data or data source and display it in the chart.
When a green check mark appears in the column, Oracle Performance Manager will display that collected data or data source in the chart. If you click in the column again, the check mark goes away, which indicates that Oracle Performance Manager will not display that collected data or data source. You can toggle back and forth between monitoring and not monitoring all the collected data or data sources by clicking in the column head. If the check mark is gray, it means Oracle Performance Manager will display the collected data or data source, and you are unable to change the selection of this data.
If the chart definition contains default data source or collected data attributes, then those items are preselected in the chart's property sheet.
When you display a chart, Oracle Performance Manager opens the Chart Display window. The window contains its own toolbar and menu bar. For information about the Chart Display window, choose Window from the Chart Display window Help menu.
To change the format of the chart, click on the Chart Format button in the Chart Display window toolbar and select the format in which you want to display the chart from the list that displays.
For example, suppose a chart initially displays as a bar chart. To see the data as a pie chart, choose Pie Chart from the list that displays when you click on the Chart Format button in the toolbar. You can also display a chart in one of the additional formats:
You can also choose a chart format from the View menu in the Chart display window or right mouse click on a chart and select a chart type from the context menu. For more information about the buttons on the Chart Display window toolbar, see the Oracle Performance Manager online help.
|
Note: Depending upon the type of chart you are displaying, one or more of the chart formats may not be available. |
By default, most charts are set to refresh every fifteen seconds but vary based on the chart. That means that Performance Manager collects the data every fifteen seconds and then immediately refreshes (or redisplays) the chart using the new data.
To change the refresh rate for the current chart:
Performance Manager displays the Refresh Rate dialog box.
You can also choose Refresh Rate from the Collection menu to change the refresh rate.
By default, Performance Manager continues to collect performance data and update the current chart using the current refresh rate.
To pause a chart so it stops redisplaying based on the refresh rate, click the Pause Chart button in the Chart Display toolbar.
To restart the chart, click the Resume Chart button in the Chart Display toolbar.
After you display a chart in the Chart Display window, you can still modify the collected data and data sources for the chart. For more information about selecting the collected data and data sources before you display a chart, see "Selecting Collected Data and Data Sources".
To set the chart options:
Performance Manager displays the Options dialog box.
For more information on selecting data sources and selecting collected data, click Help.
You can also access the Options dialog box by choosing Options from the Collection menu.
Oracle Performance Manager also allows you to select filters to limit the data collected for a chart. However, not all charts provide filters. For charts that allow you to filter the chart data, you can select a limit to the number of data sources that are displayed. For example, if the data sources are the processes on an operating system, you can modify the chart to display only 10 processes, rather than all the processes.
For example, to select a limit to the number of data sources that are displayed for the Pagefaults Per Session chart, do the following:
You can locate the chart by traversing the tree as follows: Network=>Nodes=><Name of Node>=>Process=>Pagefaults Per Process.
The 10 data sources will be sorted by Page Faults per second, as shown in the Sort the data by drop-down list.
Performance Manager displays the chart, but includes a maximum of 10 data sources.
You can later change this setting after the chart is displayed:
These options can be useful for finding the top resource users. In the case where processes are the data sources and the data collected is memory usage and CPU usage, you can ask the Agent to limit the number of data sources to 10, and to sort by memory usage. Your chart would then show the 10 processes using the most memory. If you were to sort by CPU usage, you would get the 10 processes using the most CPU instead.
Some charts can also give different views of the data. If that feature is available, you will also be able to select a view of the data. An example of a data view may be the current rate per second or current rate per transaction for each piece of data collected in the chart.
Some types of charts have their own unique commands. For example, you can select the Kill Session command when you are viewing the Lock Manager charts for Oracle database targets, or Turn SQL Trace On if you are viewing a Top Sessions chart.
To see if a chart-specific command is available for a chart:
Some charts have drill-down charts associated with them. To see if any drill-down charts are available for the current chart, do one of the following:
In all cases, Performance Manager displays any drill-down charts associated with that chart item as menu options on the Drilldown menu. If a list of drill-down chart names is not displayed, no drill-down charts are associated with that item.
|
Note: If you have trouble selecting a particular data item when you try to drill down for related data, pause the chart or reduce the refresh rate. For more information, see "Pausing and Restarting a Chart". |
You can use the Chart Status button located in the upper right corner of a chart to perform one of several tasks. When you click on the button, menu items appear based on the context of the chart as seen in Figure 3-3.
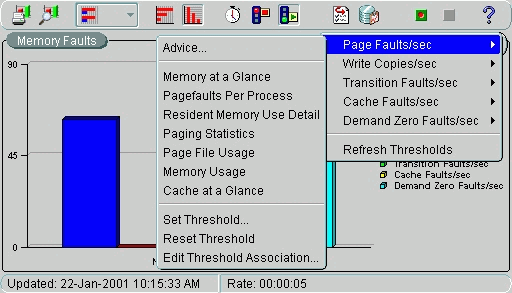
The Chart Status button displays the current status of thresholds for metrics in the chart. If an indicator flag is present, at least one of the metrics on the chart has thresholds defined. The most severe threshold displays on the button. A green flag indicates that no metrics have crossed a threshold, a yellow flag indicates that at least one metric has crossed a warning threshold, and a red flag indicates that at least one metric has crossed a critical threshold. When you press the Chart Status button, you can view the status of individual metrics within the chart. If several metrics have crossed warning or critical thresholds, the menu items are sorted according to the severity, with the indicators for the most severe items on top and the less severe on the bottom.
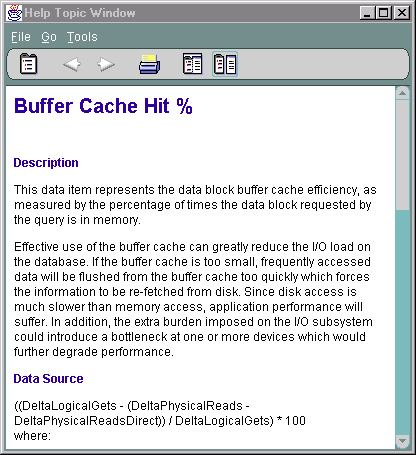
When you choose Advice from the Chart Status button, Performance Manager displays an information window that provides information about the currently selected data item along with guidelines for solving existing problems, or suggestions about other charts to view for further diagnosis, as seen in Figure 3-4.
|
Note: In addition to accessing help topics for individual metrics and events through the Advice function, you can view the full documentation set for all types of metrics and events independently through your web browser. For more information see "Viewing Metric and Event Documentation Through a Browser" . |
After you select a data item, you can choose to drill down to one of the charts displayed in the list or invoke tools like SQL Analyze.
You can set chart-only thresholds for a data item or you can reset the chart-only threshold to its default value. You can choose to set or edit the threshold for the value in the chart only, or you can edit or register an event threshold for the data item. For more information, see "Registering Events in Performance Manager".
You can edit a threshold association for a metric by selecting Edit Threshold Association from the Chart Status button and choosing an event from the dialog box that appears. For more information, see "Editing Threshold Associations".
To view Event System changes made while a Performance Manager chart is visible, choose Refresh Thresholds from the Chart Status button menu on the Performance Manager chart. For more information, see "Refreshing Thresholds".
You can display bar charts and tables with either a horizontal or vertical orientation.
To change the orientation of the bar chart or table, click the button associated with the orientation that you want.
When a chart is displaying data in table format, the sort order of the column data can be changed by clicking the column headers in the table. The first click on a column header sorts the data in ascending order, and a second click sorts the data in descending order.
Changing the sort order in the chart table does not affect the data's sort order on the server. To change the sort order of the data on the server, use the Options page. For more information, see "Selecting Chart Options".
If you are working in repository mode and you make modifications to a chart (for example, if you change the format, orientation, or sorting order of a chart), you can save your changes in one of two ways:
Performance Manager saves your changes using the same name as the original chart. When you display the chart again, your changes will appear in the Chart Display window.
To later remove your changes and display the predefined chart using its original settings, click Remove Chart on the Chart menu.
Performance Manager displays the Save Custom Chart dialog box. Use this dialog box to enter a name for the custom chart and to indicate whether you want to create a similar chart for other targets of the same type. For information about the fields on the Save Custom Chart dialog box, click Help.
Click OK in the Save Custom Chart dialog box to save the custom chart using the name you provided. Performance Manager saves the chart in the Custom Charts folder for the selected target.
To delete a custom chart from the Custom Charts folder, select the chart and click Remove Chart on the Chart menu.
To get help on a class or chart:
If help is available for the selected chart, Performance Manager displays a message box or a help topic window describing the chart data.
To get help on a data item:
To print a chart, click the Print Screen button on the Display Chart window toolbar.
The size of the chart on the screen determines the size of the chart in the chart printout. For example, when you print a chart that is 5 inches high and 7 inches wide on your screen, the chart will be 5 inches high and 7 inches wide in the printout.
To generate an HTML report for a chart:
Performance Manager displays a dialog box that tells you the name of the HTML file used to display the report and where the file will be saved.
You can view the report later using a Web browser, or--if you have experience with Web publishing tools and techniques--you can share the report with your co-workers by publishing the HTML file and its associated graphic files on a Web server.
Oracle Performance Manager allows you to record the data being monitored in a chart. After a recording is complete, you can play it back. During playback, you can pause and fast forward the recording, if you wish.
Chart recordings are saved under the Recordings folder and on the Recordings tab of the right pane of the Performance Manager main window when a recorded chart is selected. The Recordings tab is added to a chart's property sheet after you record the chart.
You can manage chart recordings in the Recordings folder without connecting to the target from which a chart was recorded. If you are already connected to a target, you can see a chart's recordings by selecting the Recordings tab in that chart's Detail property sheet.
You start a recording by performing one of the following steps:
Oracle Performance Manager displays the Recording Parameters dialog box. For more information on the fields in the Recording Parameters dialog box, click Help.
To stop recording a chart, do one of the following:
|
Note: Before you can play a recording, you must stop the recording. For more information, see "Stopping a Recording". |
To play a recording, do the following in the Performance Manager main window:
The Stop Playback, Pause Playback, and Fast Forward buttons become available in the playback window (Figure 3-5). When the playback is complete, the Reset Playback button becomes available.
To remove a recording:
In addition to predefined charts, you can define your own charts for database targets based on user-defined scripts. By defining your own charts, you can take a snapshot of data at any given interval. After successful evaluation of the script, you can define the operations to be performed on the data.
|
Note: The Performance Manager online help includes an example of creating a user-defined chart. Search for Example in the online help index. |
To define a new chart:
The resulting New Chart property sheet includes the SQL Script Command page and the Data Items page.
Performance Manager evaluates the SQL script. If the script is valid, Performance Manager displays the Data Items page.
You can remove columns and change the names of the columns. You can also define new columns with data calculated from existing columns. For more information, see "Modifying the Data Items for a User-Defined Chart".
To modify an existing chart you perform the same steps as outlined in "Creating a User-Defined Chart". The only exception is that the chart label is already defined.
|
Note: To add or modify data items to user-defined charts, you must use the Agent release 8.1.6. or later. |
To modify an existing chart:
On the SQL Script Command page, you can modify the script used to gather statistics for the chart. On the Data Items page, you can remove, add, or modify the data items associated with the chart. For more information, see "Modifying the Data Items for a User-Defined Chart".
When you select a user-defined chart and then display the Data Items page, you can modify the data items for the chart as follows:
A key icon appears next to the data item you designate as the data source. The data source is the object about which Performance Manager is able to collect the data. You must designate one of the data items as the source for the user-defined chart. To designate a data item as the data source, highlight the data item you want as the data source and click this button. By default, the first data item is set as the data source.
Performance Manager removes the data item from the Data Items page.
Performance Manager displays the Add/Modify Chart Columns dialog box. For more information about this dialog, click Help. The Oracle Performance Manager Help provides details on the functions and operations available. The Help also provides an example of creating a user-defined chart.
You can copy user-defined charts from one target to another or within the same serve by using the Create Like option. To copy a user-defined chart:
Performance Manager displays the Create Like User-Defined Chart dialog box.
Note that chart labels must be unique within a target.
In the Create Like User-Defined Chart dialog box, you can choose the SQL Script Command or Data Items page to view the attributes of the chart you are copying. However, you cannot change the values of the attributes. Once the chart has been copied, you can select the new chart in the navigator tree and make any desired adjustments.
If you created user-defined charts using Oracle Performance release 1.5.0 or earlier (the Windows versions of Oracle Performance Manager), you can convert these user-defined charts so that they can be used with Oracle Performance Manager release 2.1. See "Converting User-Defined Charts From Previous Releases of Performance Manager" for information on how to perform the conversion.
Table 3-2 lists the Chart Display Window menu and submenu items along with their corresponding shortcut keys.
You can create and edit threshold values from both the Oracle Enterprise Manager console and Performance Manager.
|
Note: The Performance Manager threshold and event features described in this section are available only for node and database data. |
From Performance Manager, you can create and edit a Chart-only threshold, create and register an event, reset a Chart-only threshold, or edit a registered event. From the Enterprise Manager console, you can create, edit or deregister an Enterprise Manager event but you cannot edit or view Chart-only thresholds.
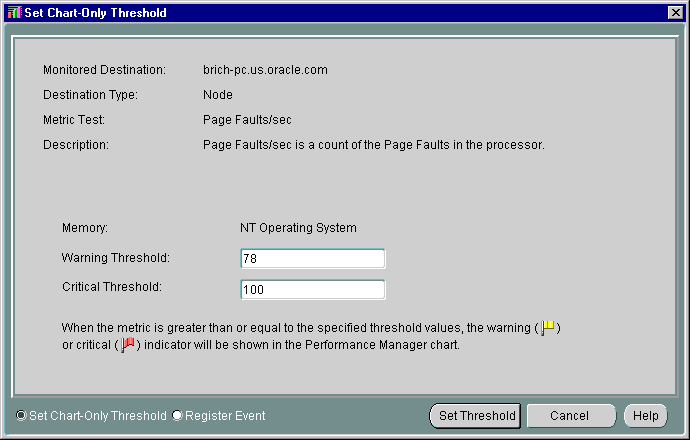
You can set thresholds on data items by using event tests or by setting a threshold for a data item in a chart (Chart-only threshold) using the Set Chart-only Threshold dialog box seen in Figure 3-6. When you monitor a chart that contains a data item that supports a threshold established for an event, you can edit the parameters for that event by choosing Set Threshold from the Chart Status button.
When you create events from Performance Manager, the event is initialized with the context defined by the Performance Manager chart. You can only modify the event tests in an event if the event was registered using the Oracle 9i Agent.
If a data item supports the concept of an event, the chart displays a visible indicator (a flag) based on thresholds stored in the repository for that data item. If the data item does not support the concept of an event, you cannot establish a chart-only threshold for the data item. Every metric-based event test can have a warning and a critical threshold value. The flag indicators on a chart specify whether a threshold value has crossed a warning or critical threshold. The flag that appears on the Chart Status button in a chart displays the most serious state of any contained metric thresholds, and the metrics that appear when you click on the Chart Status button are sorted with the most serious indicators displayed first in the list.
Threshold values may be derived from one of three sources:
The threshold types listed above apply to metrics in a specific order of precedence:
Threshold values are stored in the Oracle Management Server respository and are updated whenever the user sets or edits a Chart-only threshold or when Event registration changes occur. Chart-only thresholds are removed from the repository when you invoke Reset Threshold or when the Administrator is removed from the system. If you create a Chart-only threshold that is later overridden by the registration of an event, the Chart-only threshold remains in the repository. If the association between the metric and the event is later broken, the Chart-only threshold is restored.
To set or edit thresholds in Performance Manger:
If there is more than one data source displayed in a chart when you select Set Thresholds, Performance Manager displays the Select Data Source dialog box where you must choose a single data source for which to set a threshold. When you create or edit a chart-only threshold or create a new event, you must choose a single data source before setting thresholds.
To register or modify an event, select Register Event and then complete the fields in the General, Test, Parameters, Schedule, Access and Fixit Jobs pages of the event property sheet. If you are using a pre-9i Agent and you modify an event that has been registered, those changes are not used by the registered event.
Events and thresholds often poll at different intervals. For example, events may be polled at intervals of minutes or even hours, while thresholds may be sampled in seconds. The result is that you could see a metric cross a threshold in a chart but not be notified of an event simultaneously. If the problem were caused by a spike, the threshold may be crossed in the chart with a sampling occurrence measured in seconds, but not trigger an event because the metric is sampled in minutes or hours, meaning the event is never triggered at all.
Additionally, events can include the concept of occurrences. Occurrences prevent notification for erratic or one-time instances of a threshold being crossed. If an event has a number of occurrences associated with a test, you may see the threshold crossed in a chart but never see the corresponding event triggered.
If you attempt to modify a threshold that has an associated event test registered for multiple targets, a warning displays indicating that the change you make will affect the event test for multiple targets and that if you want to use different thresholds for each target, you must create separate events. If you continue with the change, the existing event is deregistered for all targets and re-registered for all targets with the new threshold.
When you display a chart for a data item for which there are multiple event tests, a message is displayed indicating that there are multiple tests for the same metric. To show a threshold for the chart, you must select which event test to associate with the metric. If you then modify the associated event test or the metric in the chart, the thresholds are synchronized. Other tests of the metric are not affected by changes to the threshold in a chart.
If another user de-registers the associated event test and then you display a chart with that metric, a warning displays indicating that the previously associated event test no longer exists. If only a single event test remains for the metric, the message indicates that the remaining event is now associated with the metric. If more than one event remains, the message indicates that you must select a new event to associate with the metric.
If you add a new event test for a metric where a single chart-only threshold already exists, the thresholds associated with the previous test will not be used during monitoring.
If you display a chart for which you have read-only permission for the corresponding event, you cannot modify the thresholds for that chart. You receive a read-only view of the event indicating that if you wish to change the thresholds associated with the data item, you must be granted appropriate access to the event system.
|
Note: Super-users who set up permissions on an event should consider the effect on non-privileged administrators who will be unable to modify the thresholds. |
You can register events from within Performance Manager through the Chart Status button on a chart containing the data item for which you want to register an event.
Registering events through Performance Manager is procedurally identical to registering events through the Enterprise Manager console.
To create or edit events in Performance Manager:
If there is more than one data source displayed in a chart when you select Set Threshold, Performance Manager displays the Select Data Source dialog box where you must choose a single data source for which to set a threshold. When you create or edit a Chart-only threshold or create a new event, you must choose a single data source before setting thresholds.
When you use a pre-9i Agent, the property sheet for creating a new event is similar to the property sheet for modifying an event. Some fields are editable while others are not. If you are using a 9i Agent, you can modify many more fields.
You can use several predefined event tests that have been installed with Oracle Enterprise Manager.
If you attempt to register a 9i event with a pre-9i Agent, you will receive an error message indicating that you cannot register the event. You can use only a 9i Agent to register 9i events.
If there exists both a 9i and pre-9i version of the same event, then the Oracle Management Server will determine which to use depending on the Agent version. For example, if there is a 9i Agent, the Agent will request registration using the 9i version of the event. If the Agent is pre-9i, then it will use the pre-9i version.
If you have migrated from a pre-9i Agent, then an existing event will not automatically use the 9i counterpart. To use the 9i test and access thresholds in the repository, you must deregister the pre-9i event and register the 9i event using the 9i Agent.
If a Performance Manager chart is displaying metrics that have multiple data sources, you can display the View Thresholds dialog box to view all threshold indicators. The View Thresholds dialog box is accessible from the Chart Status button.
The View Thresholds dialog box displays the current threshold status of each data item and its corresponding data source. You can view the status for each metric/data source pair using flags to indicate whether the value of the data item has passed its warning or critical threshold. If a data item has no threshold set, the column containing that data item is left blank.
When you display the View Thresholds dialog box, the current data item and threshold values are captured in a dataset and the status of each threshold is displayed in the table. A timestamp of the dataset appears in the bottom left corner of the View Thresholds dialog box.
If you change a threshold value for a data item while the View Thresholds dialog box remains open, the new threshold value is compared against the dataset created at the time you displayed the dialog box, not against the current value of the data item in real time. To refresh the statuses in the View Threshold dialog box, close and redisplay it.
You can add or change threshold values by clicking the Chart Status button on the View Thresholds dialog box and choosing Set Threshold from the context menu.
To view thresholds:
The View Thresholds dialog box appears, displaying the status of any thresholds set for each of the data items and data sources in the chart. The status for a threshold is indicated by the flag that appears in the column for the data item and data source.
If no threshold is set for a data item, the status for that metric is left blank.
The threshold statuses that appear in the View Thresholds dialog box are derived from dataset values gathered at the time you display the View Thresholds dialog box. The date and time of the dataset appears at the bottom of the dialog box. The View Thresholds dialog box is not updated when the Performance Manager chart is refreshed.
From the View Thresholds dialog box, you can set thresholds or reset and edit associations for a specific cell if thresholds are set.
You can set or edit a threshold for a metric from the View Thresholds dialog box by clicking the Chart Status button and selecting Set Thresholds from the context menu. For more information about setting thresholds, see "Working With Events and Thresholds in Performance Manager".
You can reset Chart-only thresholds through the Chart Status button on a chart. If you reset a Chart-only threshold for a data item, the current threshold is deleted and is reset to its default value. If the data item has no default value, the threshold is simply deleted and no value is assigned as a threshold.
If you select Reset Threshold for a data item with an assigned event, a message box displays stating that you must deregister or edit the event from within the Enterprise Manager console.
To reset a threshold:
A confirmation dialog box appears, verifying that you are about to reset the threshold for the current metric. Click the OK button to confirm.
If no threshold exists for the metric, an error dialog box displays informing you that the threshold cannot be reset because no threshold exists for the metric.
If you attempt to reset a threshold associated with a registered event, an error message dialog box displays. You cannot deregister an event from within Performance Manager because the event associated with a metric may have several other targets and tests. You can instead edit the event from within Performance Manager by choosing Set Threshold (for 9i targets) to remove or modify the event.
A chart may not reflect an event that is registered while the related chart is open because the information for the metric in the chart related to the event has not been read from the repository. A chart does not automatically reflect the effect of event system changes. When you select Refresh Thresholds from the Chart Status button, Performance Manager updates the chart with the new data from the threshold repository and updates the chart threshold indicators.
When Event Registration or Permission changes effect the threshold respository, Performance Manager users are notified of these changes in a dialog box when the threshold data for the metric is next read from the repository. The following actions are conveyed to the Performance Manager user when a chart is opened, thresholds are refreshed for a chart, or thresholds are edited:
To refresh thresholds, choose Refresh Thresholds from the Chart Status button on the Performance Manager chart.
There may be circumstances when a user has permission to view several events that contain the same event test. When viewing a chart, you must decide which event will be associated with the metric in the chart. You can invoke Edit Threshold Association to change this association.
The Edit Threshold Association menu item has no application for data items with less than two events assigned to it. If you select Edit Threshold Association in such a case, a message box appears informing you that the threshold association cannot be changed because a threshold association for the metric does not exist or there is only one registered event test.
You cannot change the association for Chart-only thresholds because each user has his own pool of Chart-only thresholds and duplicates are not supported.
To edit threshold associations:
To edit threshold associations:
You can run Oracle Performance Manager in a browser and use a significant subset of the features of the full product, including basic monitoring features and event integration. Browser support includes basic monitoring features and event integration if you are using a version 9i Agent (or later).
The following features are available when running Performance Manager in a browser:
The following features are not available while running Performance Manager in a browser:
You can view specific information about metrics, events, charts and classes in Performance Manager through the Advice function on the Chart Status button and through other contextual functions within the Oracle Enterprise Manager application. However, you can view the full set of documentation for all the following types of metrics and events independently through your web browser without having to access the Oracle Enterprise Manager application. The documentation available through your browser provides a comprehensive Table of Contents, an index keyword search, and a full text search function.
For each of these types of metrics and events, the following information is provided.
For Metrics:
To access each documentation set, open the appropriate file below in a web browser:
|
 Copyright © 1996-2001, Oracle Corporation. All Rights Reserved. |
|