10g (9.0.4) for Windows
Part Number B10272-01
Home |
Contents |
Index |
| Oracle Discoverer Desktop User's Guide 10g (9.0.4) for Windows Part Number B10272-01 |
|
Discoverer Desktop includes several advanced features for working with data. This chapter describes those features and explains how to use them.
The topics covered in this chapter include:
Rows for tables are fetched from the database incrementally in groups. The number of rows in each group is specified in the Options dialog box based on the value set in the option "Retrieve data incrementally in groups of." Click the Query Governor tab on the Options dialog box to see that option.
To override that setting you can retrieve all the rows at once instead of incrementally. Retrieving all rows applies only to tabular style reports.
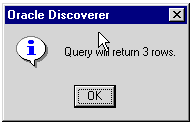
The message shows the total number of rows that will be returned by the query. The number of rows may be greater than the actual number of rows currently displayed in the worksheet.
Refreshing a worksheet re-queries the database and displays the worksheet's data based on any new data. A primary use of refreshing a worksheet is when you're using Discoverer in conjunction with real-time data. For example, if the Discoverer worksheets query a database used for on-line transaction processing, you need to refresh the worksheet periodically to update the worksheet data with the latest transaction results.
To refresh a worksheet, choose Sheet | Refresh Sheet. Discoverer displays the worksheet results based on the updated data.
Parameters are placeholders used instead of specific values in the definition of a condition. Unlike regular conditions that find the same data each time they are applied, parameters offer choices at the time the data loads.
You can create Parameters at two levels:
For example, suppose one of your routine analysis jobs is to compare sales performance by evaluating sales figures for various products from different groups of cities. By creating two parameters--one for products and the other for cities--you can select the specific grouping of data for the analysis at the time the worksheet loads.
Parameters are particularly helpful if several people use the same workbook or worksheet. Each person can select the parameters that load only the data of interest on the worksheet.
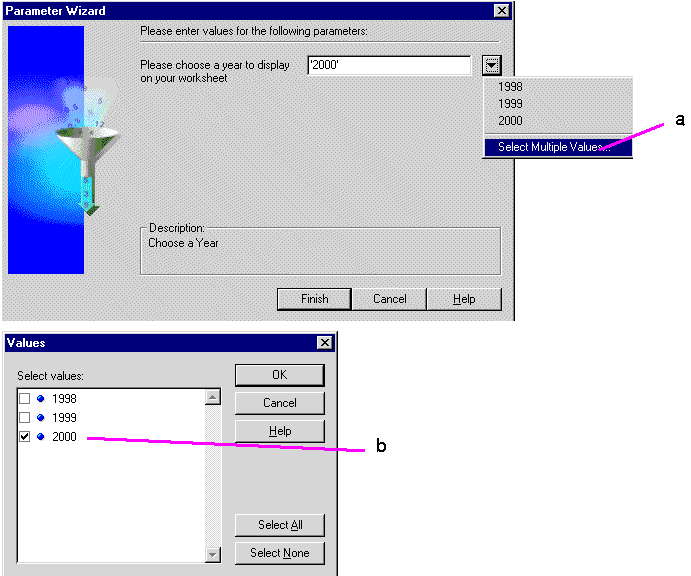
Parameter selections appear when loading a workbook or worksheet. Here's an example that shows a parameter for limiting the available data to a specific year, (2000).
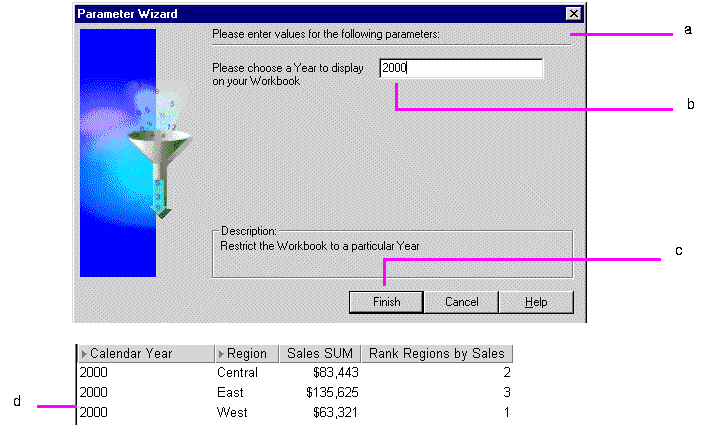
To create a parameter:
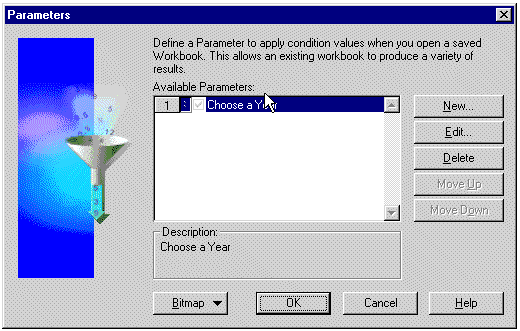
The Parameters dialog box opens. It shows the parameters already created.
The New Parameter dialog box appears.
Note: You can also access this dialog box when creating advanced conditions. Select New Parameter from Value(s) drop-down list on the New Conditions dialog box.
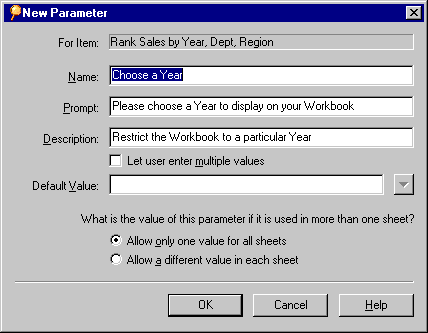
This is where you define new parameters.
For Item--select the item for the parameter from the drop-down list. The list shows the items currently available to the worksheet.
Name--the name of the Parameter, which appears on the list of available Parameters dialog.
Create Condition with Operator--creates a condition with an operator. You can select the operator from the drop-down list. For example, select equals (=) to create a condition with the formula "For Item" = "Parameter's Name".
Prompt--this text appears on the dialog box that opens prior to loading the worksheet; enter text that tells the person what to select.
Description--this text also appears on the dialog box that opens prior to loading the worksheet; it explains the parameter.
Let User Enter Multiple Values--select this option if you want the person using the worksheet to be able to select multiple values for the parameter when loading the worksheet. If this option is not selected, the person can choose only one value for the parameter.
Default Value--the pre-selected value for the parameter. Click the drop-down arrow and select a value from the list, or type the default value directly into the box.
What is the value of this parameter if it is used in more than one sheet?--allows you to create the Parameter either at Workbook level or Worksheet level.
Click 'Allow only one value for all Sheets' to make the parameter value cascade across all worksheets in the workbook. Click 'Allow a different value in each Sheet' to make the parameter value apply to the current worksheet only.
Moving the parameters up and down on the Parameters dialog box changes their position on the dialog box that appears when loading a worksheet. To add a picture to that dialog box, click Bitmap and choose Set Bitmap.
Parameters are activated when used in an active condition. If you check the option "Create condition with operator" in the New Parameter dialog box, a new condition is created and activated, therefore the parameters are also activated.
To deactivate a parameter, deactivate the condition. Deleting the condition or deleting the parameter also deactivates the parameter.
To edit parameter values:
Here you display the Parameter dialog so that you can choose a different value to display on your worksheet(s).
The Parameters dialog box appears.
The data on the worksheet is revised to meet the Parameter conditions.
NOTE: If you want to change the Parameter value for your worksheet, you can also use the Refresh option to display the Parameter dialog for active Parameters.
If the option Let User Enter Multiple Values is selected for a worksheet's parameters, the person opening the worksheet can select multiple values for the parameter.
Here's an example:
Discoverer Calculations are used to analyze the data in your worksheets. Discoverer provides a comprehensive range of pre-defined functions for use in your Calculations.
Simple Calculations based on the data in a worksheet can produce typical business answers, such as sales commissions per salesperson, royalty fees paid to a supplier, and so on. Complex Calculations can find the answers to more complicated questions including "what if" scenarios.
In other words, instead of merely viewing your data to find trends and answers, you can use Calculations to rigorously analyze the data using mathematical techniques.
The results of Calculations are displayed as new columns on a worksheet, or the Calculations can be part of other Calculations.
You can also pivot Calculation Items to the page axis, just like other Items.
|
NOTE: To see examples of how you can use Calculations to analyze your Discoverer data, refer to Appendix A.2, "About the examples in this chapter". |
Here is a sample of the results of a simple Calculation on a table:
Calculations are based on items, not on individual data points. For example, you can multiply Profit SUM (an item) by a percentage to find a result for each product.
However, you cannot, for example, subtract Year 2000 profits from Year 1999 profits because 2000 and 1999 are data points in the item, Year. To calculate results based on individual data points, use Discoverer's Analytic Functions LAG and LEAD, (see Appendix A.5.8, "Lag/Lead Function Examples").
To create a Calculation:
The Calculations dialog box appears.
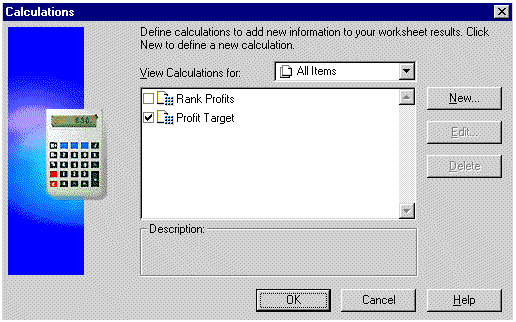
This dialog box shows Calculations already created for the worksheet. Selected Calculations (where the check box is selected) are active and apply to the worksheet.
The Edit Calculation dialog box for creating a new Calculation appears.
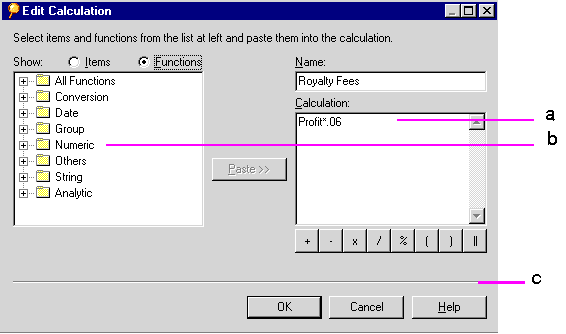
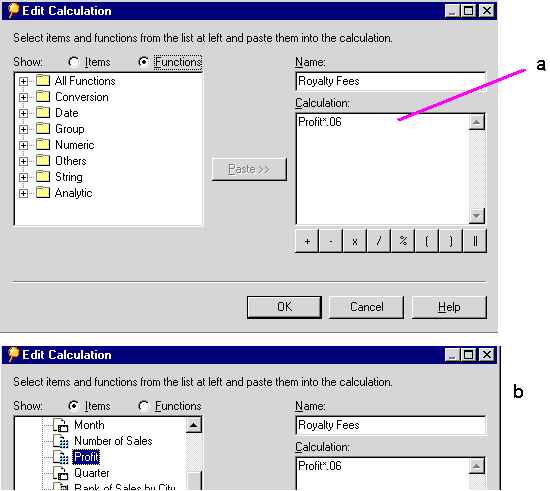
To help you create the Calculation formula with a minimum of typing, you can:
Items--lists the items available to the worksheet. This is helpful because you don't have to remember the name of an item in order to include it in a formula. Parameters are also listed, and you can use the parameters in a formula as well.
Functions--lists a wide range of functions that you can apply to your formula.
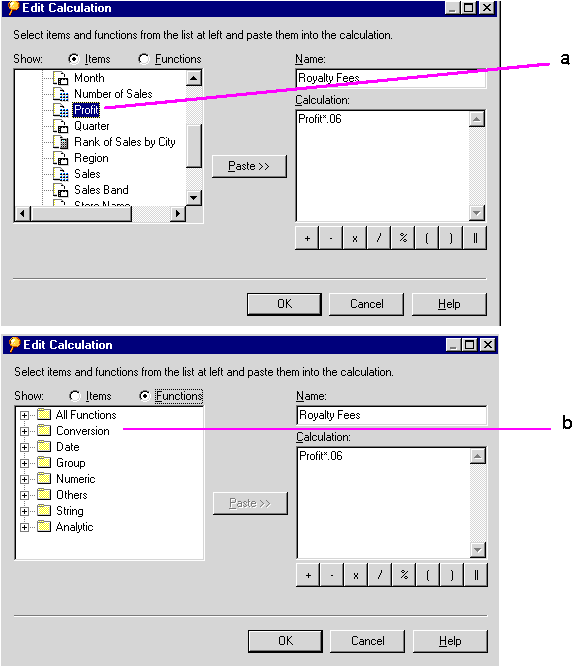
The Calculation is applied to the worksheet and results appear in a new column.
The advanced condition option allows you to build complex conditions for filtering your worksheet data.
To create an advanced condition:
The dialog box expands to show buttons to add and delete lines to the condition, and to include the Boolean operators (AND, OR, NOT).
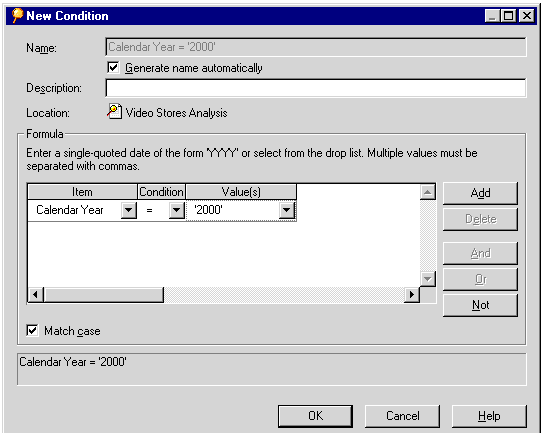
The Item drop-down list shows the items currently available to the worksheet.
Other options from the list are:
Create Calculation--click to open the New Calculation dialog box. When you finish creating the Calculation, it appears in the Item section of the condition.
For example, if you create a Calculation that computes a Royalty Fee, that Calculation is listed in the Item portion of the condition, and you can then filter the worksheet's data by the Calculation results.
Select Condition--displays a dialog box that lists the conditions currently defined for the worksheet. Select a condition to become the first part of the advanced conditional expression. With this option you can filter the data using several sequential conditions. That is, condition 1 filters the data, and then based on the results from condition 1, condition 2 filters the data.
Copy Condition--displays a dialog box that lists the conditions currently defined for the worksheet. Copying a condition inserts it on the line in the New Condition dialog box. You can then edit it, or add other features.
By default, the two conditional expressions are grouped with the Boolean AND.
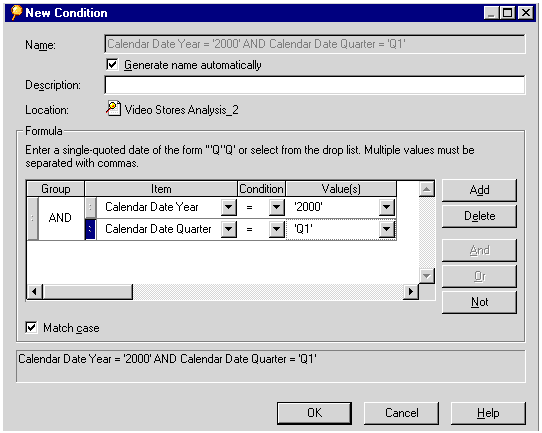
Note: As you create the condition formula, the box at the bottom of the dialog box shows its SQL syntax.
To see options for the Value(s), click the drop-down arrow.
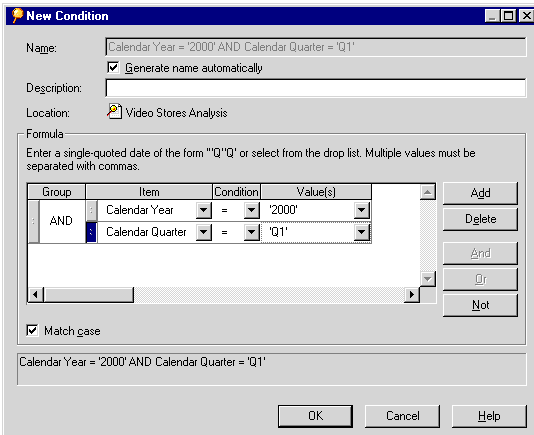
The values on the list correspond to the selected item in the condition. Other options are:
Select Multiple Values--displays a list of the values for the item. Click multiple values to include them in the values portion of the condition.
Create Calculation--click to open the Calculation dialog box. When you finish creating the Calculation, it appears in the Value(s) portion of the condition.
Select Item--displays a dialog box that lists the items currently defined for the worksheet. Select an item to become the value of the advanced conditional expression.
Select Parameter--displays a dialog box that lists the parameters currently defined for the worksheet. Select an parameter to become the value of the advanced conditional expression.
New Parameter--displays the Parameter dialog box, and you can create a parameter to be the value of the condition.
Create Subquery--displays a dialog box for creating a subquery as the value portion of the condition. See the next section for details.
Edit Subquery--this option only appears if you're using a subquery to determine the value; the Edit Subquery dialog box appears so you can edit the previous selections for the subquery.
A subquery for a condition uses a value that requires an intermediate step to determine the value. For example, suppose you want to create a condition that finds all the sales profits that exceed the median profit amount. The intermediate step is to find the median profit amount. Often, you create a separate worksheet to determine the intermediate value.
The subquery then identifies the intermediate value on its worksheet as the value for the condition.
To create a subquery:
The Create Subquery dialog box appears.
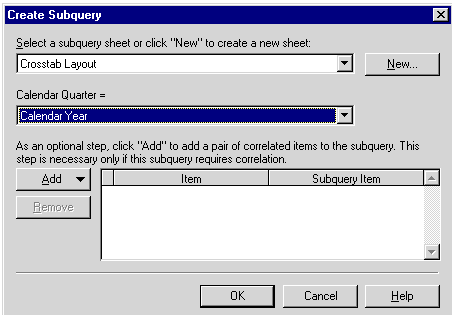
If you need to create a new worksheet that calculates the intermediate value, click the New button. The New Sheet dialog box appears so you can create a new worksheet for the value.
See the next section for a description of correlated items.
Correlated items add another dimension to a subquery. For example, suppose you want to find all the sales profits that exceed the median profit amount by department. The "by department" portion of the value is the new dimension to the subquery.
The items to correlate usually appear on both the original worksheet, and the worksheet used to create the intermediate value. For example, on the original worksheet you can find profit data for each department. On the worksheet for calculating the intermediate value, you can find a median value for each department. Correlating the two items matches them so each department median value corresponds to each department profit value.
Correlating items is also necessary when the worksheet for determining the intermediate value has additional values on it. Correlating makes sure the condition uses the correct intermediate values for the items.
As stated on the dialog box, you don't need to use the features for correlated items if the subquery does not include the extra dimension provided by items that correlate to one another.
To use correlated items:
The following figure shows an example.
The item then appears in the box for correlated items.

The Item column refers to the item on the original worksheet. The Subquery Item column refers to the item on the worksheet used to determine the intermediate value.
Normally you correlate the same item on each worksheet, but you can also correlate two different items. To correlate different items, choose the new item from the Subquery Item drop-down list.
To remove an item from the correlation list, select it and click the Remove button.
If you change the worksheet that is used to generate the intermediate value for a subquery, the subquery condition is not automatically updated. You must edit the condition with the subquery first, and then update subquery to match the changed worksheet.
To edit a subquery:
A prompt asks if you want to update the subquery to match the changed worksheet.
The edited subquery and the changed worksheet now match.
The Options dialog box offers a wide variety of options for setting operating features, formatting, and other aspects of your worksheets.
To select options:
The Options dialog box appears.
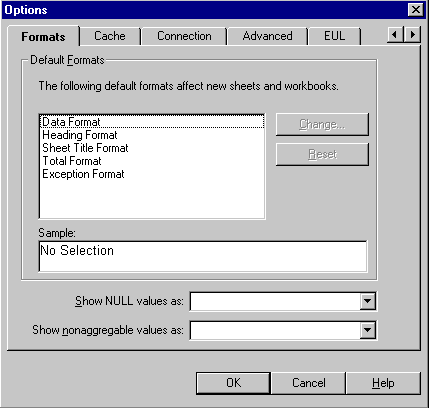
The tabs across the top of the dialog box list the different option categories. If you accessed the dialog box by clicking the Options button on another dialog box, the tabs across the top may only apply to that dialog box.
General--displays options for viewing different types of files, and for opening workbooks. Click the Viewer check boxes if the worksheets include files with videos, images, and sound (audio). Those viewers open automatically from within Discoverer to run the files.
Query Governor--displays options for maximizing the efficiency of working with larger worksheets, limiting the amount of time a query runs, and limiting the number of rows retrieved. You can also choose whether to use Summary data to improve the performance of Discoverer.
Table/Crosstab--displays options for the overall table or crosstab layout; you can add or remove gridlines, column headings, row numbering, and so forth. Removing various table or crosstab features is particularly helpful when printing a worksheet as a report. Tab options differ according to whether your worksheet is a Tabular or Crosstab worksheet.
Formats--displays options for setting the default formats for worksheet headings, data, titles, totals, exceptions, and null values. To change a format, select it and click the Change button. The dialog box for setting the font, color, and backgrounds appears.
Cache--displays options for the memory cache, disk cache, and cache directory for Discoverer. Generally these options should not be changed without assistance from the database administrator.
Connection--displays options for setting the EUL types that can be used.
Advanced--displays options for configuring Automatic Querying, Fan-trap Detection, and Multiple Join Path Detection. When you open Workbooks, Discoverer can run queries automatically or not, or can request confirmation before running queries.
EUL--displays the default EUL setting. Use the option on this tab to select a default EUL (End User Layer). Check with your database administrator for the correct EUL to select.
You can run Discoverer from the command line and perform a limited number of tasks automatically, for example, opening or printing a Workbook.
To use command-line options, type the command string for starting Discoverer, following by a command-line option, (see table 8-1 below).
To run a command line option:
The Run dialog box appears.
<drive>\orant\bin\dis51usr.exe /connect me/mypassword@mydatabase <option>
Where 'me' is your Discoverer ID, 'mypassword' is your Discoverer password, and 'mydatabase' is the Oracle database to which you want to connect, (see your Oracle Administrator for connect details). The following table displays some sample command line options.
For example, to open a file Reports.DIS in your root directory, type:
<drive>\orant\bin\dis51usr.exe /connect me/mypassword@mydatabase /open c:\Reports.DIS
To print a file Reports.DIS in your root directory, type:
<drive>\orant\bin\dis51usr.exe /connect me/mypassword@mydatabase /print c:\Reports.DIS
If you are familiar with SQL, you can analyze the SQL statements that Discoverer executes against the database. You can also open workbooks with your own SQL programming statements.
To see a worksheet's SQL statements:
The SQL Inspector dialog box appears. It shows the SQL statements used to create your current worksheet.
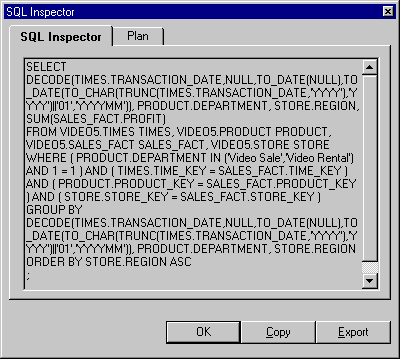
The SQL statements Discoverer uses to open a workbook or worksheet involve complex programming. Therefore, you cannot simply copy a worksheet's SQL and use it to open another workbook or worksheet. You must write your own programs.
If you have written an SQL program to open a workbook, importing the program executes the SQL statement and opens the Discoverer workbook.
|
NOTE: If you are importing an SQL script that contains join definitions, the joins must have been created first by your Discoverer manager using Discoverer Administrator. |
To import SQL and open a workbook:
The Open dialog box appears.
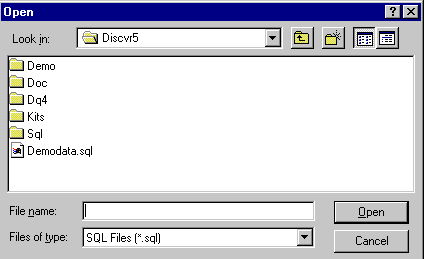
A new workbook is then created from the query defined by the SQL statement.
The Plan tab displays the Oracle Server Execution Plan chosen by the Oracle Server for a query request. The Execution Plan defines the sequence of operations that the Oracle Server performs to execute the SQL statement. This facility is useful when using Summary tables and Materialized Views.
Summary tables and Materialized Views store precomputed aggregated data, which is used where possible instead of data retrieved directly from the database. Because Summary tables and Materialized Views are much quicker to access, this enhances the performance of Discoverer.
Summary Management is handled automatically by Discoverer, and is transparent to most Discoverer users. However, you may wish to use the SQL Inspector feature to look at SQL statements being generated. For example, when using Summaries, you may wish to check that a query is using a Summary or Materialized View created by your Discoverer manager.
Summaries are created by your Discoverer manager to help do your work more quickly and efficiently.
Two types of Summary are used:
|
NOTE: For more information on Summaries and Materialized Views, see Oracle8i Data Warehousing Guide Release 2 (8.1.6) (Part Number A76994-01). |
To see a worksheet's Execution Plan:
The SQL Inspector dialog appears.
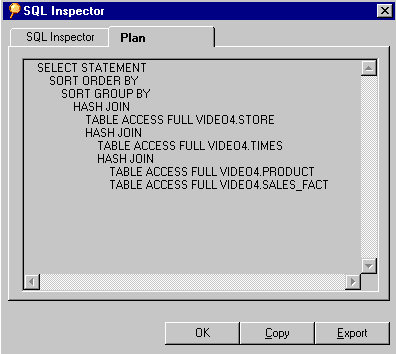
When running Discoverer against an Oracle 8.1.6+ database, the server controls query redirection by rewriting the SQL to use a Materialized View. If a server rewrite occurs, the server Execution Plan indicates the Materialized View name.
You can use the Plan tab in the SQL Inspector dialog to see the SQL statement that Discoverer sends to the server.
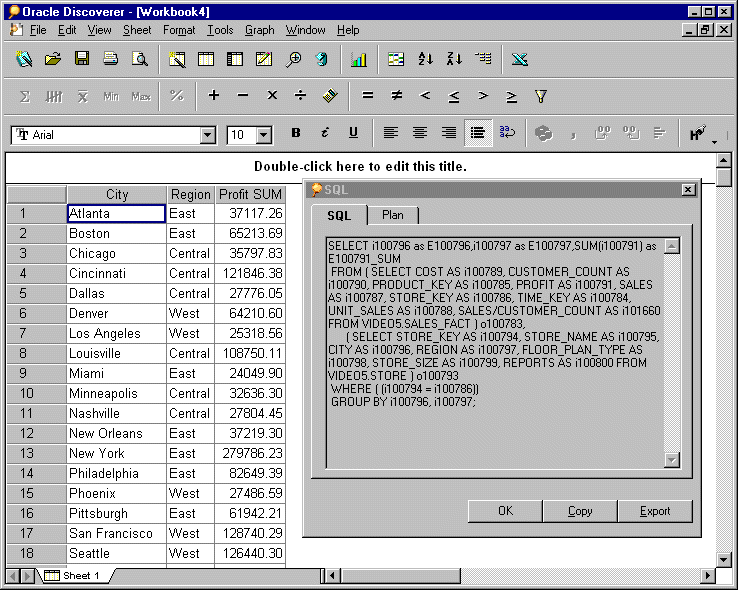
Although the Discoverer manager has created a Summary for the Items City, Region, and Profit SUM, the SQL statement displayed in the SQL Inspector SQL tab does not indicate that a Summary, (in this case a Materialized View) is being used, see Figure 8-19 above).
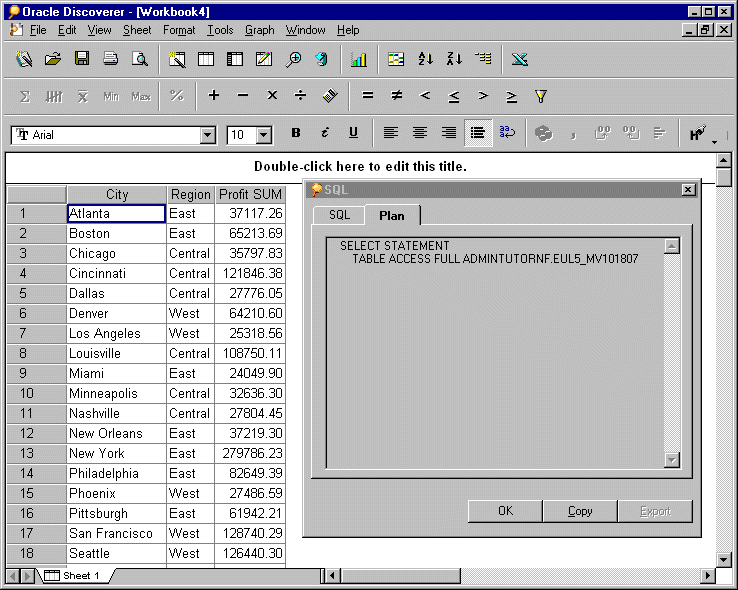
In Figure 8-20, you can see from the SQL Inspector Plan tab that a Materialized View Summary is being used by the database, identified by the table name EUL5_MV<Summary Identifier>.
When running against a pre-8.1.6 database Discoverer controls redirection to a summary table. The SQL can be viewed at the SQL tab and the server Execution Plan can be viewed on the Plan tab in the SQL Inspector dialog in Discoverer Desktop.
Figure 8-21 shows a crosstab worksheet of items from the Video Analysis folder (created as part of the Video Stores and the resulting SQL statement in the SQL Inspector dialog. The SQL statement shows that the summary table EUL5_SUM100750 is referenced.
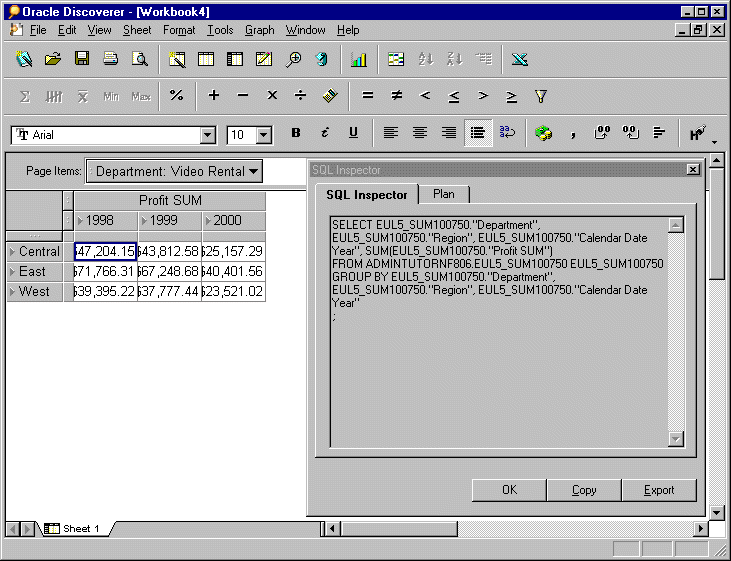
Discoverer Desktop automatically chooses the most appropriate Summary Table to process your query efficiently.
Figure 8-22 shows the same worksheet as before after the user has drilled down from Year to Month. Notice that Discoverer Desktop has redirected the second part of the query to EUL5_SUM100775 instead of EUL5_SUM100750.
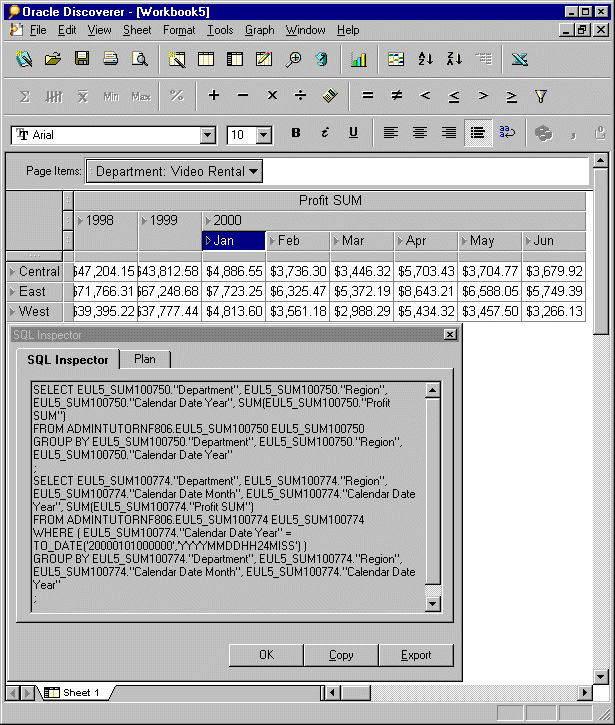
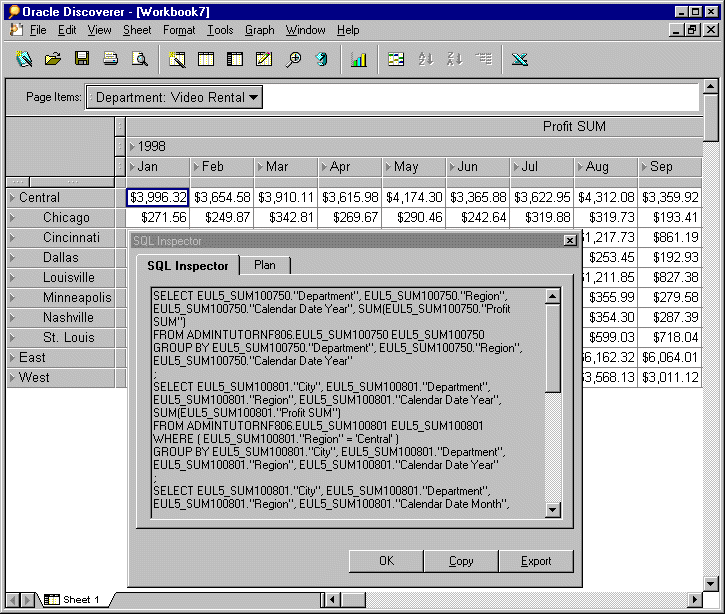
Figure 8-23 shows the same worksheet again. This time the user has drilled down from Region to City. Again, Discoverer Desktop automatically chooses the most efficient Summary Tables for each part of the query.
Discoverer uses Inline Views in its SQL generation. This SQL has Inline Views removed to make external editing easier - this process is also known as 'flattening'. When you use the SQL Inspector dialog, typically you are looking at SQL with the Inline Views removed, (or flattened SQL).
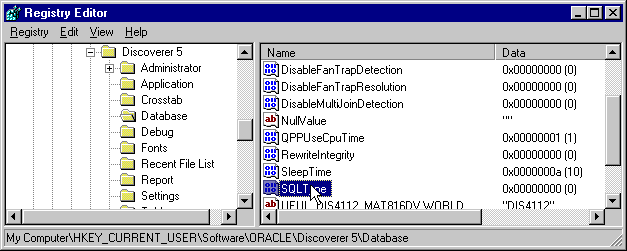
To set the default variant, there is registry entry called HKEY_CURRENT_USER\Software\Oracle\Discoverer 5\Database\SQLType.
Set this value to configure how SQL is displayed in the SQL Inspector dialog. The valid values for this entry are 0 and 2, used as follows:
0 - Show SQL with no Inline Views (flattened SQL). This is the default.
2 - Show SQL with Inline Views.
To configure the SQLType registry setting:
You can export Workbook SQL from the command line, without running Discoverer. Refer to the Command Line Interface section of the Oracle Discoverer Administrator Administration Guide for more details, or contact your Discoverer manager.
|
|
 Copyright © 1996, 2003 Oracle Corporation. All Rights Reserved. |
|