|
Oracle® Business Intelligence Discoverer Plus User's Guide
10g Release 2 (10.1.2.0.0) Part No. B13915-01 |
|
 Previous |
 Next |
|
Oracle® Business Intelligence Discoverer Plus User's Guide
10g Release 2 (10.1.2.0.0) Part No. B13915-01 |
|
 Previous |
 Next |
The examples in this section show you how to use analytic functions with row-based and time-based intervals to get the best results with Discoverer. For example, you might was to create a calculation that returns the value of the previous row, or the value one year previously.
Note: Using row-based and time-based intervals is also known as windowing. For more information about windowing, see "About windowing". For more examples of using windowing in Discoverer, see "Windowing function examples".
The examples use analytic functions created using Discoverer's analytic functions templates. Each example shows how selecting intervals in the Restart calculation at each change in list on the analytic function template dialogs affects the calculation. For example, you might specify 1 Month Before Current Value as the interval, to compare sales in one month with sales in another month. For more information about creating calculation formulas using analytic function templates, see "How to create a new calculation using an analytic function template".
Note: If you are entering analytic function text in the Calculation field manually, you can specify an interval by adding a PARTITION BY clause to the formula. For more information about creating calculation formulas manually, see "What are analytic functions?".
This section contains the following examples:
"Example: Creating a Difference calculation using a row-based interval"
"Example: Creating a Difference calculation using a time-based interval"
"Example: Creating a Preceding value calculation using a time-based interval"
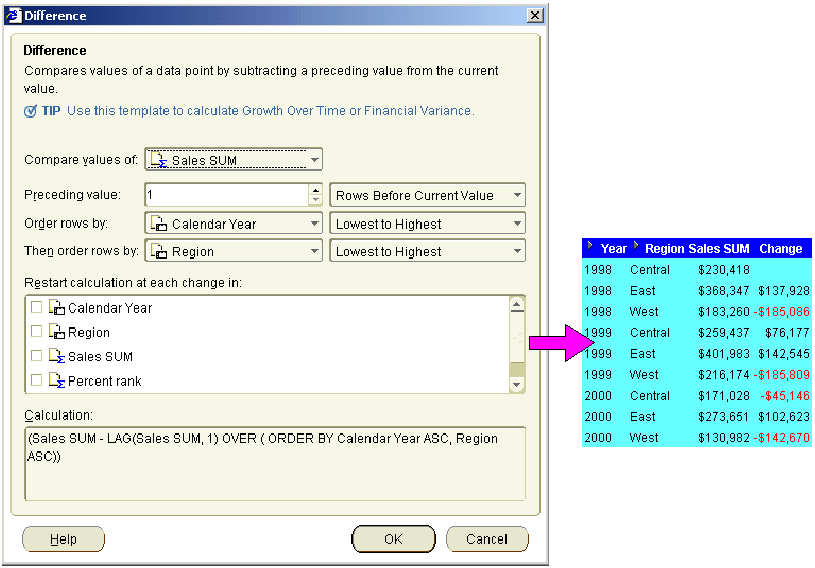
This example uses a difference calculation based on a row-based interval. The example worksheet displays the Year, Region, and Sales SUM items. To return the previous row's value for each sales value, add a calculation called 'Change' to the worksheet using the "Difference dialog", as follows:
select Sales SUM from the Compare values of drop down list
select the '1' and 'Rows Before Current Value' from the Preceding value fields
select 'Calendar Year' from the Order rows by field.
select 'Region' from the Then order rows by field.
accept default values for the remaining fields
The example worksheet shows the Change item containing the difference formula. For example, the Change column for the West region in 2000 is -$142,670. This value is derived from the West region value for 2000 (i.e. 130,982) minus the East region value for 2000 (i.e. 273,651).
Note: Positive values are shown in black. Negative values are shown in red.
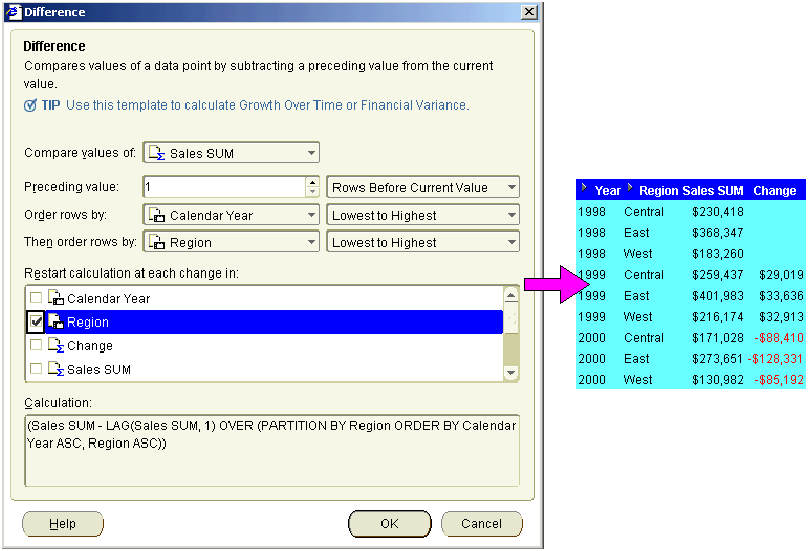
Note: If you selected the Region check box in the Restart calculation at each change in list, you would always compare each value with the Sales SUM value for the same region in the previous year.
The example worksheet below shows the Change item containing the difference formula where the Region check box in the Restart calculation at each change in list is selected. In other words:
The Change value for the West region in 2000 is -$85,192. This value is derived from the Sales SUM value for the West region in 2000 (i.e. 130,982) minus the Sales SUM value for the West region in 1999 (i.e. 216.174).
The Change value for the East region in 2000 is -$128,331. This value is derived from the Sales SUM value for the East region in 2000 (i.e. 273,651) minus the Sales SUM value for the East region in 1999 (i.e. 401,983).
Note: When you choose a row-based interval and select the Region check box in the the Restart calculation at each change in list, you compare values with values from the previous year. You can also compare values with values from a previous year using a time-based interval (for more information about using time-based intervals, see "Example: Creating a Difference calculation using a time-based interval").
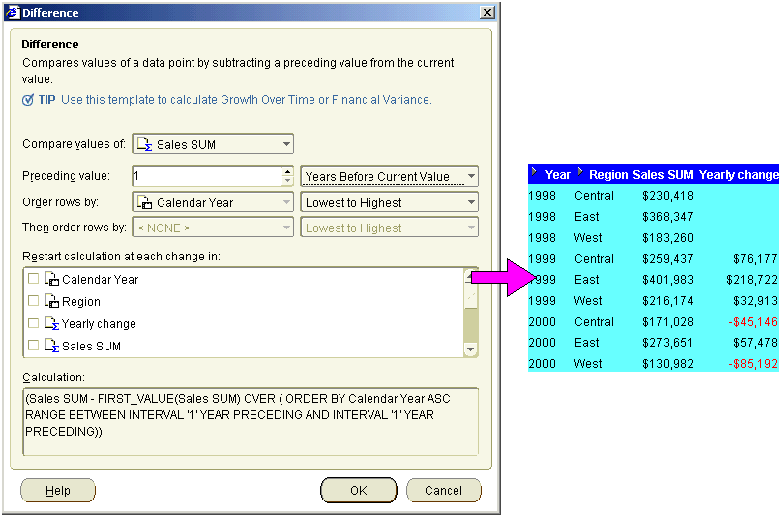
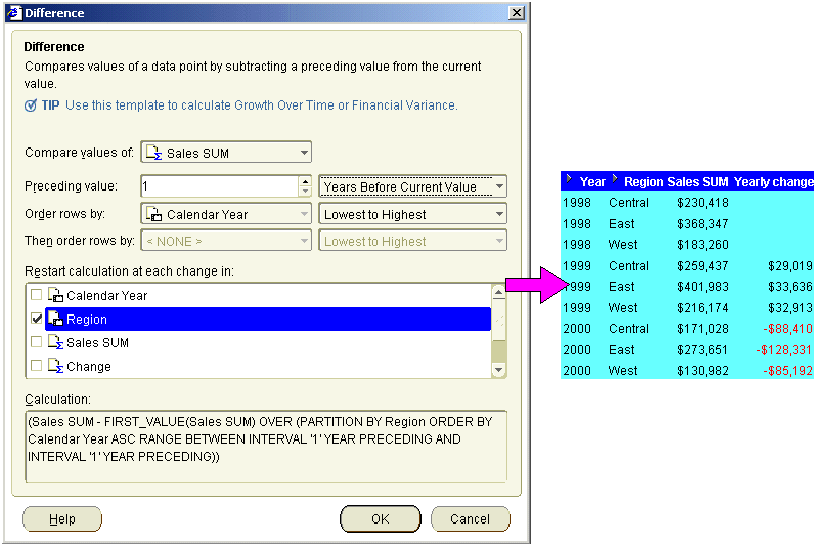
This example uses a difference calculation based on a time-based interval. The example worksheet displays the Year, Region, and Sales SUM items. To calculate the change in sales from the previous year, add a calculation called Yearly change to the worksheet using the "Difference dialog", as follows:
select Sales SUM from the Compare values of drop down list
select the '1' and 'Years Before Current Value' from the Preceding value fields
select the Region check box in the Restart calculation at each change in list
accept default values for the remaining fields
The example worksheet shows the Yearly change item containing the difference formula. For example, you can see in the Yearly change column that Sales SUM value for the West region in 2000 is $85,192 less that the West region in 1999.
Note: Positive values are shown in black. Negative values are shown in red.
Note: If you did not select the Region check box in the Restart calculation at each change in list, you would always compare each value with the Sales SUM value for the last region in the previous year.
The example worksheet below shows the Yearly change item containing the preceding value formula where the Region check box in the Restart calculation at each change in list is cleared. In other words:
The Yearly change value for the West region in 2000 is -$85,192. This value is derived from the Sales SUM value for the West region in 2000 (i.e. 130,982) minus the Sales SUM value for the West region in 1999 (i.e. 216.174).
The Yearly change value for the East region in 2000 is $57,478. This value is derived from the Sales SUM value for the East region in 2000 (i.e. 273,651) minus the Sales SUM value for the West region in 1999 (i.e. 216.174).
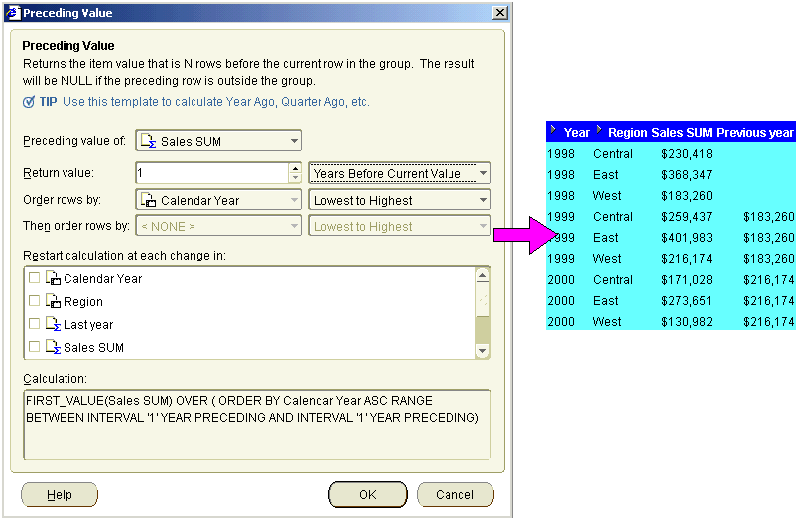
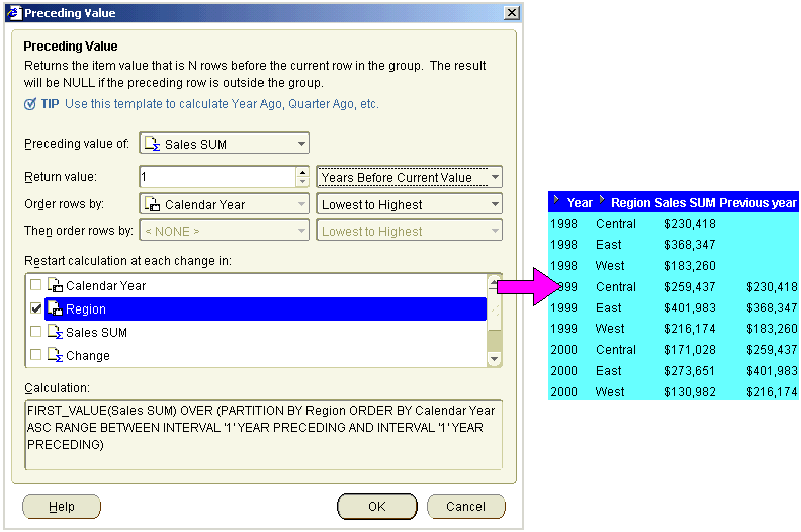
This example uses a preceding value calculation based on a time-based interval. The example worksheet displays the Year, Region, and Sales SUM items. To return the previous year's value for each sales value, add a calculation called Previous year to the worksheet using the "Preceding Value dialog", as follows:
select Sales SUM from the Preceding value of drop down list
select the '1' and 'Years Before Current Value' from the Return value fields
select the Region check box in the Restart calculation at each change in list
accept default values for the remaining fields
The example worksheet shows the Previous year item containing the preceding value formula. For example, you can see in the Previous year value for the West region in 2000 is $216,174, which is the same as the Sales SUM value for 1999 in the West region.
Note: If you did not select the Region check box in the Restart calculation at each change in list, you would always return the Sales SUM value for the last region in the previous year.
The example worksheet below shows the Previous year item containing the preceding value formula where the Region check box in the Restart calculation at each change in list is cleared. In other words, the Previous year value for the West, East, and Central regions in 2000 is $216,174, which is the same as the Sales SUM value for 1999 in the West region.
