|
Oracle® Business Intelligence Discoverer Plus User's Guide
10g Release 2 (10.1.2.0.0) Part No. B13915-01 |
|
 Previous |
 Next |
|
Oracle® Business Intelligence Discoverer Plus User's Guide
10g Release 2 (10.1.2.0.0) Part No. B13915-01 |
|
 Previous |
 Next |
This section includes examples of conditional formats and stoplight formats in Discoverer.
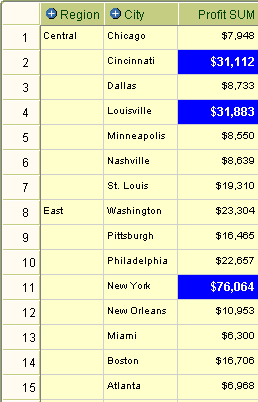
In this example, you want to analyze performance by highlighting Profit SUM values greater than 30,000 with a blue background.
You create a conditional format on the Profit SUM worksheet item. In the worksheet example below, the Profit SUM values for Cincinnati, Louisville, and New York are highlighted with a blue background because they are greater than 30,000.
Figure 12-3 A Discoverer worksheet using a conditional format

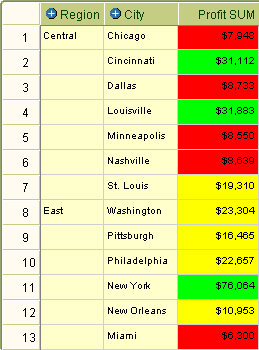
In this example, you want to analyze performance by categorizing profit values on a table worksheet, as follows:
display profit values less than 10,000 in the unacceptable category (with a red background)
display profit values between 10,000 and 30,000 in the acceptable category (with a yellow background)
display profit values greater than 30,000 in the desirable category (with a green background)
You create a stoplight format on the Profit SUM worksheet item. In the worksheet example below, a stoplight format based on these categories is applied to Profit SUM values in a table worksheet. Values in the unacceptable category are show in red (e.g. Chicago and Dallas). Values in the acceptable category are shown in yellow (e.g. St. Louis and Washington). Values in the desirable category are shown in green (e.g. Cincinnati and Louisville).
Figure 12-4 A Discoverer worksheet using a stoplight format

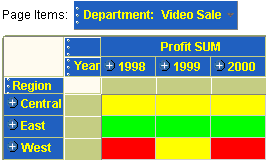
In this example, you want to analyze performance by categorizing regions based on profit values that are hidden on a crosstab worksheet, as follows:
display profit values less than 60,000 in the unacceptable category (with a red background)
display profit values between 60,000 and 100,000 in the acceptable category (with a yellow background)
display profit values greater than 100,000 in the desirable category (with a green background)
You want to display stoplight colors but not the worksheet values. Therefore, you select the Hide data values for stoplight formats check box on the New/Edit Stoplight format dialog.
You create a stoplight format on the Profit SUM worksheet item. In the worksheet example below, a stoplight format based on these categories is applied to Profit SUM values in a crosstab worksheet. Values in the unacceptable category are show in red (e.g. West in 1998 and West in 2000). Values in the acceptable category are shown in yellow (e.g. Central in 1998, 1999, and 2000, and West in 1999). Values in the desirable category are shown in green (e.g. East in 1998, 1999, and 200).
Figure 12-5 A Discoverer worksheet using a stoplight format
