|
Oracle® Business Intelligence Discoverer Plus User's Guide
10g Release 2 (10.1.2.0.0) Part No. B13915-01 |
|
 Previous |
 Next |
|
Oracle® Business Intelligence Discoverer Plus User's Guide
10g Release 2 (10.1.2.0.0) Part No. B13915-01 |
|
 Previous |
 Next |
You create totals to analyze a worksheet in a new way. For example, to calculate a sum for a list of sales figures, or to find the average of a list of profit figures.
To create a total on a table worksheet or crosstab worksheet:
Display the worksheet that you want to analyze.
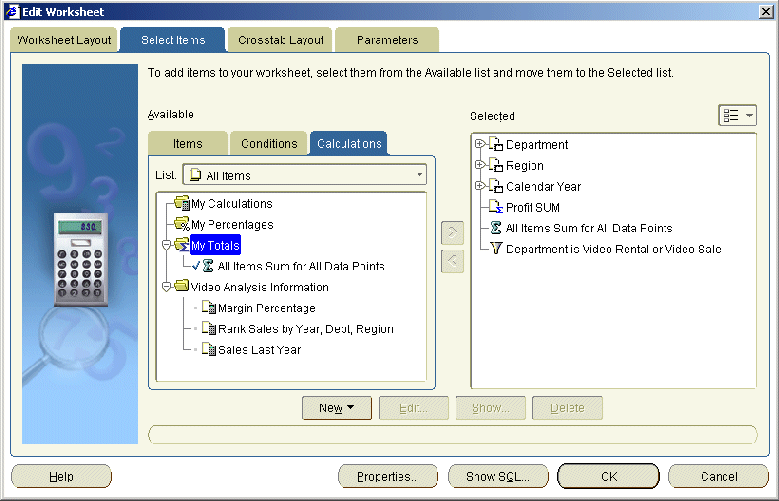
Choose Tools | Totals to display the "Edit Worksheet dialog: Select Items tab: Calculations tab".

The Calculations tab lists existing calculations, percentages, and totals available in the worksheet. Active totals are marked with a tick symbol (or check mark) in the Available list and are also displayed in the Selected list.
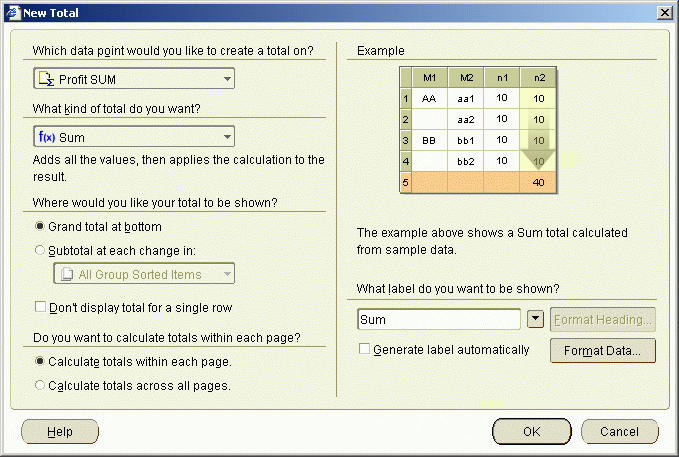
Click New and select New Total from the drop down list to display the "New Total dialog".

Under Which data point would you like to create a total on?, select the item that you want to summarize from the drop down list.
Note: You can also create totals for all numeric items on the worksheet by selecting All Data Points from the drop-down list.
Under What kind of total do you want?, select a total type from the drop down list.
For example, choose Sum to add the values, or choose Average to calculate a mean.
Under Where would you like your total to be shown?, choose where you want to display the total.
For example, select the Grand total at bottom radio button to calculate a grand total for a column and place it after the last row of the table.
Note: Positioning options are different depending on the type of worksheet, as follows:
on table worksheets, you can position the total at the bottom of the worksheet
on crosstab worksheets, you can position the total at the bottom of the worksheet or on the right of the worksheet
If you select the Subtotal at each change in radio button, select the item on which to group the data from the drop down list.
For example, if you sort the data by region you might want to see profits by region. If so, select region as the data item and Discoverer will display the total profit for each region on a separate line.
Under What label do you want to be shown?, do one of the following:
type in a label for the total
use the drop down list to insert variable values into the label.
Note: Select the Generate label automatically? check box if you want Discoverer to generate a label for you.
Click OK to save the details and close the dialog.
Click OK to close the Calculations tab and return to the worksheet.
Discoverer calculates the total and displays it on the worksheet.
Notes
You can also create a new total in the following ways:
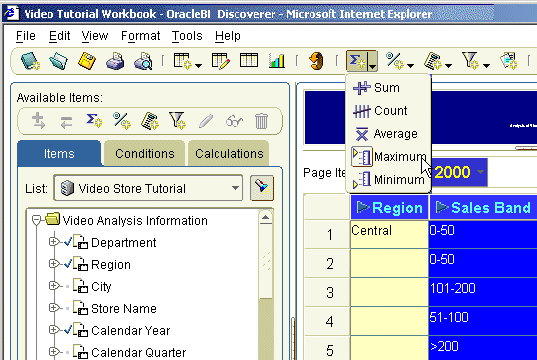
Select the worksheet item for which you want to create a total, then select the New Total option on the Standard toolbar and choose one of the total types available.

If the Available Items pane is displayed, select the New Total option on the Available Items toolbar (for more information, see "Available Items pane").
If the Available Items pane is displayed, display the Calculations tab, right-click on My Totals, and select New Total.