|
Oracle® Business Intelligence Discoverer Plus User's Guide
10g Release 2 (10.1.2.0.0) Part No. B13915-01 |
|
 Previous |
 Next |
|
Oracle® Business Intelligence Discoverer Plus User's Guide
10g Release 2 (10.1.2.0.0) Part No. B13915-01 |
|
 Previous |
 Next |
The following examples show how aggregation options specified on the "Worksheet Properties dialog: Aggregation tab" affect how Discoverer displays aggregated values.
In this example (using an Oracle9i database), you want to calculate a ranked list of cities based on profits. You want the highest profits to have the highest rank. You create a Discoverer calculation called 'Rank' with the following formula:
RANK() OVER(PARTITION BY "Calendar Year" ORDER BY "Profit SUM" DESC)
You want Discoverer to calculate the 'Rank' aggregated value as follows:
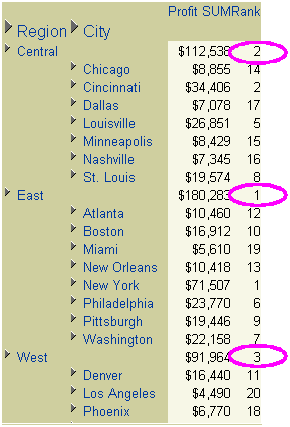
rank regions against each other (e.g. the East region is ranked 1 with profits of $180,283 and the Central region is ranked 2 with profits of $112,538)
rank cities against each other (e.g. New York is ranked 1 with profits of $71,507, and Cincinnati is ranked 2 with profits of $34,406)
The worksheet below shows how Discoverer calculates the ranks if you select the Show the aggregated value calculated by the database. The database uses the same aggregation method as Discoverer option on the "Worksheet Properties dialog: Aggregation tab".
The table below shows how Discoverer calculates the 'Rank' aggregated values for the different options on the "Worksheet Properties dialog: Aggregation tab".
Table 14-1 Explanation of fields
In this example (using an Oracle8i database), a worksheet displays profits and sales data for cities in regions. You want to calculate a weighted margin increase of 10% for Chicago and no margin increase for other cities. You create a Discoverer calculation called 'Weighted Profits/Sales' with the following formula
CASE WHEN Video Analysis Information.City = 'Chicago' THEN Profit SUM/Sales SUM*1.1 ELSE Profit SUM/Sales SUM END
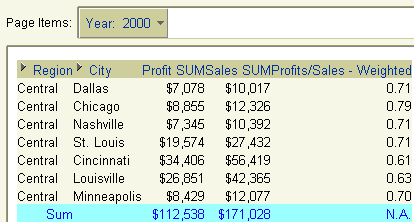
With an Oracle8i database, Discoverer cannot compute aggregated values for certain specific non-linear calculations, or worksheet items based on CASE SQL statements. Therefore, you cannot display the 'Weighted Profits/Sales' aggregated value as 0.66 (i.e. $112, 538/$171,028). In this scenario, you can either display the non-aggregable label (e.g. N.A.) or compute an aggregated value by simply adding up the 'Weighted Profits/Sales' values to get 4.86. In this example you want to display the non-aggregable label (e.g. N.A.).
The worksheet below shows how Discoverer displays the 'Weighted Profits/Sales' aggregated value as the non-aggregable label 'N.A' if you select the Show <Non-aggregable label>, the "values that cannot be aggregated" option, set on the "Worksheet Properties dialog: Aggregation tab".
The table below shows how the 'Weighted Profits/Sales' aggregated value is calculated for the different radio button options on the "Worksheet Properties dialog: Aggregation tab".
Table 14-2 Explanation of fields
| Check box selected | What value is displayed? |
|---|---|
| Show <Non-aggregable label>, the "values that cannot be aggregated" option, set on the Sheet Format tab | <N.A> (as in example above) |
| Show the sum of the values displayed in the contributing cells | 4.86 (a simple addition of the Weighted Profits/Sales values) |
In this example (using an Oracle8i database), a worksheet displays profits and sales data for cities in regions. You want to calculate a weighted margin increase of 10% for Chicago and no margin increase for other cities. You create a Discoverer calculation called 'Weighted Profits/Sales' with the following formula:
CASE WHEN Video Analysis Information.City = 'Chicago' THEN Profit SUM/Sales SUM*1.1 ELSE Profit SUM/Sales SUM END
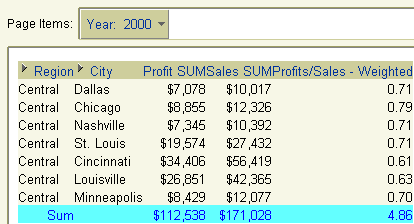
With an Oracle8i database, Discoverer cannot compute aggregated values for certain specific non-linear calculations, or worksheet items based on CASE SQL statements. Therefore, you cannot display the 'Weighted Profits/Sales' aggregated value as 0.66 (i.e. $112, 538/$171,028). In this scenario, you can either display the non-aggregable label (e.g. N.A.) or compute an aggregated value by simply adding up the 'Weighted Profits/Sales' values to get 4.86. In this example you want to compute an aggregated value by simply adding up the 'Weighted Profits/Sales' values to get 4.86.
The worksheet below shows how Discoverer calculates the 'Weighted Profits/Sales' aggregated value as 4.86 if you select the Show the sum of the values displayed in the contributing cells option on the "Worksheet Properties dialog: Aggregation tab".
The table below shows how the 'Weighted Profits/Sales' aggregated value is calculated for the different radio button options on the "Worksheet Properties dialog: Aggregation tab".
This example (using an Oracle9i database) shows how Discoverer does not aggregate repeated values, whichever aggregation option you choose on the "Worksheet Properties dialog: Aggregation tab".
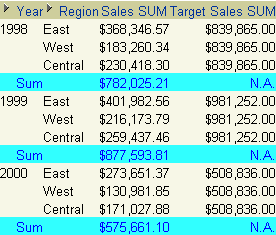
In this example, a worksheet displays sales values (i.e. the Sales SUM item) for regions for each year. The worksheet also displays the target sales value set by the company (i.e. the Target Sales SUM item) for each region. Each region has the same target sales value. You create a Discoverer total to calculate total values for each year.
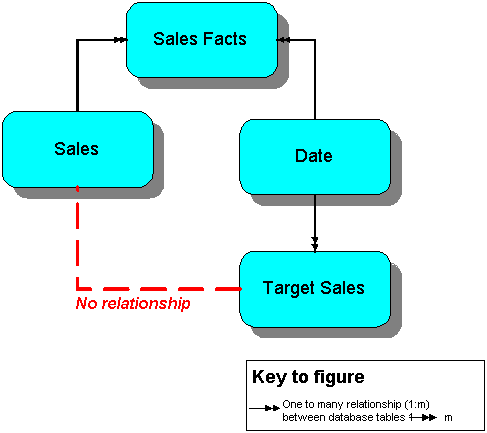
It is not meaningful to aggregate Target Sales Sum values at the Year level because there is no logical relationship between the Sales item and the Target Sales item. If you are familiar with entity-relationship diagrams, the figure below shows that this is because the Sales SUM item is dimensioned by store (i.e. in the Sales Facts table) but the Target Sales Sum item is dimensioned by date (i.e. in the Date table).
Therefore, you want Discoverer to display a non-aggregable label (e.g. N.A.) for the yearly total values for the Target Sales Sum item. The worksheet below shows how Discoverer displays a non-aggregable label (i.e. N.A.) for the yearly totals for the Target Sales Sum item (regardless of which aggregation option you choose on the "Worksheet Properties dialog: Aggregation tab".
The table below shows how Discoverer the Target Sales Sum aggregates are calculated for the different radio button options on the "Worksheet Properties dialog: Aggregation tab".
Table 14-4 Explanation of fields
| Check box selected | What value is displayed? |
|---|---|
| (Oracle9i database only) Show the aggregated value calculated by the database. The database uses the same aggregation method as Discoverer | N.A. |
| Show <Non-aggregable label>, the "values that cannot be aggregated" option, set on the Sheet Format tab | N.A. |
| Show the sum of the values displayed in the contributing cells | N.A. |