10g (9.0.4)
Part Number B10602-01
Home |
Contents |
Index |
| Oracle Reports Building Reports 10g (9.0.4) Part Number B10602-01 |
|
This chapter introduces the fundamental concepts of the Reports Builder component of Oracle Reports. Each topic in this chapter is also included in the Basic Concepts section of Reports Builder online help (see Section 3.1.1, "Using the online help").
Topics are grouped into the following sections:
The topics in this section discuss the features and functionality in Reports Builder.
Reports Builder is the report-building component of Oracle Reports Developer (a component of the Oracle Developer Suite), a powerful enterprise reporting tool that enables you to rapidly develop and deploy sophisticated Web and paper reports against any data source (including an Oracle database, JDBC, XML, text files, and Oracle OLAP). Leveraging the latest J2EE technologies such as JSP and XML, you can publish your reports in a variety of formats (including HTML, XML, PDF, delimited text, Postscript, PCL, and RTF) to any destination (including e-mail, Web browser, OracleAS Portal, and file system) in a scalable, efficient manner.
Recognizing the differences between Web publishing and paper publishing, Reports Builder provides the power to develop high quality output for the Web and e-business requirements, as well as high-fidelity printed reports. Reports Builder includes:
Oracle Reports focuses heavily on Web publishing, moving more fully into its role as a universal publishing solution. In prior releases, Reports Builder's Web feature simply displayed paper reports (that is, multiple pages) in HTML or PDF. This moves corporate data onto the Web, but also results in large and somewhat inflexible HTML pages.
One of the major new features of Oracle Reports is the incorporation of JavaServer pages (JSPs). Through the use of JSP technology, Oracle Reports embeds report data directly into Web pages.
For a detailed summary of new features in this release, as well as deprecated, obsolete, and changed functionality and components, see the topic "About this release" in the Welcome section of the Reports Builder online help.
The topics in this section discuss basic concepts of reports; for more advanced concepts, see Section 2.1, "Reports".
A report consists of objects that collectively define the report:
Using the Property Inspector, you define report properties. The document taxonomy (classification) properties (Title, Author, Subject, and Keywords) assist in cataloguing and searching a report document.
When you first start Reports Builder, you can choose to open an existing report, create a new report using the Report Wizard, or create a new report manually.
Using the Report Wizard, you can quickly and easily accomplish the steps to build a report for both Web and paper layouts:
If you choose to create a new report manually, Reports Builder creates a new default report definition for you. The first window you see is called the Object Navigator. This window displays a comprehensive list of report objects. Initially, it shows all objects that Reports Builder has created for you, as part of the report definition. As you define your report, the Object Navigator provides a central location to access and modify all objects in your report(s), including attached libraries and program units. You can change the Object Navigator view to list object hierarchically or by object type.
Section 3.5.1, "Creating a report"
With a focus on Web publishing, Oracle Reports has moved more fully into its role as a universal publishing solution. In prior releases, Reports Builder's Web feature simply displayed paper reports (that is, multiple pages) in HTML or PDF. This moves corporate data onto the Web, but also results in large and somewhat inflexible HTML pages.
While all the prior Web report functionality remains (that is, hyperlinks, bookmarks, hyperlink destinations, before and after escapes, and so on), Oracle Reports uses JavaServer Pages (JSPs) as the underlying technology to enable you to enhance Web pages with information retrieved using Reports Builder. This introduces the Web Source view of a report, and allows you to have both JSP-based and paper-based definitions in a single report. In other words, you can either publish your paper reports to the Web or take more advantage of Web features using the Web Source view. For example, you can create a report that has a paper PDF version and a JSP-based Web version; what you choose depends on your needs and whether you are able to produce the desired results more easily in the Web Source view or in the Paper Design view.
Oracle Reports also includes servlet technology. Servlets provide a Java-based alternative to CGI programs. Servlets provide a platform-independent method for building Web-based applications, without the performance limitations of CGI programs.
You can create a Web report in any of the following ways:
To preview your report output in a Web browser, use Program > Run Web Layout in the Paper Design view to run the Web Source. This enables you to immediately see the effect of your changes on the output.
Section 1.9.4, "About Parameter Forms for Web reports"
Section 2.8.8, "About HTML output"
Section 2.8.9, "About PDF output"
Section 3.6.1, "Creating a Web report"
Section 3.7.15.4, "Displaying report output in your Web browser"
Section 3.7.16.3, "Printing a report from your Web browser"
The topics in this section describe the built-in report styles in Reports Builder.
A tabular report is the most basic type of report. Each column corresponds to a column selected from the database.
Section 3.5.1, "Creating a report"
A group above report contains multiple groups in its data model. It is a "master/detail" report, where there may be a lot of information in the master group. For every master group, the related values of the detail group(s) are fetched from the database and are displayed below the master information.
Section 3.5.1, "Creating a report"
Section 3.8.4, "Creating a break group"
A group left report also contains multiple groups in its data model, dividing the rows of a table based on a common value in one of the columns. Use this type of report to restrict a column from repeating the same value several times while values of related columns change. The data model for group above and group left reports is the same, but the layouts differ; group above reports display the master information at the top while group left reports display break columns to the side.
Section 3.5.1, "Creating a report"
Section 3.8.4, "Creating a break group"
A form-like report displays one record per page, displaying field values to the right of field labels.
Section 3.5.1, "Creating a report"
A form letter report contains database values embedded in boilerplate text (any text that you enter or import into a Report Editor.)
Section 3.5.1, "Creating a report"
A mailing label report prints mailing labels in multiple columns on each page. Using the Report Wizard, you can specify the format for your mailing labels.
Section 3.5.1, "Creating a report"
A matrix (cross-product) report is a cross-tabulation of four groups of data:

Thus, to create a matrix report, you need at least four groups in the data model: one group must be a cross-product group, two of the groups must be within the cross-product group to furnish the "labels," and at least one group must provide the information to fill the cells. The groups can belong to a single query or to multiple queries.
A distinguishing feature of matrix reports is that the number of columns is not known until the data is fetched from the database.
With Reports Builder, you can create many different matrix reports. The four general types of matrix reports are simple matrix, nested matrix, multi-query matrix with break, and matrix break, but you are not confined to these designs.
In building your matrix data model, you should consider the following:
Although matrix reports always require at least four groups, they can be built with any number of queries. If you build a matrix report with only one query (usually the most efficient structure), you must create at least three groups in addition to the one created by default. If you build a matrix report with multiple (three or more) queries, you still need to create at least one additional group. The figure below illustrates the two types of query structures that you can use for your matrix data model.
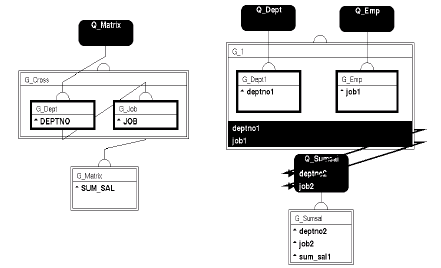
One advantage to a one-query data model is that the resulting report is generally more efficient than a report based on a multi-query data model.
Multi-query matrix. You may consider using a multi-query data model, as it often has simple queries and can be easier to maintain than the equivalent one-query data model. In addition, a multi-query data model is required for some types of matrices (e.g., some nested matrix reports).
Matrix reports are built with four or more groups:

The following figure shows graphical representations of how groups are related for both single and multi-query data models.
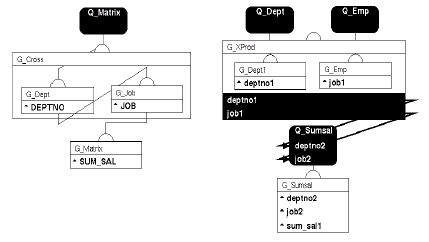
Notice that for each data model the cross product group is represented by the large rectangle, while the dimension groups are the smaller rectangles enclosed by it, and the cell group is shown outside of the cross product group.
Creating a summary for a matrix requires more information than creating a summary for other kinds of reports. When you create summary columns for your matrix, you need to indicate the following:
In Reports Builder, you specify this information by setting the Product Order property for your summary. All summaries that are owned by the cross product group require that a Product Order be specified. Suppose that you have a matrix report that looks something like the one below.
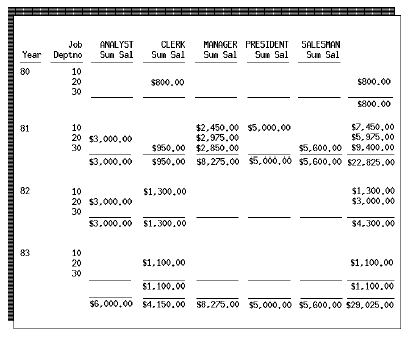
This is a nested matrix report. Assume that group G_YEAR contains the YEAR column, G_DEPT contains the DEPTNO column, G_JOB contains the JOB column, and G_CROSS is the cross product group.
To create the summary of salaries by job that appears at the bottom of the matrix for each job, you create a summary column in G_CROSS with the following property settings:

These settings specify that the summary should be calculated for each job in the G_JOB group and the summary should be reset to zero for each job in the G_JOB group.
To create the summary of salaries by year which appears at the right of the matrix directly underneath the boilerplate lines, you create a summary column in G_CROSS with the following property settings:

These settings specify that the summary should be calculated for each year in the G_YEAR group and the summary should be reset to zero for each year in the G_YEAR group. To create the summary of salaries by year and department that appears at the right of the matrix for each department row of the matrix that contains a value, you create a summary column in G_CROSS with the following property settings:

These settings specify that the summary should be calculated for each record of G_DEPT within each record of G_YEAR. G_DEPT comes after G_YEAR in the Product Order because, in this report, it changes more frequently than G_YEAR. If G_YEAR changed more frequently (i.e., years were listed for each department), it would make more sense to have a Product Order of G_DEPT, G_YEAR.
This summary is reset to zero for each record in the G_DEPT group. When you have multiple groups listed in Product Order and you want a non-running summary, the reset group should be the same as the last group in Product Order. When you have multiple groups listed in the Product Order and you want a running summary, the reset group should be a group other than the last one in the Product Order.
The figure below shows the objects that make up a simple, two-dimensional matrix. All of these objects are necessary for a matrix, except for the boilerplate field labels.
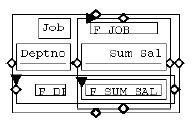
A matrix layout model must consist of the following layout objects:
The matrix object defines the intersection of at least two repeating frames. The repeating frames are the dimensions of the matrix and the matrix object contains the repeating frame that will hold the "filler" or values of the cell group. You need one matrix object for each pair of intersecting repeating frames in the layout. One of the repeating frames must have the Print Direction property set to Down and the other must have the Print Direction property set to Across in order to form a matrix.
For more details, see Section 2.3.7, "About matrix objects".
You can improve the performance of matrix reports with:
Section 2.3.7, "About matrix objects"
Section 2.1.7, "About nested matrix reports"
Section 2.1.8, "About matrix with group reports"
Section 2.4.2, "About layout defaulting"
Section 3.5.1, "Creating a report"
Reports Builder includes wizards to help you quickly and easily define a report and add objects to it. The topics in this section describe each Reports Builder wizard.
The Report Wizard helps you to quickly and easily define a single-query report for both Web and paper layouts. Reports Builder uses what you specify on each page of the wizard to create a data model and layout for your report. After the wizard has created the report, you can modify it using the Report Editor views. See Section 1.6.1, "About the Report Editor".
To re-enter the Report Wizard for an existing report:
For help on the fields on any tab page of the wizard, click Help at the bottom of the tab page.
The Report Block Wizard is a version of the Report Wizard. You can open an existing HTML document (Web page) and imbed a report in your Web page using the Report Block Wizard to specify the layout of the data.
To display the Report Block Wizard:
For help on the fields on any tab page of the wizard, click Help at the bottom of the tab page.
The Data Wizard helps you to quickly and easily define a query, break groups, and totals for a multi-query report. After the wizard has created the data model, you can:
To display the Data Wizard:
To re-enter the Data Wizard for an existing query, do either of the following:
For help on the fields on any tab page of the wizard, click Help at the bottom of the tab page.
The Graph Wizard produces graphs that are automatically translated into JSP tags to enable you to add graphics to Web reports. Reports Builder uses what you specify on each page of the wizard to create the desired graph.
The Graph Wizard replaces Oracle6i Graphics, or Graphics Builder. There is no separate graphics tool; all of the graphing options and controls are now available in Reports Builder through the Graph Wizard. Using the Graph Wizard, you can generate more complex graphs with a larger variety of graph types. For backward compatibility, Oracle6i Graphics charts are supported in Oracle Reports 10g.
For most graphing needs, the following primary graph types will provide the best means to represent data:
These are special usage or less common graphs that are associated with particular data types or ways to display unique cases of data:
Reports built with previous versions of Oracle Reports containing Oracle6i Graphics charts will continue to run if the Oracle6i Graphics runtime is installed on the same machine in a separate ORACLE_HOME. For more information, see "Displaying Oracle6i Graphics charts in Oracle Reports 10g" in the Migration Issues section of the Reports Builder online help.
To display the Graph Wizard for paper reports:
To display the Graph Wizard for JSP-based Web reports:
To re-enter the Graph Wizard for an existing graph in paper reports:
To re-enter the Graph Wizard for an existing graph in JSP-based Web reports:
rw:graph> and </rw:graph> tags, then choose Edit > Settings.
For help on the fields on any tab page of the wizard, click Help at the bottom of the tab page.
The topics in this section discuss the Object Navigator in Reports Builder.
The Object Navigator provides a hierarchical display of all objects in a report or template, including attached libraries and program units. Using the Object Navigator, you can:
Section 3.2.4, "Setting preferences for the Object Navigator"
The Object Navigator enables you to view objects by ownership hierarchy or by object type.
Section 3.2.4, "Setting preferences for the Object Navigator"
The topics in this section discuss the Report Editor and its different views of a report.
The Report Editor is a work area in which you can manipulate the objects in your report directly or by changing properties in the Property Inspector. In the Report Editor window, you can navigate between different views of your report: the Data Model view, Paper Layout view, Paper Design view, Paper Parameter Form view, and Web Source view.
The Report Editor's Data Model view is a work area in which you create, define, and modify data model objects (queries, groups, columns, and data links) to be used in your report. In this view, objects and their property settings are represented symbolically to highlight their types and relationships. To create the query objects for your data model, you can use the Report Wizard, Data Wizard, or the Query tools in the tool palette.
Reports Builder uses the data model to determine what data to retrieve for the report. The data retrieved from the database may or may not appear in the report output.
To display the Data Model view:
The Report Editor's Paper Layout view is a work area in which you can modify the format of your paper report. The default format for your report is defined by the information you specify in the Report Wizard. You can modify the format by working with layout objects, such as frames, repeating frames, fields, boilerplate, anchors, and graph objects. In this view, objects and their property settings are represented symbolically to highlight their types and relationships.
The Paper Layout view is similar to the Paper Design view, in that it is a work area in which you modify the format of your report. However, the Paper Design view allows you to preview your report and manipulate the actual, or live, data at the same time. In the Paper Design view, you can customize reports interactively, meaning that you can see the results immediately as you make each change. The Paper Design view is displayed only after you run a report.
To display the Paper Layout view:
The Report Editor's Paper Design view is a work area in which you can preview your paper report and manipulate the actual, or live, data at the same time. In the Paper Design view, you can customize reports interactively, meaning that you can see the results immediately as you make each change.
To edit your report, such as changing column size, the Paper Design view must be in Flex mode.
The Paper Design view is displayed whenever you run a report. To run a report from the Object Navigator or any editor, click the Run Paper Layout button in the toolbar or choose Program > Run Paper Layout. To run a report from the Report Wizard, click Finish.
You can also display the Paper Design view in these ways:
To speed the execution of your report, avoid "fetching ahead" when sending report output to the Paper Design view. The following items can result in fetching ahead when referenced before the data on which they rely:
Matrix (cross-product) groups also cause fetching ahead. In order to cross-tabulate the data, Reports Builder must first fetch all of the data.
It should be noted that while these items slow down the Paper Design view, they do not affect performance when writing to a file or some other destination.
The Report Editor's Paper Parameter Form view is a work area in which you define the format of the report's Runtime Parameter Form. To do this, you define and modify parameter form objects (fields and boilerplate). You can select pre-defined system parameters for your report using the Parameter Form Builder, or you can create your own.
When you run a report, Reports Builder uses the Paper Parameter Form view as a template for the Runtime Parameter Form. Fields and boilerplate appear in the Runtime Parameter Form exactly as they appear in the Paper Parameter Form view. If you do not define a Runtime Parameter Form in the Paper Parameter Form view, Reports Builder displays a default Runtime Parameter Form for you at runtime.
|
Note: At runtime, the Runtime Parameter Form displays only when running the paper report layout. For JSP-based Web reports, the Runtime Parameter Form displays when you run your report within Reports Builder for debugging purposes, but will not display at runtime. For more information, see Section 1.9.4, "About Parameter Forms for Web reports". |
To display the Paper Parameter Form view:
The Report Editor's Web Source view displays the source code for your Web report, including HTML tags and JSP tags. It is a Web page where you can view and add dynamic report blocks using the Report Block Wizard, and graphs using the Graph Wizard. Experienced Web developers can edit the Web source directly in this view using the Oracle Reports custom JSP tags.
To display the Web Source view, do any of the following:
Section 1.2.2, "About Web reports"
Section 2.2.1, "About JavaServer Pages (JSPs) and servlets"
Section 3.6.3, "Adding report data to an existing Web page (HTML file)"
Section 3.6.4, "Adding a report block to a Web page"
Section 3.6.5, "Adding a graph to a Web report"
"Custom JSP tags for Oracle Reports" in the Reference section of the Reports Builder online help
The tool palette and toolbar contain tools used to manually create or manipulate objects in the Report Editor views (excluding the Web Source view). Each tool appears as an icon. Some tools, such as the Select tool, are common to tool palettes in all Report Editor views. Other tools are specific to the views in which they appear. In Reports Builder, run your cursor over a tool to display the hint text that identifies the tool.
The tool palette is positioned along the left side of the Report Editor views. Click a tool to activate it for a single operation, or double-click a tool to "lock" it for multiple operations. You can hide the tool palette by choosing View > Tool Palette to deselect it.
The toolbar is positioned along the top of the Report Editor views. To use the tools in the toolbar, click the desired tool to perform the action. All toolbar tools also have menu equivalents. If the tool is designed to perform an action on a group of objects, it appears grayed out until one or more objects are selected. Then clicking the tool performs the action on the selected object(s).
Appendix A, "Tool Palette and Toolbar Reference"
The topics in this section discuss basic concepts of data model objects; for more advanced concepts, see Section 2.3, "Data Model Objects".
Queries provide the data for your report. You create a query using the Report Wizard, Data Wizard, or manually using the query tools in the Data Model tool palette. Queries can select data from any data source (Oracle, XML, JDBC, Text, Oracle Express, or your own data source that you can access via the pluggable data source (PDS) API). You can also use ref cursors to create queries.
Reports built using one query are the simplest reports. The most popular formats for single-query reports are tabular, mailing label, form letter, and break (either group above or group left). In one report, you can display one query's data any number of times, even in different formats. You can query data without including it in the report output. This is useful for establishing relationships between multiple queries, performing calculations, and so on.
The figure below shows the data of one query formatted various ways.
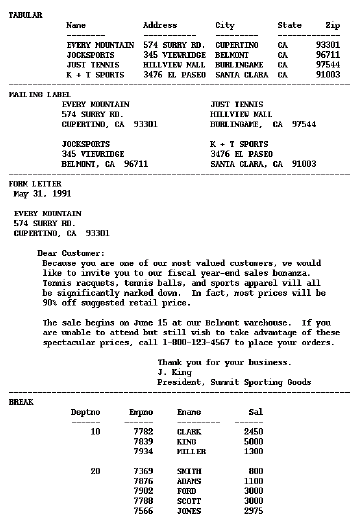
Notice that the last report style (group left break) seems to use an entirely different query for its data than the first three. However, the data it displays was hidden in the other reports, and vice versa. With Reports Builder, you can query data without including it in the report output. This is useful for establishing relationships between multiple queries, performing calculations, and so on.
A report may contain any number of queries. Multi-query reports are useful when you want to:
If you create a report with multiple queries, you can either leave the queries unrelated, or establish a relationship between them using a data link.
If you do not link the queries, you'll produce a multi-part unrelated query report (commonly called a master/master report). These types of reports display lists of unrelated data. For example, in the report below, one query selects products and another selects customers. Notice that there is no relationship between the products and customers.
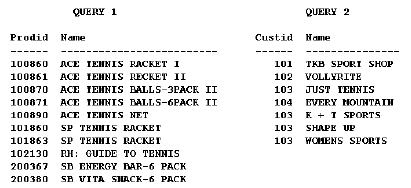
In many reports, the data fetched for one part of the report is determined by the data fetched for another part. This is termed a "master/detail," or "parent/child," relationship, and is defined with a data link between two queries. When you run a master/detail report, each row of the master (or parent) query will cause the detail (or child) query to be executed, retrieving only matching rows.
For a single-query report, Reports Builder opens only one cursor to fetch all of the master and detail records. For a two-query report, Reports Builder opens two cursors--one for each query--after appending the detail query's link to the WHERE clause of the detail query. Therefore, for each master record fetched in the master query, Reports Builder must rebind, execute, and fetch data from the detail query.
Section 2.3.5, "About non-linkable queries"
Section 3.8.1, "Creating a query"
Groups are created to organize the columns in your report. Groups can do two things: separate a query's data into sets, and filter a query's data.
When you create a query, Reports Builder automatically creates a group that contains the columns selected by the query. You create additional groups to produce break levels in the report, either manually in the Data Model view or by using the Report Wizard to create a group above or group left report.
Create groups when you want to treat some columns differently than others. For example, you create groups to:
With the exception of cross-product groups, all user-created groups are called break groups.
You create break groups to produce subtotals, print columns in a different direction, create breaks, and so on. A break group suppresses duplicate values in sequential records. For example, Reports Builder can select the department number for each record; however, the duplicate department numbers are not printed.
You create cross-product groups to perform mathematical cross products, which are generally used to create matrix reports.
Filters enable you to conditionally remove records selected by your queries. Groups can have two types of filters:
Section 2.3.6, "About links versus groups"
Section 2.6.9, "About group filters"
Section 1.3.2, "About group above reports"
Section 1.3.3, "About group left reports"
Section 2.1.8, "About matrix with group reports"
Section 3.5.1, "Creating a report"
Section 3.5.2, "Creating a multiquery group above report"
Section 3.8.4, "Creating a break group"
Section 3.8.5, "Creating a matrix (cross-product) group"
A database column represents a column that is selected by the query, containing the data values for a report. For each column that you select in your query, Reports Builder automatically creates a column in the data model of your report. If you want to perform summaries and computations on database column values, you can create new columns manually in the Data Model view (for summary and formula columns) or by using the Report Wizard (for summary columns). You can also reassign one or more columns to a group or groups you've created.
In addition to the traditional column types (e.g., date, number, character), Reports Builder also supports graphic columns, which are columns whose values can be:
Section 3.8.1, "Creating a query"
Section 3.9.8.7, "Selecting an image from the database"
Section 2.3.4, "About referencing columns and parameters"
Section 2.3.1, "About summary columns"
Section 2.3.2, "About formula columns"
Section 2.3.3, "About placeholder columns"
A data link (or parent-child relationship) relates the results of multiple queries. A data link can establish these relationships:
A data link causes the child query to be executed once for each instance of its parent group. The child query is executed with the values of the primary key used by the parent.
When a report with a data link is executed, the data link is converted into a SQL clause (as specified in the link's Property Inspector) and appended to the child query if Reports Builder is able to parse the query. Important note: If the query cannot be parsed, the query is not modified (for example, Reports Builder has no way to modify how the data is fetched when the query is defined for a pluggable data source).
Although links are commonly equijoins (e.g., WHERE DEPTNO =DEPTNO), you can create links with various SQL clauses (i.e., WHERE, HAVING, or START WITH) and conditions. If your database has database constraints, you can create a data link that derives its SQL clause and condition from the constraints. You can view the SELECT statements for the individual parent and child queries in Reports Builder, but can not view the SELECT statement that includes the clause created by the data link you define.
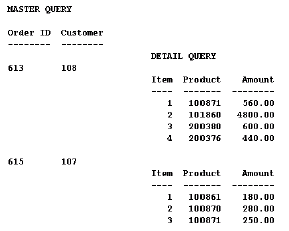
For the report below, the following link was defined:

The default group of the master query (containing the columns "Order ID" and "Customer") is the parent group; the detail query (the query to which "Item", "Product" and "Amount" belong) is the child query.
Section 2.3.6, "About links versus groups"
Section 2.3.5, "About non-linkable queries"
Section 3.8.6, "Creating a data link"
Query Builder is an easy-to-use data access tool designed for analysts, managers, and other business professionals. It provides a logical and intuitive means to access information from your organization's databases for analysis and reporting.
Query Builder is designed for professionals who do not have a computer programming or database background. Because of its powerful query features and its support of Structured Query Language (SQL) statements, experienced database users and programmers will find that Query Builder serves many of their needs as well.
In Query Builder's graphical Query window, you can specify a request for data from your organization's database(s). The request for data is called a query.
You can use Query Builder to define almost any query that you would build using a SQL SELECT statement. Query Builder automatically generates the appropriate SELECT FROM [table.column] clause based on columns displayed in the Query Builder workspace.
Section 3.8.3, "Using Query Builder"
The topics in this section discuss basic concepts of layout objects; for more advanced concepts, see Section 2.4, "Layout Objects".
Frames surround other objects and protect them from being overwritten or pushed by other objects. For example, a frame might be used to surround all objects owned by a group, to surround column headings, or to surround summaries.
When you default the layout for a report, Reports Builder creates frames around report objects as needed; you can also create a frame manually in the Paper Layout view. See Section 1.6.3, "About the Paper Layout view".
Create frames when you want to:
Example: You want the top of each page to have a tabular format, but the bottom of each page to have a matrix format.
Example: A summary is centered under two repeating frames. Defaulting rules state that the summary must remain at a fixed distance from only the first object that can overwrite it; therefore, the summary is in danger of being overwritten by the second repeating frame. Enclosing both repeating frames with a frame will force the summary to maintain a fixed distance from both of them, and it will not be overwritten.
Example: A summary is centered under two repeating frames. According to defaulting rules, the summary will print as soon as the first repeating frame finishes printing. Create a frame around the two repeating frames to ensure the summary prints after both repeating frames have finished printing.
Section 3.9.1.2, "Creating a frame or repeating frame"
Repeating frames surround all of the fields that are created for a group's columns. The repeating frame prints (is fired) once for each record of the group.
When you default the layout for a report, Reports Builder generates one repeating frame for each group in the data model, and places one field inside it for each of the group's columns. Repeating frames can enclose any layout object, including other repeating frames. Nested repeating frames are typically used to produce master/detail and break reports. For each record of the outer repeating frame, Reports Builder will format all related records of the enclosed repeating frame.
You can also create a repeating frame manually in the Paper Layout view. See Section 1.6.3, "About the Paper Layout view".
Section 3.9.1.2, "Creating a frame or repeating frame"
For each object or record, a frame or repeating frame's size can be expandable, contractible, variable, or fixed (specified by the Horizontal Elasticity and Vertical Elasticity properties). For example, you can set the properties to specify that it should be fixed in size horizontally, but expand vertically if a record requires more space.
In the figure below, notice that there are four records for department 20, but only one record each for departments 10 and 30. The repeating frame has expanded vertically to accommodate department 20's additional records.
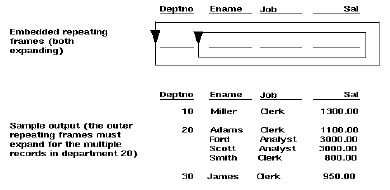
Frames or repeating frames that contract horizontally or vertically reduce in size when an object or record requires less space than the frame or repeating frame's initial size. A frame or repeating frame may also be variable in size: it expands or contracts based on the size of the value it displays. Also, if a frame or repeating frame is fixed in size and an object or record's data requires a larger field than it can contain, the remaining data will be pushed onto the following page(s) in the same x- and y-coordinates.
Section 3.9.1.2, "Creating a frame or repeating frame"
Fields are placeholders for parameters, columns, and such values as the page number, current date, etc. If a parameter or column does not have an associated field, its values will not appear in the report output. A field is owned by the object surrounding it, which is the first enclosing object (either a frame or repeating frame).
When you default the layout for a report, Reports Builder generates one field for each column, and places each field inside of a repeating frame. You can also create a field manually in the Paper Design view, Paper Layout view or Paper Parameter Form view.
Section 1.9.2, "About Parameter Form fields"
Section 3.9.1.1, "Creating a field object"
Section 3.9.2.4, "Referencing a field in boilerplate text"
A boilerplate object is any text, lines, or graphics that appear in a report every time it is run.
Reports Builder creates one boilerplate object for each label selected in the Report Wizard (it is named B_columnname). For example, if a column is named ENAME, a boilerplate object containing "Ename" is generated for the column. For some report types, Reports Builder also generates lines under the labels.
You can also create a boilerplate objects manually in the Paper Design view, Paper Layout view, or Paper Parameter Form view using any of the following tools in the tool palette:
See Section 1.6.4, "About the Paper Design view", Section 1.6.3, "About the Paper Layout view", and Section 1.6.5, "About the Paper Parameter Form view".
If you have text, graphics, or HTML in a file that you would like to display as boilerplate in your report, you can link to the file, as described in the following procedures:
Linking to a file means that the contents of the file are pulled into the boilerplate object each time the report is run. In this way, you can ensure that your output includes the most recent changes to the file.
You can also link a boilerplate image object to a URL where the image is located. See Section 3.9.8.10, "Linking an image object to a URL".
Section 1.9.3, "About Parameter Form boilerplate"
Section 3.9.2.1, "Creating a boilerplate object for text"
Section 3.9.2.2, "Creating a boilerplate object for text that displays every other page"
Section 3.9.2.4, "Referencing a field in boilerplate text"
Section 3.9.11.8, "Rotating a boilerplate object"
The topics in this section discuss basic concepts of Parameter Form objects; for more advanced concepts, see Section 2.5, "Parameter Form Objects".
A parameter is a variable whose value can be set at runtime (e.g., from the Runtime Parameter Form or the command line). Parameters are especially useful for modifying SELECT statements and setting PL/SQL variables at runtime.
Reports Builder automatically creates a set of system parameters at runtime, but you can create your own as well. You can create parameters to replace either single literal values or entire expressions in any part of a query. You can reference parameters elsewhere in the report, such as in PL/SQL constructs providing conditional logic for the report.
Parameter values can be specified in these ways:
Reports Builder is shipped with the following parameters. You can change their default values as described above.
You can create a user parameter in the following ways:
Section 2.3.4, "About referencing columns and parameters"
Section 3.11.1, "Using a pre-defined system parameter"
Section 3.11.2, "Creating a user parameter"
Section 3.11.3, "Creating a list of values (LOV) for a parameter"
Section 3.11.4, "Validating a parameter value at runtime"
Section 3.11.6, "Selecting parameters to include in the Runtime Parameter Form"
Section 3.11.9, "Passing parameters to reports running in batch mode"
Fields in the Paper Parameter Form view (Section 1.6.5, "About the Paper Parameter Form view") act as placeholders for parameters. They define the formatting attributes for the parameters displayed in the Runtime Parameter Form. By default, one field is created for each parameter.
Section 3.11.5, "Creating a default Parameter Form"
Section 3.11.7, "Displaying the Parameter Form at runtime"
Boilerplate in the Paper Parameter Form view refers to text and graphics that appear in the Runtime Parameter Form each time it is run; for example, a label denoting a particular parameter is boilerplate text created by Reports Builder. Lines or boxes that you create in the layout are also considered boilerplate, as well as any added text.
Boilerplate enables you to customize the Runtime Parameter Form. By default, a boilerplate label is produced for each field that appears on the Runtime Parameter Form.
Section 1.8.5, "About boilerplate objects"
Section 3.11.5, "Creating a default Parameter Form"
Section 3.11.7, "Displaying the Parameter Form at runtime"
You can design a Parameter Form for both Web and paper reports. However, at runtime, the Runtime Parameter Form displays only when running the paper report layout. For JSP-based Web reports, the Runtime Parameter Form displays when you run your report within Reports Builder for debugging purposes, but will not display at runtime.
Because you now have the flexibility to display your reports on any Web page, the report may be just one object on a Web page containing many other portlets and objects, and parameters for the report may be retrieved from sources other than the Parameter Form. For example, parameters might be provided by the Web page to all portlets on the page. Therefore, it does not make sense to display a Runtime Parameter Form for JSP-based Web reports before the report is formatted.
In the absence of the Runtime Parameter Form, you will need to use an alternate method to provide required parameters to a JSP-based Web report designed with a Parameter Form. For example:
<% String myParameterList = "userid=scott/tiger&p_deptno+10"; %>
<rw:report id="myReport" parameters="<%= myParameterList %>">
For more information on creating a Parameter Form for a JSP-based Web report, see Chapter 39, "Building a Simple Parameter Form for a JSP-based Web Report".
Section 1.2.2, "About Web reports"
Section 1.6.5, "About the Paper Parameter Form view"
Section 1.11.1, "About the Runtime Parameter Form"
Section 2.5.1, "About Parameter Form HTML extensions"
The topics in this section discuss the Property Inspector in Reports Builder.
The Property Inspector is a windows that enables you to access the properties of the currently selected object(s) in the Object Navigator, Report Editor, and Template Editor. Every Reports Builder object (query, group, frame, parameter, etc.) has associated properties that can be viewed using the Property Inspector.
See Section 1.5.1, "About the Object Navigator", Section 1.6.1, "About the Report Editor", and Section 2.7.5, "About the Template Editor".
To get help on any property, click the property in the Property Inspector and press F1.
You can select multiple objects at the same time by using Shift+Click or Ctrl+Click in the navigators or the editors. When two or more objects are selected, a list of object names is displayed at the top of the Property Inspector.
The Intersection/Union button on the Property Inspector toolbar determines which properties are displayed in the property list when more than one object is selected. Toggling between Intersection and Union changes the list of properties displayed in the Property Inspector, but does not affect the setting of any property.
| Button | Description |
|---|---|
|
Intersection |
The default. Only properties common to all selected objects are displayed. |
|
Union |
All properties of every object selected are displayed. |
Properties that are common to two or more objects in a multiple selection are listed only once, and the property setting is displayed as follows:
Section 3.2.2, "Setting report properties"
Section 3.2.5, "Setting properties for an ASCII (character-mode) report"
Section 3.2.7, "Setting properties of multiple objects"
Section 3.2.8, "Comparing the properties of one object to another"
The topic in this section discuss the views of a report shown at runtime.
The Runtime Parameter Form is a dialog box that optionally displays at runtime in which you can override default parameter values (e.g., values that modify SELECT statements, route the report output to a specified device, etc.). You define the format of the Runtime Parameter Form in the Paper Parameter Form view. If you do not define a Runtime Parameter Form in the Paper Parameter Form view, Reports Builder displays a default Runtime Parameter Form for you at runtime.
Change the parameters as desired and then click the Run Paper Layout button in the toolbar to run the report.
Alternatively, you can click the Cancel Run button in the toolbar to cancel.
Section 1.6.5, "About the Paper Parameter Form view"
Section 1.9.4, "About Parameter Forms for Web reports"
Section 3.11.7, "Displaying the Parameter Form at runtime"
The Previewer displays on your screen how the printed version of your report will look. In the Previewer, you can scroll though a single page of report output, page through the entire report, and split the screen to view different sections of the same report concurrently. You can also perform the following actions:
A physical page (or panel) is the size of a page that will be output by your printer. A logical page is the size of one page of your actual report (it can be any number of physical pages wide or long). The Previewer displays the logical pages of your report output, one at a time.
To display the Previewer:
To speed the execution of your report, avoid "fetching ahead" when sending report output to the Previewer or Paper Design view. The following items can result in fetching ahead when referenced before the data on which they rely:
Matrix (cross-product) groups also cause fetching ahead. In order to cross-tabulate the data, Reports Builder must first fetch all of the data.
It should be noted that while these items slow down the Previewer or Paper Design view, they do not affect performance when writing to a file or some other destination.
Section 3.7.15.3, "Displaying report output in the Previewer"
Section 3.7.16.2, "Printing a report from the Previewer"
The Oracle Reports executables are:
All executables can be run from the command line. See the Reference > Command Line section of the Reports Builder online help for detailed information about the executables and command line keywords.
Section 3.7.2, "Running a report from the command line"
|
|
 Copyright © 2002, 2003 Oracle Corporation. All Rights Reserved. |
|