| Bookshelf Home | Contents | Index | PDF | |
|
Siebel Analytics User Guide > Getting Started with Siebel Analytics > Navigating in Siebel AnalyticsThis section explains basic navigation within Siebel Analytics. It contains the following topics:
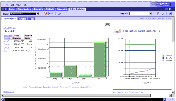
What You See After Accessing Siebel AnalyticsWhen you access Siebel Analytics, the first screen you usually see is your personal dashboard, named My Dashboard, or a dashboard for your job function. Dashboards typically contains reports and other information for your area of responsibility. For more information about dashboards, see Using Siebel Intelligence Dashboards. Figure 2 shows an example My Dashboard page from an sample Siebel Analytics application. You can change the appearance of the My Dashboard page based on your personal preferences. NOTE: Your dashboard may look different than the example. Using Siebel Analytics Feature LinksThis section describes the links that provide access to Siebel Analytics functions.
Table 2 describes some of the Siebel Analytics feature links. Working with Siebel Analytics PagesSiebel Analytics is organized into pages. Pages have two components:
Siebel Analytics feature links are used to access these pages. Each feature link provides access to a specific feature or topic. Pages can contain other organization and navigation elements, such as tabs, areas, and panes. For information about feature links, see Using Siebel Analytics Feature Links. Drilling Down in Siebel AnalyticsMany of the results that appear in Siebel Analytics represent hierarchical data structures. Siebel Analytics metadata specifies these hierarchies, and this allows you to access the different levels of detail within them. For example, information in a sales chart may be categorized by region. Clicking on a specific region in the chart may display each country within that region, if the country is the next level within the hierarchy of the metadata. You can drill down to an actual item in the database. For example, if you work in sales, you can drill down to the city level within a sales report, and see that there is a large sale pending in Paris. If you are using a Siebel eBusiness application, you can then drill down on the pending sale and go directly to that opportunity in the Siebel eBusiness application. |
 |
|
| Siebel Analytics User Guide |