| Bookshelf Home | Contents | Index | PDF | |
|
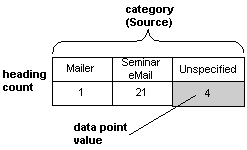
Configuring Siebel eBusiness Applications > Configuring Special Purpose Applets > Understanding How Chart Applets Are Constructed > Business Component MappingA chart applet has, like all applets, a business component identified in its Business Component property. Records in this business component—subject to the current view, the current query, and visibility considerations—provide the data displayed in the applet. In the case of a chart applet, specific fields are used to provide the data for the category, data point, and series axes. The correspondence between axes and fields is specified in properties in the Chart object definition. In the simplest case—a single bar or line graph, with no series axis—a category field and a data point field are specified. Pairs of category and data point field values are plotted as points or bars. If multiple records have the same category value, their data point values are added together. The Oppty Chart Applet - Source Analysis applet provides an illustration of this process (Figure 114). This applet displays the number of opportunities on the data point axis plotted against the source of the opportunity (referral, magazine article, Web site, and so on) on the category axis. To generate the data required for the curve, the Source field in each record is checked and the number of opportunities for each distinct source value is tallied. The result is a two-row temporary table with a column for each source, as shown in Figure 115. For a multiple-curve chart, a row is added to the temporary table for each curve in the series (Figure 116). The temporary table for a multiple-curve chart is illustrated in Figure 117. To define the data mapping from the business component into the chart applet, you need to define the following properties in the Chart object:
The preceding descriptions cover the use of these properties for the most general cases. There are a number of special cases in which these properties are configured differently than described. Some special case configuration scenarios are described in the sections that follow. For descriptions of the properties, see Object Types Reference. |
 |
|
| Configuring Siebel eBusiness Applications |