This topic explains how to debug an application.
Note that because of the possibility of name space collisions, you can only
debug JSPs in one web application at a time. For details on switching projects
when debugging JSP's see Special
Considerations When Debugging JSPs.
You can debug Java classes from EJB and Utility projects deployed to
the same server, regardless of which project is selected for debug, because name
space collisions does not occur with Java classes in different projects.
Before you debug an application, you must define a server and add the application to it. Follow the instructions below for individual server types.
If you are deploying an EAR project that contains multiple web applications, you must update your server definition to specify WAR deployment (not the default "exploded" mode) before debugging your project/application. Click the link for your server (below) for instructions on specifying WAR deployment:
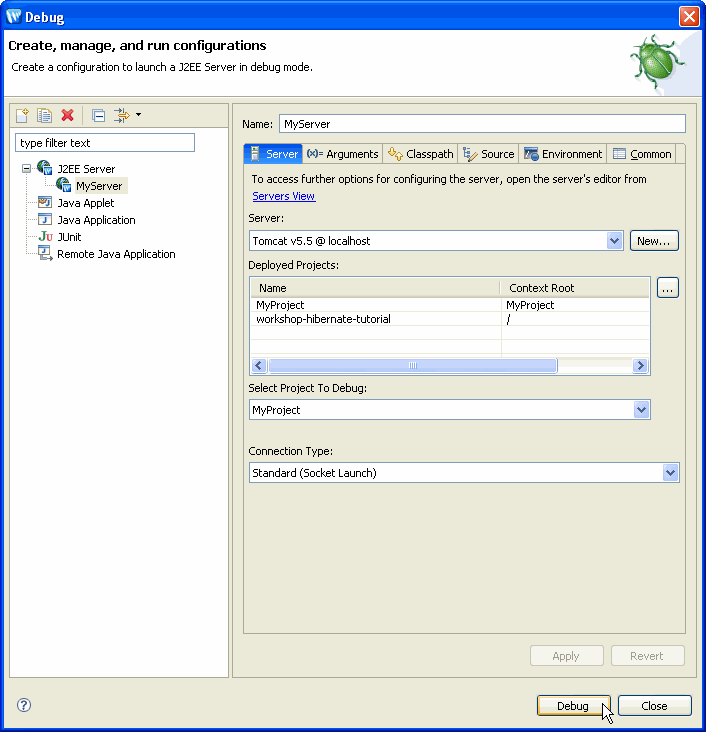
Once your server is defined, to debug an application, choose Run > Debug. The following dialog is displayed.

- Choose the server from the list of defined servers under J2EE Server.
- Choose the project to debug.
- Click Apply to save changes.
- Click Debug to start the server and run the application.
Once the debugger launches, Debug perspective will open.
Extended Debugger Features
For information on using the Eclipse debugger, consult Help > Help Contents > Java Development User Guide. The Workshop family of products extends the Eclipse debugger to provide the following additional features.
JSP Variables View
The JSP Variables view (available in the Debug perspective) shows the variables accessible by this page regardless of their origin (JSP page, Struts action, and so forth). This saves you time looking for the variables you are using in the page in the application server-specific maps.
It has five categories:
- Available Variables
These are the variables used by the page. The JSP Variables view can also display also the variables which have not been initialized yet. To enable this feature unselect the Show Initialized Only menu item from the pull down menu. - Page Attributes
Page context attributes - Request Attributes
Request context attributes - Session Attributes
Session context attributes - Application Attributes
Application context attributes
JSP Breakpoints
JSP breakpoints can be added, removed, enabled or disabled from the vertical ruler of the Workshop editor either by double-clicking on a line or by using the context menu.
JSP breakpoints can be set at the following locations:
- JSP custom tags.
- Most of the JSP action and scripting elements .
- Scriptlets containing Java code.
- EL expression (if supported by the server) .
JSP Stepping
The JSP debugger can step through the JSP source or through the server generated Java source. In JSP mode the stepping commands are declared as follows:
Step Over
The JSP debugger will step over the following elements:
- JSP custom tags
- Most of the JSP action and scripting elements
- Scriptlets containing Java code
- EL expression (if supported by the server)
Step Into
- JSP custom tag - steps directly into the custom tag implementation. It might be a Tag file or a Java source file.
- <jsp:include> - steps into the file pointed by the page attribute.
- <jsp:forward> - steps into the file pointed by the page attribute.
- <jsp:invoke> - steps into the fragment code.
- <c:import> - steps into the file pointed by the url attribute.
- EL function - steps into the Java source of the function.
- Java scriptlet - steps into the Java source like the standard Eclipse debugger
Step Return
Step return works exactly like the Java equivalent.
The server generated Java source behind the JSP page can be seen by selecting the "Show Java Source" inside the Debug View pull down menu. When in the mode the debugger steps over the Java lines.
Special Considerations When Debugging JSPs
- Only JSPs from one web app can be debugged at a time. (This limitation
is caused by a potential name space conflict between two JSPs with same
name from different web applications.)
- The server must
be restarted when switching to debug a different web application. (When
the server starts, it sets the web application root as the JSP source
lookup; this cannot be changed over the debug session.)
Note: For applications deployed to WebLogic Server 9.x and 10.x you can avoid restarting the server when switching to debug another project. To switch projects without restarting the server:
(1) Open the Debug perspective.
(2) In the Debug view, right-click your server configuration and select Disconnect.
(3) Select Run > Debug. In the Select Project To Debug dropdown, select a new project. Click Apply and Close.
(4) Open the J2EE perspective. In the Project Explorer view, right-click the new project to debug and select Debug As > Debug on Server. In the Debug On Server dialog, click Finish. In the Debug on Server dialog, ensure that Switch mode is selected and click OK. - The server should not have been previously started in debug mode. Instead, the server should be started or restarted using Run > Debug As > Debug on Server. (If the server has been previously started in debug mode, the debug session finds no project to debug and no JSP source lookup folder is added.)
- Consider using the Sun JDK instead of JRockit when debugging JSPs.