13 Using JVM Diagnostics
This chapter describes the various tasks you can perform using JVM Diagnostics. In particular, it contains the following:
Accessing the JVM Diagnostics Pages
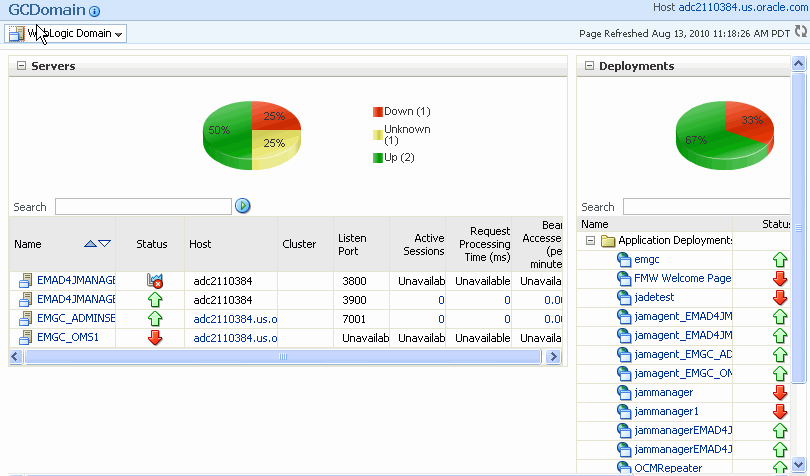
After the JVM Diagnostics Manager has been installed, you can start using the features. Navigate to the Middleware tab in Enterprise Manager and click on a WebLogic target. The WebLogic Domain Home page is displayed.
To start using JVM Diagnostics, select the JVM Diagnostics option from the WebLogic Domain drop-down menu and choose the appropriate option.
Viewing the Domain (Pool) Summary and Details Pages
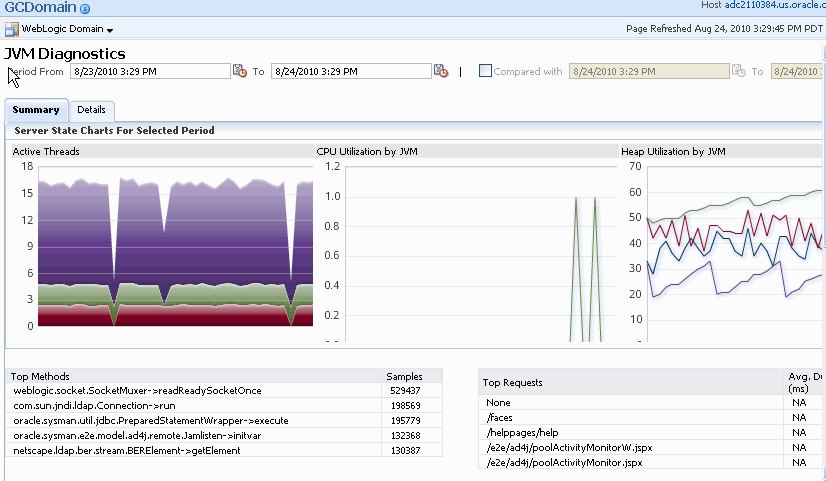
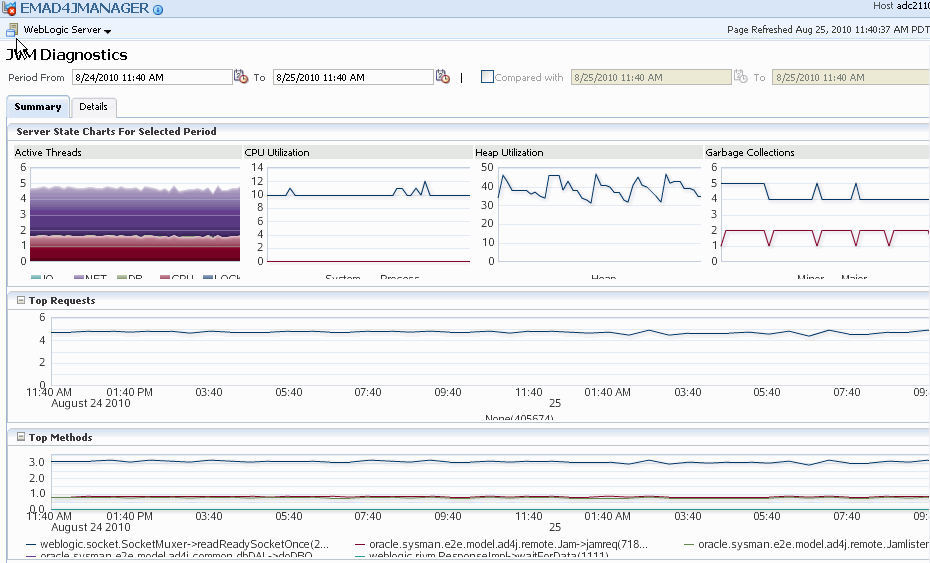
You can view the summary and detailed information of the JVM pools in the selected WebLogic domain on this page. You can also compare the JVM pool data across two periods in the domain. To view this page, click the Summary option from the JVM Diagnostics menu.
This page contains the Summary and Details tabs. The Summary tab shows the summary details of the JVM pools which include the Server State Charts, and a list of Top Methods and Top Requests.
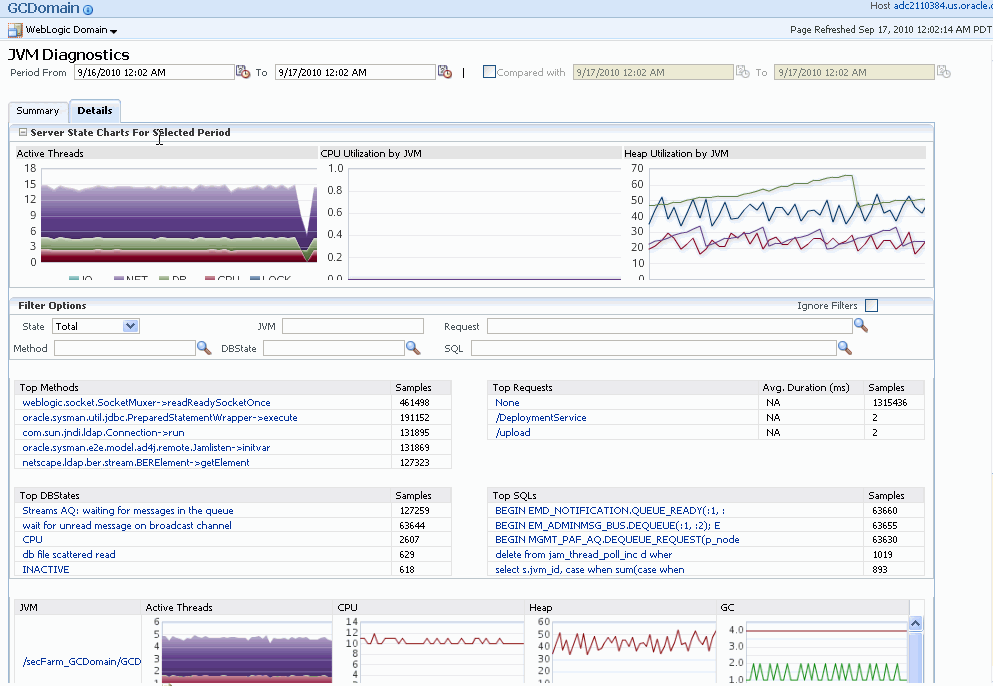
Click the Details tab to view the Details page.
You can view the Server State Charts, list of Top Methods, Top Requests, Top DBStates, and Top SQLs. You can filter the data that is displayed by specifying various criteria such as Method Name, JVM Name, Thread State, DBState, and so on. You can also view server state charts for each JVM in the pool.
Viewing the Domain (Pool) Real Time Thread Analysis Page
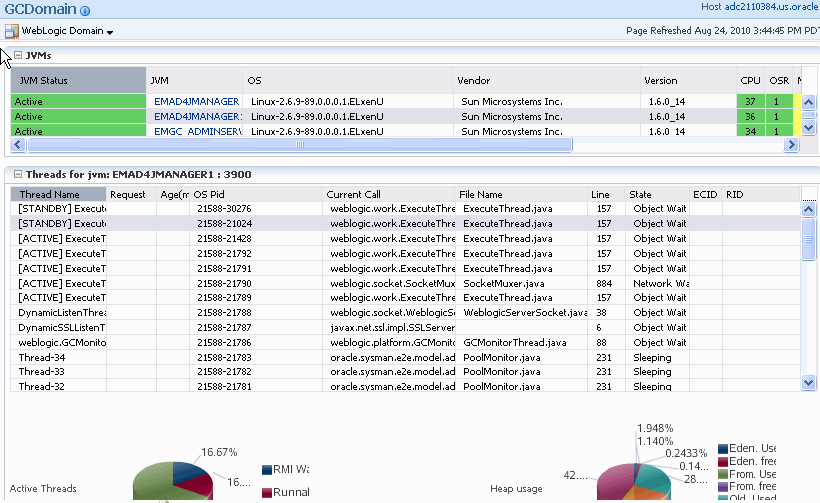
This page shows the real-time data for all the JVMs in the selected domain. To view this page, click Threads and Real-Time Analysis from the JVM Diagnostics menu.
The first table on this page shows the list of JVMs and the current status of each JVM. The current activity of the JVM including CPU usage, memory, number of threads waiting for a database response, number of threads waiting for synchronization lock, and other details are displayed.
Click on a JVM link in the JVM column to view the list of threads for the JVM. You can also see two charts, the first one displays the active threads in the JVM, the second one displays the heap status for the JVM.
Viewing the JVM Summary and Details Pages
This page shows the summary and detailed information for a specific JVM. To view this page, navigate to a WebLogic Domain Home page, select a JVM from the left panel, click JVM Diagnostics and the Summary option from the menu.
This page contains the Summary and Details tabs. The Summary tab shows the summary details of the JVM pools which include the Server State Charts, Top Methods, and Top Requests charts. Click the Details tab to view the Details page. You can view the Server State Charts, list of Active Threads by State, Top Methods, Top Requests, Top DBStates, and Top SQLs. You can filter the data that is displayed by specifying various criteria such as Method Name, JVM Name, Thread State, DBState, and so on.
Viewing the JVM Real Time Thread Analysis Page
This page shows the real-time data for a selected JVM. To view this page, navigate to a WebLogic Domain Home page, select a JVM from the left panel and click JVM Diagnostics. From the JVM Diagnostics menu, click Threads and Real-Time Analysis.
This page shows the following:
-
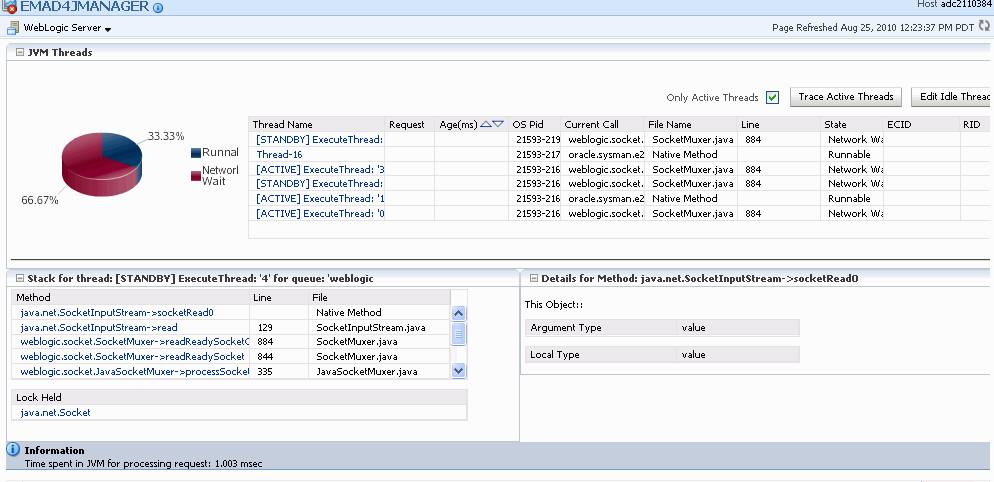
JVM Threads: This table shows detailed information for all threads running in the JVM. Check the Only Active Threads checkbox to view only the active threads running in the JVM. Click Trace Active Threads to monitor all the active threads at a high frequency for a short period of time. For threads in DB Wait state, you can drill down to the DB Session page. Click Edit Idle Thread Rule to drill down to the Idle Thread Rule page. On this page, you can create Idle Thread Rules and add threads to the rule. All threads part of the rule will be marked as idle threads and will not be monitored.
-
Thread State Chart: This chart groups threads according to their state. For example, the chart shows threads in network wait state, threads in runnable state, object wait state and so on.
-
Thread Stack: Click on a Thread Name in the JVM Thread table to see the call stack for the thread.
-
Method Locals: Click on the Method Name to see method locals in bottom right panel.
-
Object Details: Click on an Object Name to see the object details.
Viewing the JVM Real Time Memory Analysis Page
This page shows the real time organization of all objects in the JVM Heap. To navigate to this page, click the JVM Diagnostics link in the Middleware page. Click All in the left panel to do a real time memory analysis of all the objects in the JVM Heap.
Using the Setup Pages
This section describes the pages under the Setup menu. To access these pages, click Setup option from the JVM Diagnostics menu.
Console Setup Page
This page is used to set console parameters and reset lost passwords. You can specify the following parameters on this page:
-
Console Log Level, Cross Tier Log Level: Verbosity of console log messages. Increase only when advised by Oracle Support.
-
Agent Request Timeout, Agent Loop Request Timeout: Increase if the monitored JVMs are extremely busy and the console times out and disconnects waiting for their response.
-
Require Login for Java Tab: Enable this checkbox to restrict access to other (non-setup Tabs). Users will need to login with valid accounts (created from the Users screen) and will have access to all non-setup screens. The setup screens can only be accessed by the ADMIN user.
-
Enable Monitoring: With this checkbox enabled, JVMs belonging to selected pools will be polled for active requests periodically. This data is available on the NOC and in the last 90 seconds/24 hrs charts.
-
Email Alerts: Email alerts based upon threshold violations (requires monitoring to be enabled).
-
SNMP Host for Alerts: SNMP Host to which the alerts should be sent.
Click Save to set the new parameters or Reset to use the existing parameters.
JVM Pool Info
You can group sets of JVMs into JVM pools that provide monitoring information across all related JVMs in a single view. This table displays all the JVM pools in the system. You can view all available pools, delete existing pools or add new pools. The Default and Other pools cannot be deleted. Any user defined pools can be deleted.
Each row displays whether polling is currently enabled for the pool, the polling interval, and the email notification recipient. If the Polling Enabled flag is set to Y, JVMs belonging to this pool will be polled for active requests periodically based on the Poll Interval. You can click on the Edit icon to edit the JVM pool or click on New Pool to add a new JVM Pool.
Updating a JVM Pool
To update a JVM Pool, click the Edit icon in the Show JVM Pools page. In the Edit JVM Pool page, you can specify the Poll Interval, enable monitoring for this pool, and send email alerts to a specified list.
Update Pool Thresholds
Threshold violations can have a Level of R (Red) or Y (Yellow). The Metric is the attribute being monitored and the Threshold is the value against which that metric is being compared. A violation occurs when the threshold is exceeded after a minimum number of samples have been monitored. Threshold units are % CPU Utilization for Machine CPU (CPU), JVM CPU (CPU), % Heap Utilization for Heap, number of threads in that state for others. 3 to 5 threads active in DB for more than 50% of the samples will cause an amber (Y) alert for DB, while 6+ threads active in DB wait state for more than 50% of the samples will cause a red alert for DB.
Action URL is the URL to be invoked when a threshold violation occurs. This includes internal and external URLs. The Action URL can be any valid URL on a remote system. It can be used to trace a particular thread, all active threads, or dump a heap in response to a threshold violation.
The Action URL should be a valid URL as called from a browser. If not specified, default parameters for the traceThread and heapdump will be added to the URL. If the Action URL specifies a host that is different from the current console host, you must navigate to the Console Setup page and uncheck the Require Login for Java Tab checkbox.
A sample URL template for Tracing Threads is given below:
http://localhost/jvmTraceActive.jsp?traceThread=allactive&JVM_THREAD_ID=&JVM_ID=1&JVM_MACHINE=machine_name&JVM_PORT=8080&pollInterval=50&pollDuration=10&samplesfilename=traceactive&detailsfile=on
where:
-
traceThreadis the name of the thread to be traced. If you want to trace all the active threads, specify the value as traceThread=allactive. This is the value in the Thread column in the View All Threads page. -
JVM_THREAD_IDis the ID of the thread to be traced. If you want to trace all active threads or iftraceThread=allactive, theJVM_THREAD_IDparameter must be blank. This is the value specified in theOS PIDcolumn in the View All Threads page. -
JVM_ID,JVM_MACHINE,JVM_PORTare the ID, machine name, and port number of the JVM Agent on which the thread or threads to be trace are running. For example, if the text displayed at the top of the View All Threads page is -Name: machine_name:8080 ID: 1: Linux-2.6.9-55.0.0.0.2.EL: Sun Microsystems Inc.: 1.6.0_07-
machine_nameis theJVM_MACHINE -
8080is theJVM_PORT -
1is theJVM_ID(If theJVM_IDparameter is not supplied in the URL, it is automatically appended by the Console)
-
-
PollIntervalis the time interval (in milliseconds) between successive samples. The default value is 50. -
PollDurationis the duration (in seconds) for the trace. The default value is 10. -
Samplesfilenameis the prefix of the trace sample file name created on the console machine. The default value istraceactiveand an unique identifier is added as a suffix to each trace file that is created. -
Detailsfileis the sample thread stack in addition to the state. You must set this toOnif you require complete thread details. The default is On.
A sample URL for heapdump is given below:
http://localhost/jvmHeapDump.jsp?JVM_ID=1&JVM_MACHINE=machine_name&JVM_PORT=8080&JVM_DUMP_FILE=heapdump <http://localhost/jvmHeapDump.jsp?JVM_ID=1&JVM_MACHINE=machine_name&JVM_PORT=8080&JVM_DUMP_FILE=heapdump>
The following parameters are required in the URL for heapdump.
-
JVM_ID,JVM_MACHINE, andJVM_PORTare the same parameters as specified for the Tracing Threads template. -
JVM_DUMP_FILEis the prefix of the heap dump file name on the agent. An unique identifier is added as a suffix to each heap dump file.
Databases Page
Use this screen to view information about the databases being monitored/profiled currently or to add additional databases for the same. Click the Edit icon to edit an existing database or click Register NewDB to register a new database.
JVMs and Managers Page
This page lists all the JVMs that have connected to the console. All the registered JVM Diagnostics Managers along with IP address, port number, build version, and status are listed on this page. You can edit the JVM parameters using the Edit icon, or delete old JVMs that no longer connect to the console.
In the Edit JVM Information page, you can assign a JVM to a different pool, change it's log level (if recommended by Support) or change the temporary directory where the heap snapshots are dumped.
Monitoring
Once you have updated a JVM pool with polling enabled, you can monitor the JVMs in that pool. Click on the Start Monitoring link above to start monitoring. This can also be done from the Console Setup Screen. You can enable or disable monitoring of pools or change their polling intervals by updating the pool properties.
You can mark a thread as idle by adding it to an Idle Thread Rule. All threads that have been marked as idle will not be monitored. Click New Rule to create a new Idle Thread Rule. The Rule Type can be:
-
Monitor (Waiting on Lock): Select this type if you want to ignore all threads that are locked.
-
Current Call: Select this type if you want to ignore all threads that are making a call to the selected function.
The Rule Value should contain the class name, method, followed by class+method. An example of a Current Call is weblogic.socket.PosixSocketMuxer->processSockets. An example of a Monitor (Waiting on Lock) is weblogic.socket.PosixSocketMuxer$1.
All threads that meet the criteria specified in the Idle Thread Rule will not appear in the View Active Threads screen.
Trace Files Page
Use this page to:
-
Delete trace files from the traces you have run.
-
Load a trace file from another console. You'll need to move the trace file(s) to the
jamserv/tracedirectory for them to visible in this screen.
Download Agent Page
On this page, you can manually download the various binaries such as Java Agent, JVM Diagnostics Manager, Database Agent, Load Heap, and deploy them.
Note:
If you are using WebLogic Server 10.x and above, we recommend you use the automated deployment procedure as described in Automated Deployment Procedure.Downloading the Java Agent
On the Download Agent page, click the Download icon next to the Java Agent (AD4J Agent/Jamagent) WAR file component. In the JAM Agent web.xml Parameters page, select an Available Manager from the list, modify the Tuning, Target Association, and Logging parameters and click Download. The jamagent.war will be downloaded onto the specified system.
Analyzing the JVM Heaps
This section describes the pages under the Saved Heap Snapshots menu option. To access these pages, click Saved Heap Snapshots option from the JVM Diagnostics menu.
All Heaps Page
This page displays a list of all the heaps that have been loaded into the repository. You can see heap details like JVM Name, vendor, heap size, heap used. Click on the link in the % column to drill down to a specific heap and view the memory usage of the heap. Click the Edit icon to edit the Heap Snapshot information.
Heap Usage Page
This page provides a summary of heap usage by different types of objects in the heap. The type of object (Klass, Array, Instance), the total number and size of objects in each heap.
Heap Usage by Roots
This page shows the number of objects and amount of heap memory reachable by each class of root. The name of the root, the total number of objects reachable from the root and the adjusted memory (used to identify memory leak hot-spots) reachable from the root are displayed.
-
Click the link in the Root column to view the top reachable objects in the heap.
-
The View Summary option is available if you reach this page after selecting the heaps to be compared. Click this option to do a bottom up analysis of the heap.
Top 40 Objects Page
This page shows the top 40 objects reachable from a root. The objects are sorted in descending order by the ascending memory reachable from the object (or the difference of the adjusted memory reachable when comparing two heaps). The internal root identifier of the object, type of object, signature, number of children reachable from the object, and total and adjusted memory from the object are displayed. Click on the Signature link to drill down to the Heap Object Information page.If you reach this page while comparing two heaps, you will see the type of object, number of objects of each type, number of children reachable from the object, adjusted memory reachable from this object, and the delta. The Delta Adj column shows the difference in the total memory reachable from these objects. Click the Delta Adj link to compare the objects in the two heaps. If there are multiple objects of a given time/signature present in a given heap, this action will display a selection page to choose an object from each heap to compare.
Note:
If the second heap does not have the corresponding objects of the same type and signature as the first heap, these columns in the second heap will be blank.Heap Object Information Page
This page shows information about the objects in the heap. You can see the following:
-
Heap Object Information: This table shows information about a specific object in the heap snapshot.
-
Object Information: This table shows information about all object's children (like fields and array entries). Click on the signature to examine the child.
-
Object Children: This table shows information about all object's parent (from where this object is reachable). Click on the signature to examine the parent.
-
Roots: This table shows any roots from which this object is directly reachable.
Using the Database Pages
This section describes the pages under the JDBC Correlation menu option. After you have deployed and registered the database agent as described in Deploying the Database Agent, you can view the activity on the registered databases using this option.
To access these pages, click JDBC Correlation option under the JVM Diagnostics menu. The following pages are available:
-
DB Activity: This page shows a summary of databases monitored by the console. Click on the View Details link to view the database session details.
-
DB Waits: This page shows the session details of the selected database. Click on the Event or Idle Event link to drill down to the DB Waits page.
-
Current IO: This page shows the current IO activity on the selected database.
-
Current CPU: This page shows the current CPU activity on the selected database.
-
Current Locks: This page provides a summary about the sessions holding and waiting for locks.
-
Execution Plan: This page shows the SQL Statement Execution plan. Click Get Plan to view the execution plan and the table statistics.
-
Find Sessions: This screen provides attributes and details for the database session waiting for the lock. Click the Thread Information link to get the Java details for the screen.
Tracing JVM Threads
To trace JVM threads, you can:
-
Click JVM Diagnostics > Threads > Trace Now.
-
Click Threads > Real Time Analysis. On the Real Time Analysis page, click Trace Active Threads to navigate to the Trace Active Threads page.
Traces Active Threads Page
You can trace all active threads on this page. During tracing, the state and stack of the target thread is sampled at set time intervals for the desired duration. To access this page, click Trace Active Threads in the JVM Real Time Thread Analysis page. See Viewing the JVM Real Time Thread Analysis Page for details.
You can specify the following parameters before you start the trace:
-
Poll Interval: The time interval between successive samples.
-
Duration: The duration of the trace.
-
Trace Thread Details: Sample thread stack in addition to the state will be traced.
-
Try Changing Thread: If a thread stack changes during a sample (this can happen when a thread is using CPU), JVM Diagnostics will skip that thread for that sample. If you find missing samples, use this feature to retrace the changed stacks.
-
Include Network Waits: Indicates if idle network waits should be included in the trace.
-
Trace All Threads: Select this checkbox to include both idle and active threads in the trace.
-
Allow Trace Interrupt: Allows you to interrupt the trace process.
After the tracing has been successfully completed, click Goto Saved Trace to view the trace results.
Trace Summary Page
This page shows the state, method, and stack information for a trace. To access this page, click Goto Saved Trace on the Trace Active Threads page.
-
JVM Trace Results: This section provides information about when and where the trace was run. It also shows any filters that have been applied to the results of tracing.
-
Resource Usage: This section shows the system activities such as CPU utilization, heap usage, and garbage collection during tracing.
-
Top States: This shows the JVM State Analysis chart for the duration of the trace. The Y axis shows how many threads were in that state at that time.
-
Top Methods: This shows the relative time spent on different methods during the trace.
-
Threads by State: This table Threads breaks down the relative time spent in different states for each method. The Thread link displays filters just for a specific thread.
-
Requests by State: This table shows the number of samples in each state for each request.
-
Methods by State: This table breaks down the relative time spent in different state for each method. The Method link shows the call stacks, which include the method.
Available Threads Page
This table lists all the traces that have been loaded into the repository using the Trace Active Threads option. The Thread column indicates if all active threads or a specific thread has been traced. The number of samples taken during the trace are displayed. Click the Samples link to drill down to the Trace Summary page. Click the Edit icon to modify the trace information for a set of samples.
Thread Summary Page
This page shows the state, method, and stack information for a specific thread in a trace. To access this page, click a Thread link in the Threads by State column in the Trace Summary page.
-
JVM Trace Results: This section provides information about when and where the trace was run. It also shows any filters that have been applied to the results of tracing.
-
Resource Usage: This section shows the system activities such as CPU utilization, heap usage, and garbage collection during tracing.
-
Top States: This shows the JVM State Analysis chart for the duration of the trace. The Y axis shows how many threads were in that state at that time.
-
Top Methods: This shows the relative time spent on different methods during the trace.
-
Threads by State: This table breaks down the relative time spent in different states for each method. The Thread link displays filters just for a specific thread.
-
Requests by State: This table shows the number of samples in each state for each request.
-
Methods by State: This table breaks down the relative time spent in different state for each method. The Method link shows the call stacks, which include the method.
