| Oracle® Retail Operational Insights User Guide Release 16.0 E80752-01 |
|

 Previous |
 Next |
Predefined reports are packaged with Operational Insights and are available for ReSA, Allocation, ReIM, and RMS as dashboard and In-context BI reports.
ReSA Operational Insights reports can be divided into the Dashboard Reports and In-context BI Reports. These reports are embedded within the ReSA ADF application.
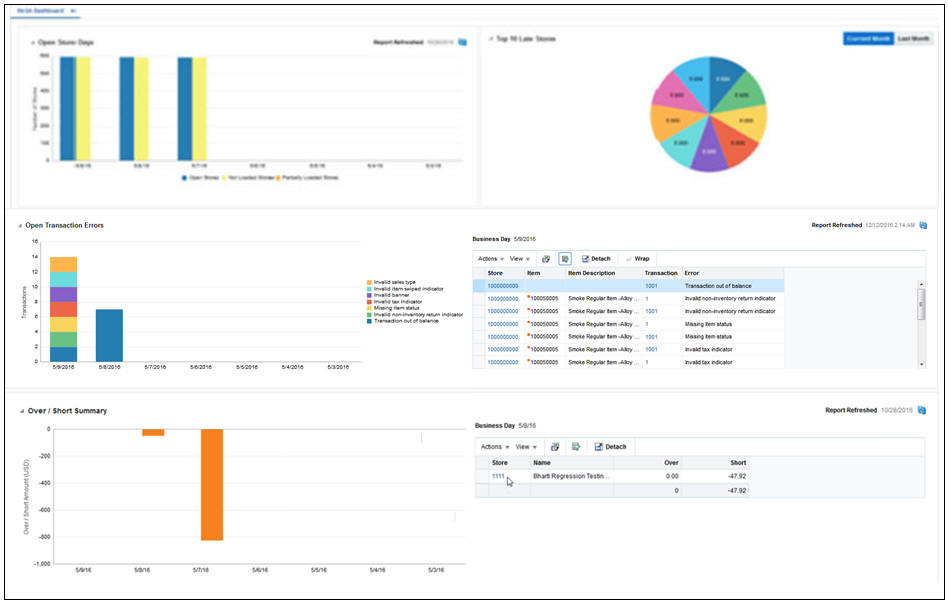
The dashboard surfaces information in a manner that will help users - sales auditors - prioritize their day-to-day activities as well as quickly identify areas of concern. The dashboard allows a user to look at a consolidated view of their 'to-dos' and then directly and contextually launch into the corresponding ReSA windows to take an action. The Dashboard Reports show data across assigned stores that is the stores assigned to the logged in user.
Through the dashboard, a Sales Auditor can at a glance identify store days that are still open due to errors or late polling by stores and can resolve or escalate the issues.
A view of all open transactional errors across his stores for the last seven days is available that helps him see error patterns and helps estimate his workload in fixing them. The auditor can then start fixing the errors by launching the respective ReSA windows directly from the links provided in the dashboard reports.
The over short summary report helps the sales auditor in the important function of tracking the overages or shortages at his stores and identifying fraudulent behavior.
The dashboard reports can be viewed by navigating to Reports menu > ReSA Dashboard in ReSA.
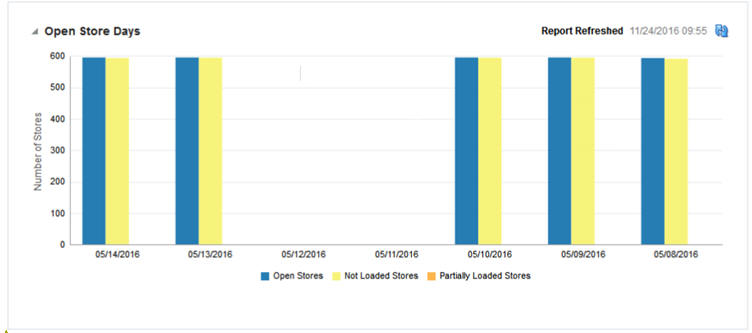
The Open Store Days report indicates a sales auditor's open store days and whether they have not been audited, not been loaded or only partially loaded for the last seven days. There are three different actions that can be taken from this report:
Click 'Open Stores' bar in the report and the report contextually launches into the ReSA Store Day Search window. Therefore, the ReSA window is auto-populated for all store-days with a status of 'Sales Audit In-Progress'.
You will also be able to click 'Not Loaded Stores' bar in the report and the report contextually launches into the ReSA Store Day Search window. Therefore, the ReSA window is auto-populated for all store-days with a status of 'Ready for Import.'
Click 'Partially Loaded Stores' bar in the report and the report contextually launches into the ReSA Store Day Search window. Therefore, the ReSA window is auto-populated for all store-days with a status of Partially Loaded.
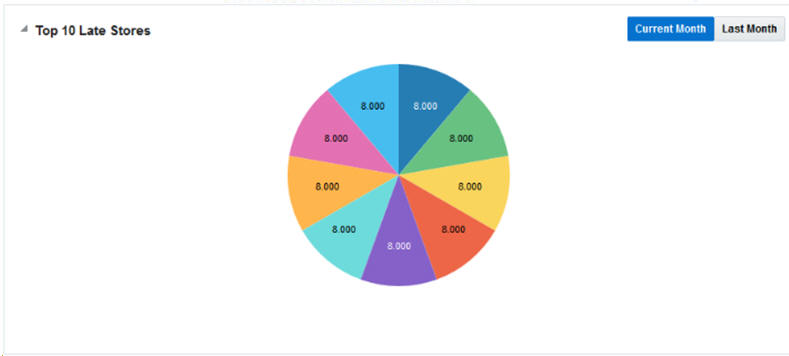
The Top 10 Late Stores report gives the auditor a view of the 10 stores that have the highest number of late polling days in the current or last month. This report shows the count of store days in status Ready to Import or Partially Loaded per store for the Current Month or Last Month based on view selected. Based on this analysis the Auditor can contact these stores or escalate them as high issue stores to management.
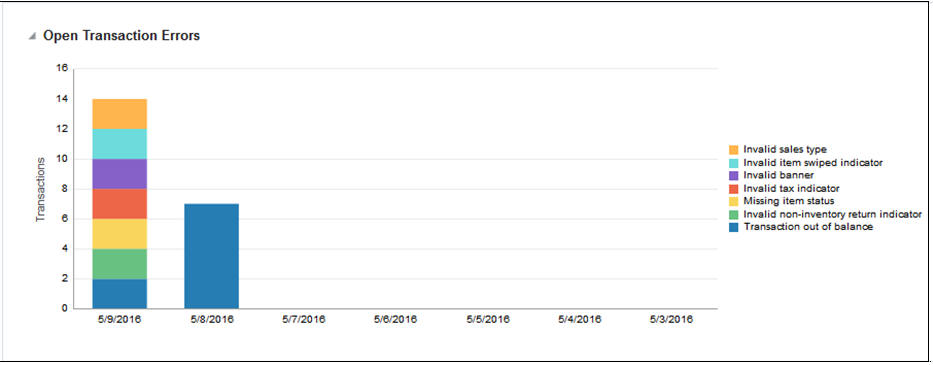
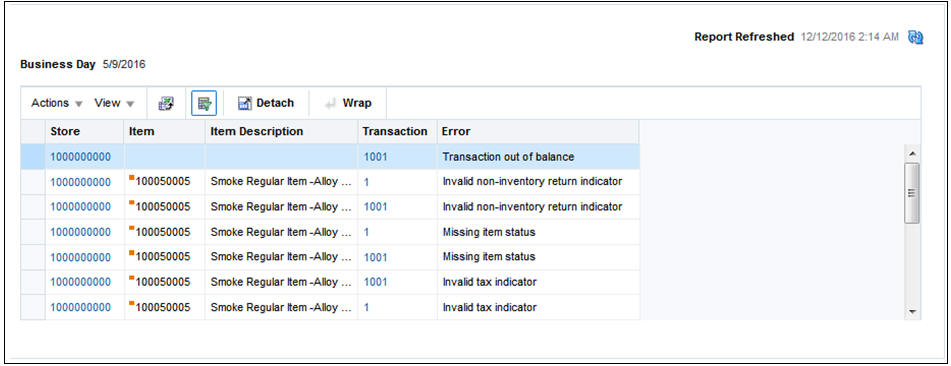
The Open Transaction Errors report displays the number of open transactional errors across all stores color coded by error code over the last seven days.
You can hover over a section of the stacked bar to see the count of errors for a given error code on a given business date.
Click the stacked bar for a specific business day to refresh the tabular detail report on the right. The tabular report shows the store, item and transaction number details of all errors existing for the given business date.
Click the data in the Store column in the Open Transaction Error detail table and is contextually launched into the ReSA Transaction Search window. The ReSA window is auto populated with all transactions for the given store and business date where transaction level errors exist.
Click the data in the ReSA Transaction column in the open transaction error detail table and is contextually launched into the ReSA Transaction Maintenance window for the given transaction. The window is launched either in the View mode or Edit mode based on the ReSA privileges that role has.
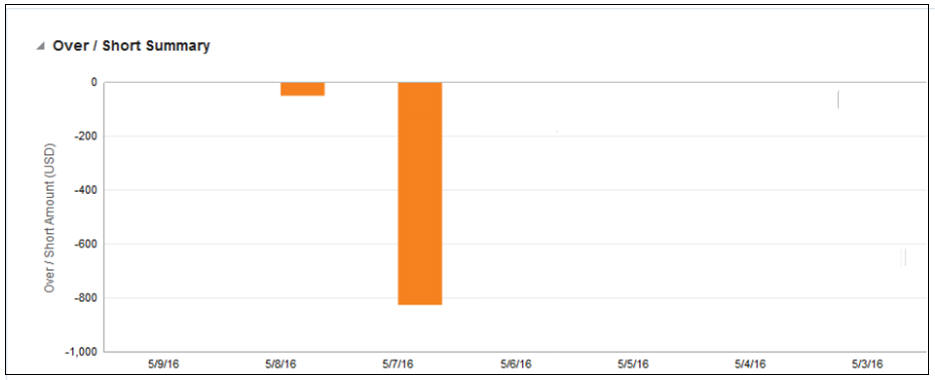
The Over/Short Summary report displays the sum of overage amounts for all stores that have an over amount and the sum of shortage amounts for all stores that have a short amount per business day for the last seven days.
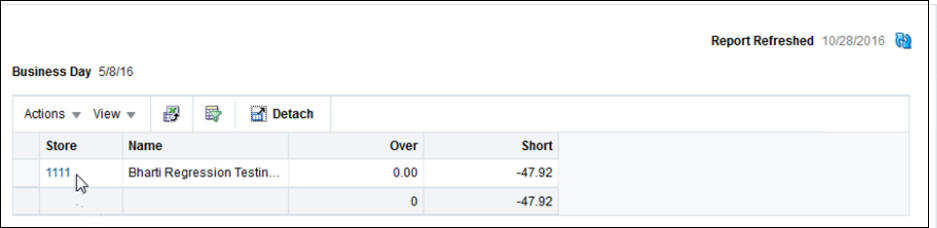
Click the over or short bar for a given business day which refreshes the tabular detail report on the right. The tabular report shows the store and the corresponding over amount or short amount for the store and given business day.
If the over amount or short amount at a store exceeds the configured threshold amount, a warning symbol is displayed against the given row.
|
Note: The threshold for over amount and short amount can be configured through setting of system options. |
If the stores have varied local currencies, the amounts are displayed in primary currency only. If all stores have the same common local currency, the amounts are displayed in local currency.
Click the data in the Store column in the Over/Short Detail report and is contextually launched into the ReSA Store Day Audit window with the Over/Short Totals tab highlighted for the selected store and business day. The window is launched either in the 'View' mode or 'Edit' Mode based on the ReSA privileges of the user.
In-context BI Reports are displayed in In-context pane of some ReSA windows. In-context BI reports provide additional In-context insights to the data being viewed in the ReSA window.
The following ReSA windows have In-context BI reports displayed in the right pane:
Store Day Search window
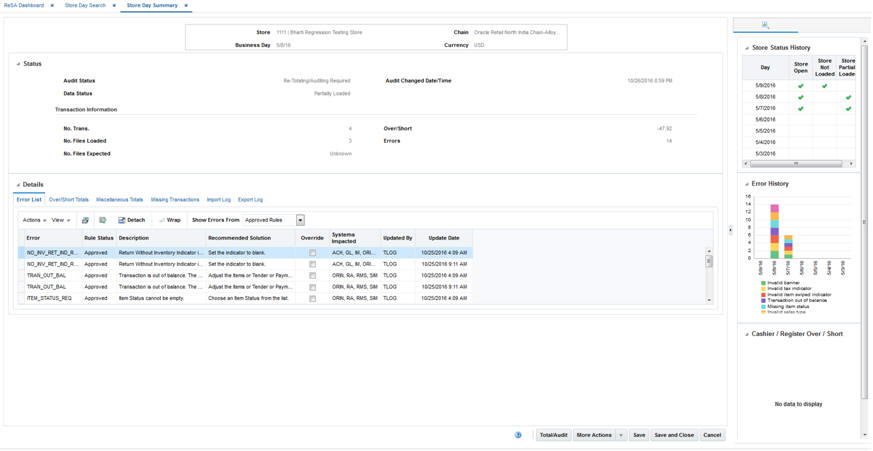
Store Day Summary window
Transaction Maintenance window
Tender Summary window
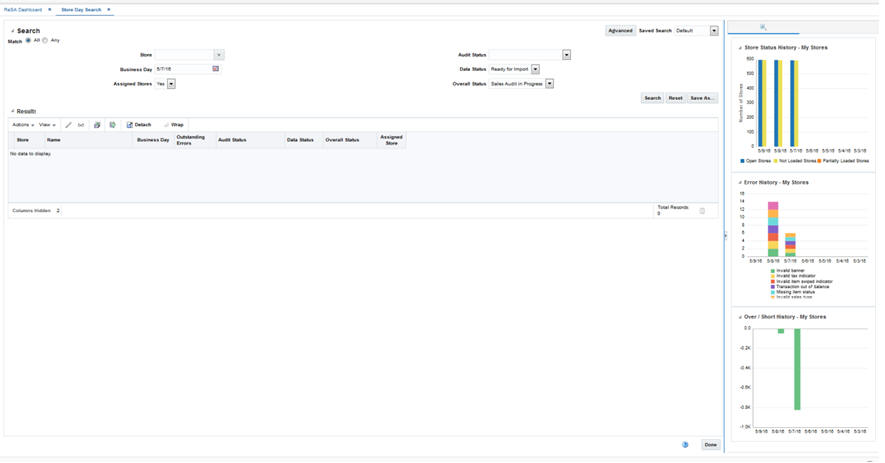
The following are In-context BI reports displayed on the Store Day Search window of ReSA:
Store Status History Report
Error History Report
Over/Short History Report
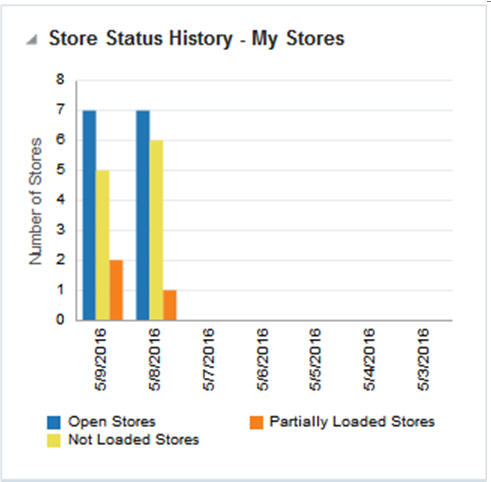
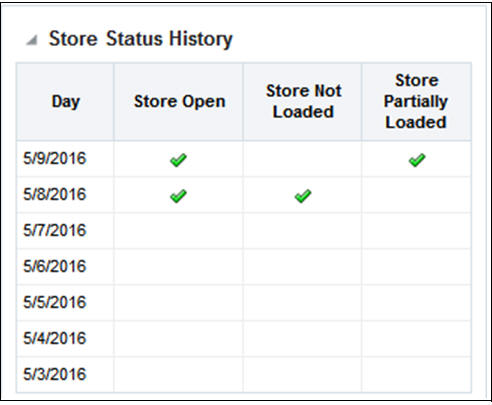
The Store Status History report on Store Day Search window indicates a sales auditor's open store days and represent them by color codes whether they have not been audited, not been loaded or only partially loaded for the last seven days. You can also hover over the bar charts to view the count.
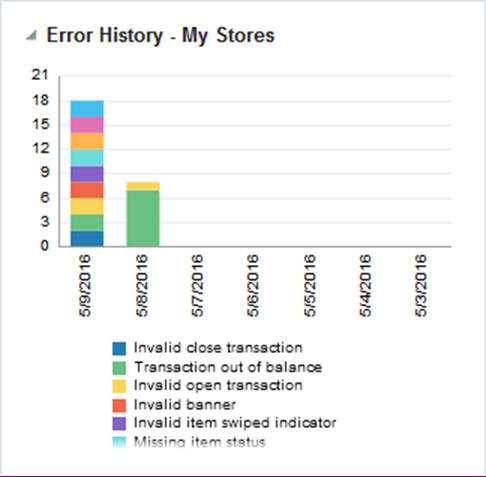
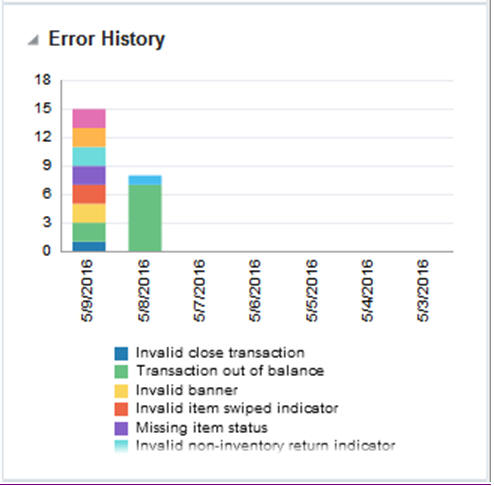
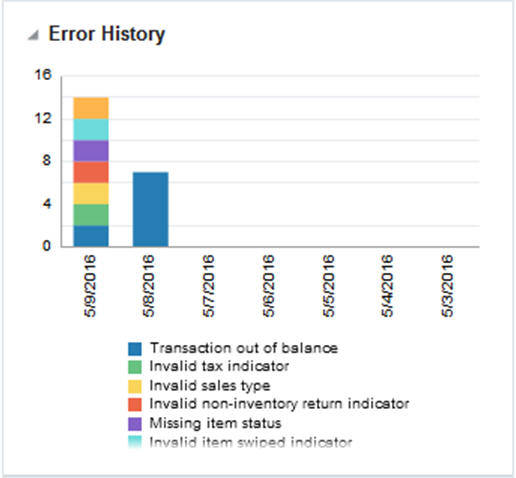
The Error History report on Store Day Search window of ReSA indicates the total number of errors for all auditor stores per business day for the last seven days. The error count includes current open errors and errors that were resolved. This would give the auditor insight into the occurrence of similar kinds of errors in the past that were resolved or that are still open. The errors are color coded by error code.
You can hover over the respective section of the chart to view the error count for the given error code.
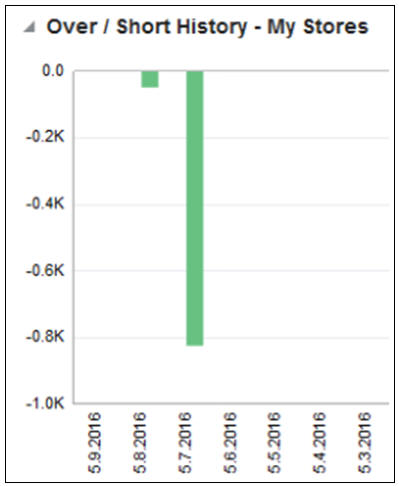
The Over/Short Summary report displays the sum of overage amounts for all stores that have an over amount and the sum of shortage amounts for all stores that have a short amount per business day for the last seven days.
If the stores have varied local currencies, the amounts are displayed in primary currency only. If all stores have the same common local currency, the amounts are displayed in local currency.
The following are In-context BI reports displayed on the Store Day Summary window of ReSA:
Store Status History Report
Error History Report
Cashier/Register Over Short Report
The Store Status History report on Store Day Summary window indicates the presence of not audited store days, not loaded store days, and partially loaded store days across the last seven days for the store that is being viewed in Store Day Summary window. An indicator signifies if the given store is not audited, is not loaded or is partially loaded for the last seven business days.
The Error History report on Store Day Summary window indicates the pattern of the errors existing for the store day being viewed in the Store Day Summary window of ReSA.
The report indicates the number of occurrences of errors similar to the errors open for the selected store day over the last seven days.
The error count includes both open errors and errors that were resolved for the store days. This would give the auditor insight into the occurrence of similar kinds of errors in the past that were resolved or that are still open. The errors are grouped and color coded by error code.
You can hover over a section of the chart to view the error count for the given error code and business day.
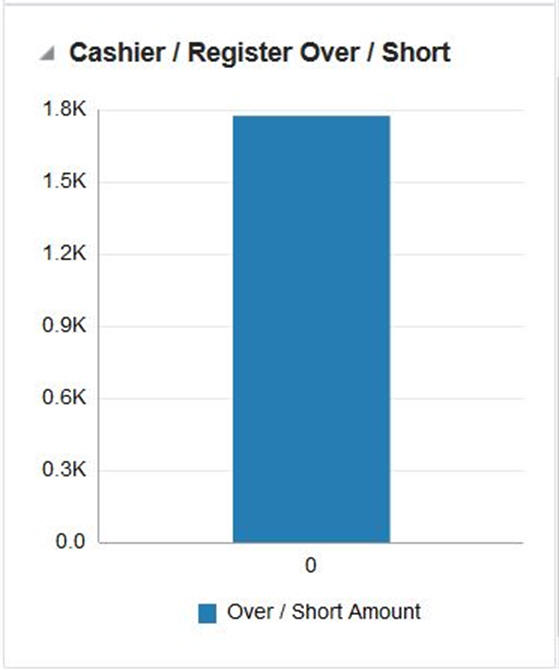
The Cashier/Register Over Short report on Store Day Summary window displays the overage or shortage amounts by cashier for the given store - business day being viewed in the Store Day Summary window of ReSA if the ReSA system option - Balance Level Indicator is set to Cashier.
The report displays the overage or shortage amounts by register for the given store - business day being viewed in the Store Day Summary window of ReSA if the ReSA system option - Balance Level Indicator is set to Register.
The amounts in the report are displayed in the RMS primary currency or the store's local currency based on the currency toggle in the store day summary window.
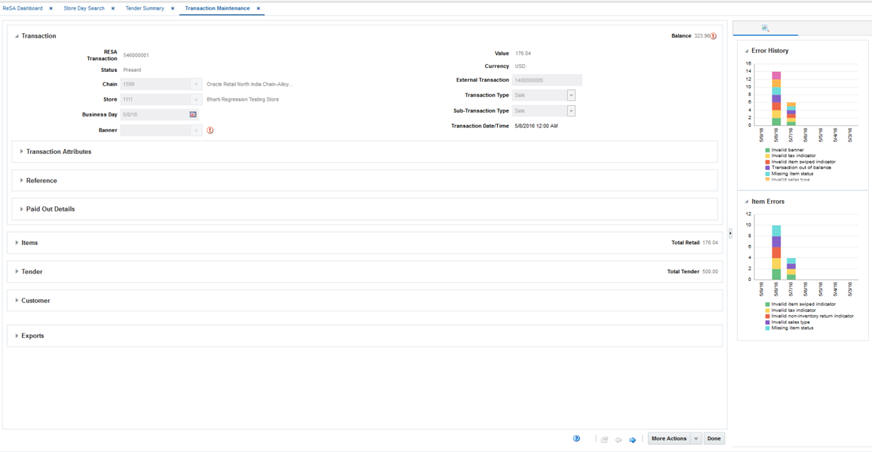
The following are In-context BI reports displayed on the Transaction Maintenance window of ReSA:
Error History Report
Item Errors Report
The Error History report on Transaction Maintenance window indicates the pattern of the errors existing for the transaction being viewed over the last seven business days. The report indicates the number of occurrences of errors similar to the errors open for the selected transaction for the given store over the last seven days.
The error count includes both open transactional errors and transactional errors that were resolved. This would give the auditor insight into the occurrence of similar kinds of errors in the past that were resolved or that are still open. The errors are grouped and color coded by error code.
You can hover over a section of the chart to view the error count for the given error code and business day.
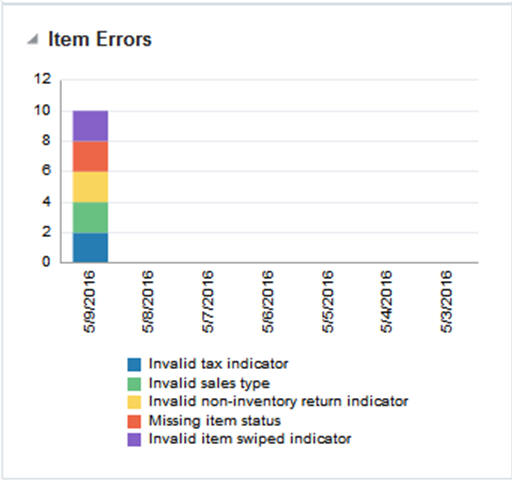
This Item Errors report on Transaction Maintenance window indicates the pattern of the errors existing for the item selected on the ReSA window for the given store over the last seven business days. The report indicates the number of occurrences of errors similar to the errors open for the selected item for the given store over the last seven days.
The error count includes both open errors and errors that were resolved. The errors are grouped and color coded by error code.
You can hover over a section of the chart to view the error count for the given error code and business day for the selected item.
|
Note: Only item level errors (that is, errors with rec_type = TITEM, IDISC, IGTAX) are considered in this report. |
The report appears only when an item is selected in the Items panel of the Transaction Maintenance window.
The following are In-context BI reports displayed on the Tender Summary window of ReSA:
Tender Summary Report
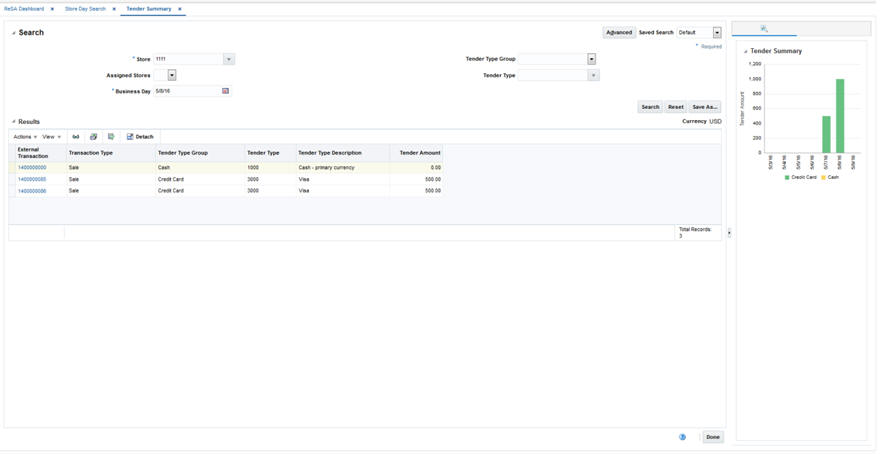
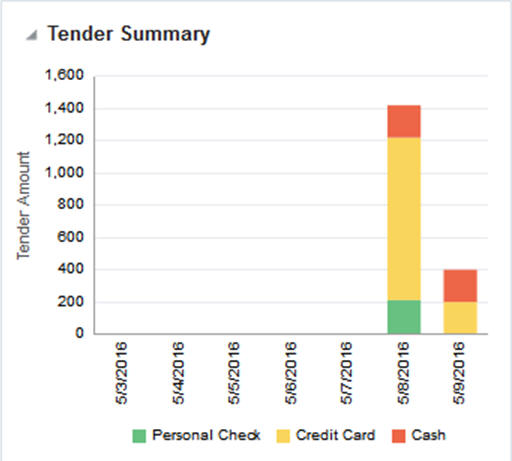
The Tender Summary report on Tender Summary window displays the net tender amount by tender types -Cash, Credit Card and Check per business day over the last seven days for the store selected in Tender Summary window.
The amounts in the report are displayed in the RMS primary currency or the store's local currency based on the currency toggle in the Tender Summary window.
|
Note: The report appears only after the search has been executed. |
Allocation Operational Insights reports can be divided into the Dashboard Reports and In-context BI Reports. These reports are embedded within the Allocation ADF application.
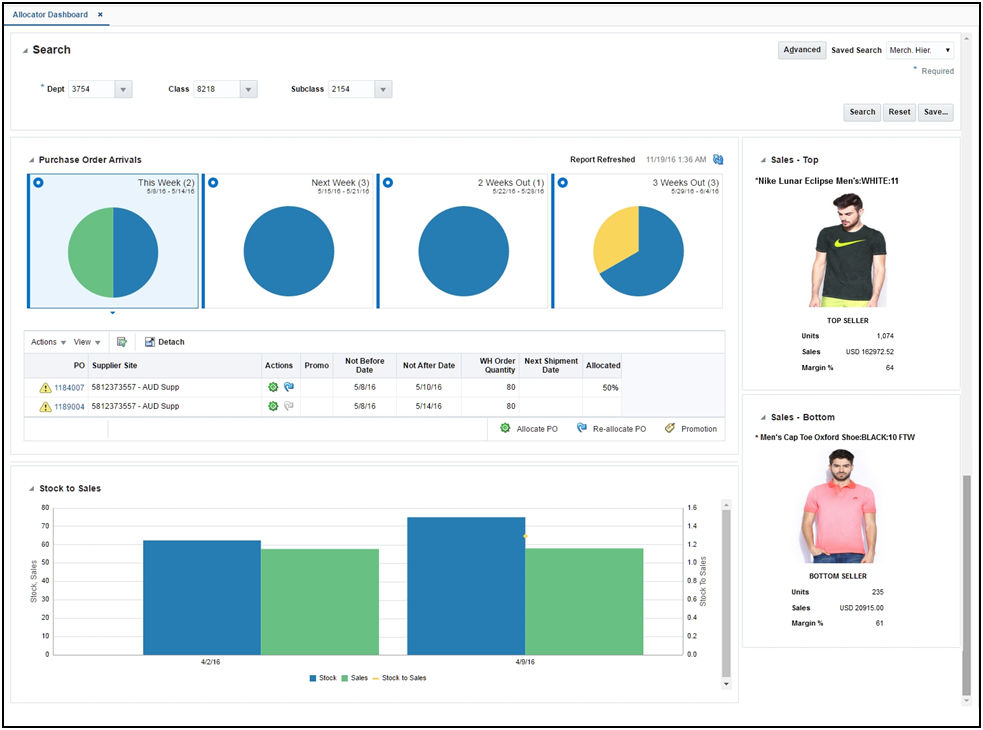
The dashboard surfaces information in a manner that will give allocators visibility to the highest priority tasks, such as incoming POs that need allocating or re-allocating and visibility to potential stock shortages in stores based on sales forecasts. The dashboard also provides a quick way for the allocator to take action on these alerts by launching them contextually into the appropriate Allocation windows.
The dashboard reports can be viewed by navigating to Tasks menu > Reports > Allocator Dashboard in Allocation. The dashboard is the default landing page for Allocation.
Users can filter data across the dashboard reports by selecting appropriate values in the prompts provided. You must select the department, class, and subclass which prompts to filter the data displayed in the reports.
Allocator Dashboard Reports:
Purchase Order Arrivals Report
Stock to Sales Report
Sales – Top Report
Sales – Bottom Report
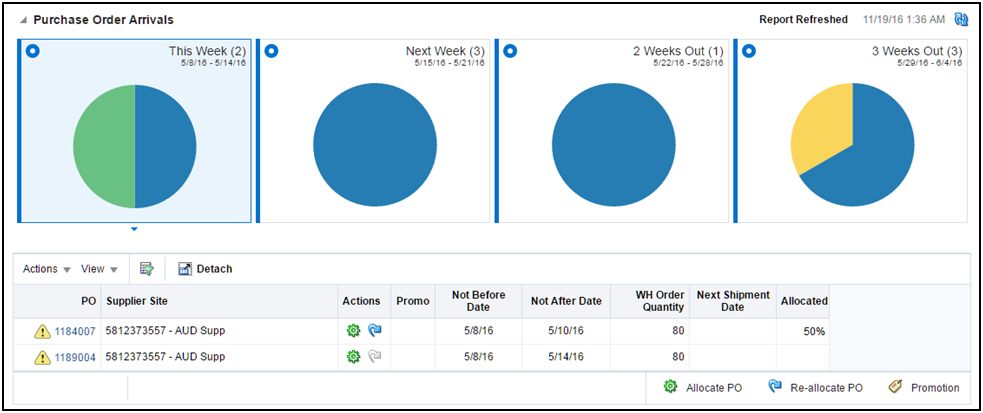
The report consists of two parts:
Tile view that displays the number of POs that are incoming segregated by their not after date in This Week, Next Week, 2 Weeks Out and 3 Weeks Out, respectively. The report also indicates the number split of these incoming PO's that are unallocated, fully allocated and partially allocated. You can view the pie chart to deduce the ratio of the incoming POs that are fully allocated, partially allocated and unallocated. You can select a tile to view the details of the POs in a table below that are expected to be received in the given time bucket. By default, the ’This Week' tile is selected. A refresh feature is also available to update the tiles to reflect the latest data conditions for the selected merchandise hierarchy.
Tabular report that lists the POs and the corresponding ordered quantities that are expected to be received in the time line corresponding to selected tile. Below PO details can be viewed:
Supplier Site against which the PO is raised
'Not Before Date' and 'Not After Date' of the PO i.e the time window within which the PO is expected to be received
'Next Shipment Date' i.e the date when the next shipment is expected to be received for the given PO
Ordered Qty i.e the remaining ordered quantity that is expected to be received in the chosen time period
Allocated %, which is the percentage of the ordered qty that has already been allocated for a given PO
An alert is displayed against the POs that have not yet been allocated above the defined Percentage Allocated PO Threshold beyond the PO Allocation Time threshold. For example, if the Percentage Allocated PO Threshold is set to 80% and the PO Allocation Time Threshold is set to 5 days, and if the order quantity expected to be received is 100, then an alert is displayed for a PO that has a Not After Date that is less than 5 days from today and if the already allocated quantity against the PO is less than 80.
The report also indicates if any of the items on the given PO is on a promotion during the given time period as additional guidance in prioritizing the allocation process.
Using the below action links, the allocator can launch the Allocation Maintenance window to create or edit allocations.
Allocate PO – You can click on the allocate PO icon to initiate a workflow to create an allocation for all items on the Purchase Order for the quantities expected to be received on the PO. The allocate PO is displayed only if the quantity against the PO that is yet to be received has not yet been completely allocated.
Reallocate - You can click on the Reallocate icon to initiate a workflow to edit an existing allocation associated to the given PO. This is displayed only if an allocation already exists for the given PO. In case multiple allocations exist against the same PO, the allocation that was created most recently is launched.
The user can click on the purchase order number hyper link and contextually launch the PO Header Maintenance window of RMS and view the purchase order details.
|
Note: If the items on a given PO have varied UOM, Multi UOM is displayed in the Ordered Qty field, as quantity aggregation cannot be performed across multiple UOM. |
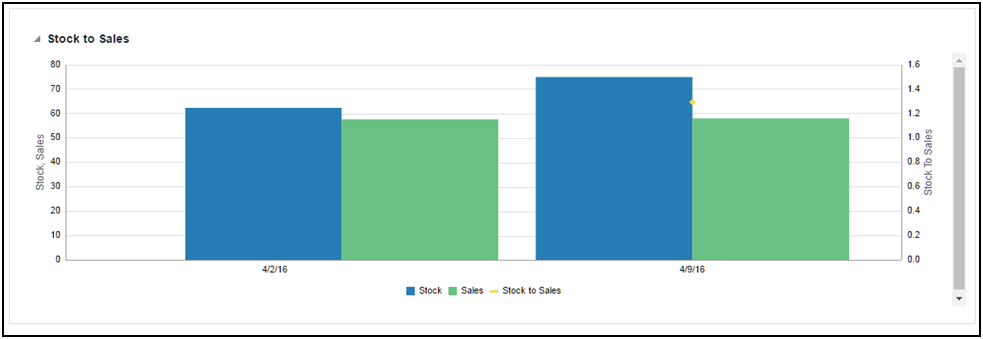
The Stock to Sales report compares the stock available for sale at the beginning of the given week and the corresponding sales achieved by the end of the same week. Data for six weeks prior to the current week can be viewed in this report. The stock and sales is aggregated across all items belonging to the Department/Class/Subclass selected in the prompts and group of stores that source from the selected VWH.
The report also plots the trend of Stock to Sales ratio for six previous weeks to provide historical context to the allocator of the inventory levels in their stores and help gauge where overage or shortage situations occurred.
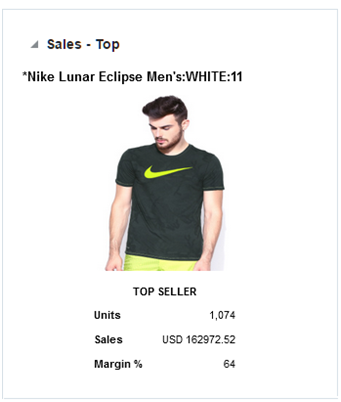
The Sales - Top report displays the top selling item across the Department/Class/Subclass selected in the prompts for a day prior to the current business day.
Additional data on the given item such as the item image, total sales units, retail value of sales and the margin can be viewed.
|
Note: For fashion items, the top seller will represent an item parent - diff aggregate. |
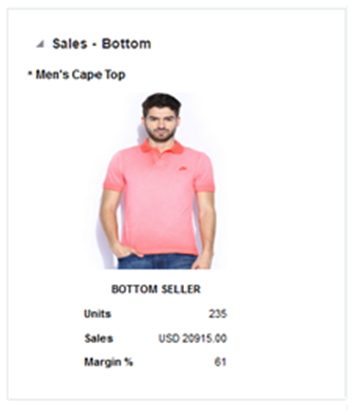
The Sales - Bottom report displays the least selling item across the Department/Class/Subclass selected in the prompts for a day prior to the current business day.
Additional data on the given item such as the item image, total sales units, retail value of sales and the margin can be viewed.
|
Note: For fashion items, the bottom seller will represent an item parent - diff aggregate. |
In-context BI Reports are displayed in In-context pane of some Allocation windows. These reports provide additional insights to the data being viewed in the Allocation window.
The following Allocation windows have In-context BI reports displayed in the right pane:
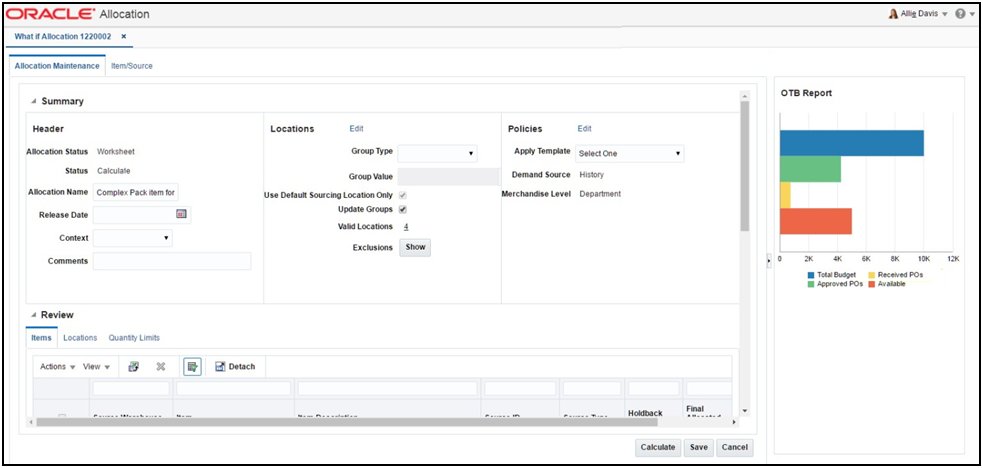
Allocation Maintenance Window
What If Allocation Window
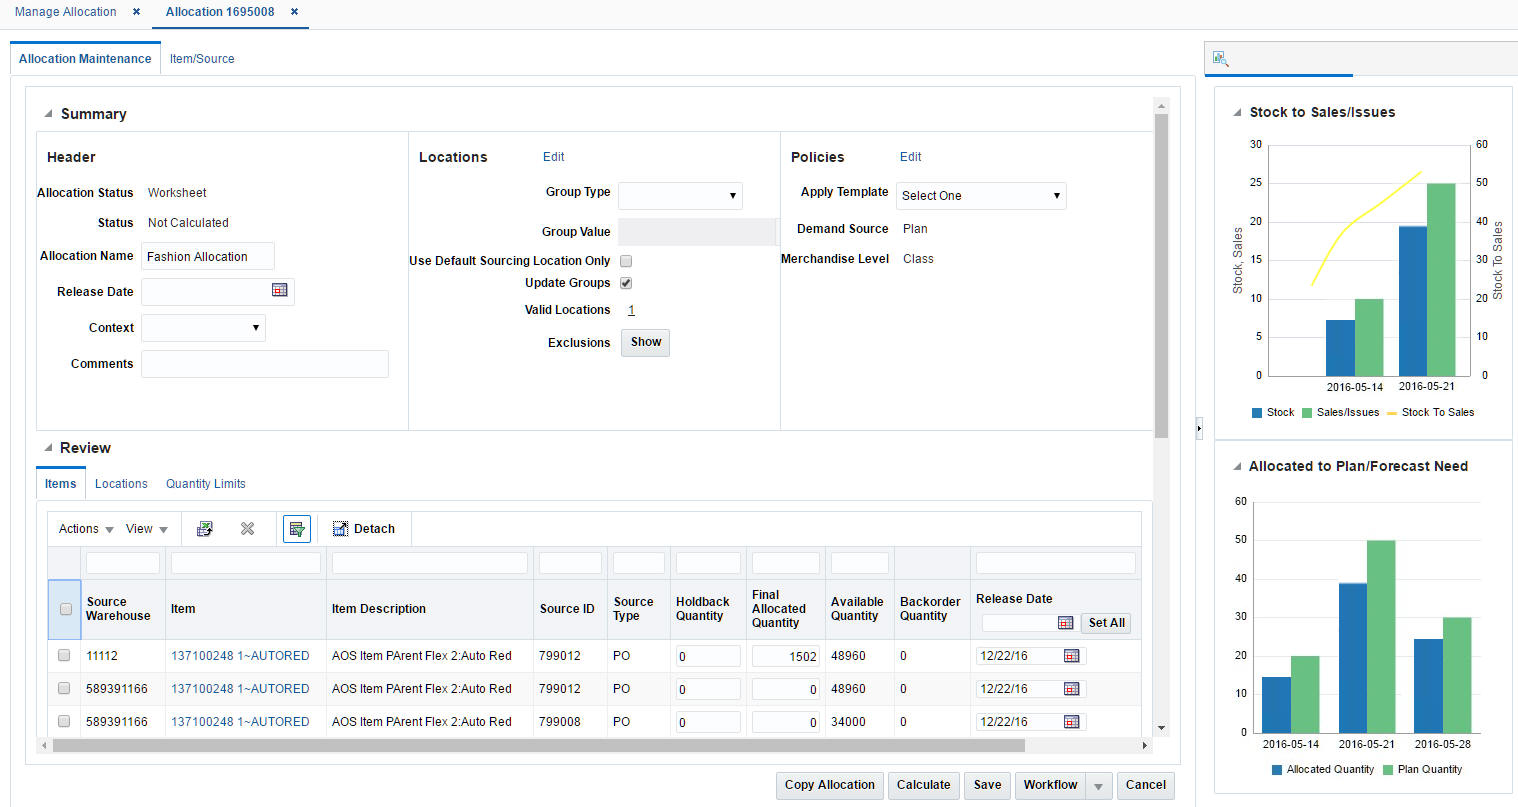
The following are In-context BI reports displayed on the Allocation Maintenance window:
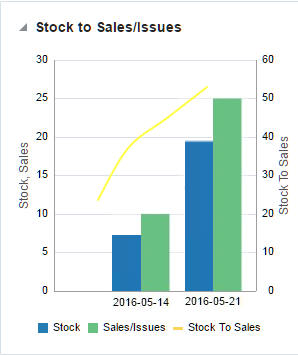
Stock to Sales/Issues Report
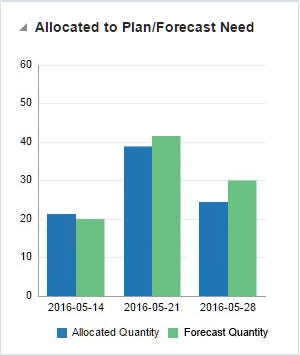
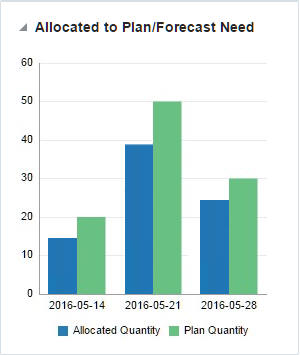
Allocated to Plan/Forecast Report
The Stock to Sales/Issues report displays the stock available for sale at the beginning of the given week and the corresponding sales at the given store or issues at the given warehouse achieved by the end of the same week. Data for four weeks prior to the current week can be viewed in this report. The report also plots the trend of Stock to Sales ratio across four previous weeks.
As a user moves between rows in the 'Results' table in the Allocation Maintenance window, the report will refresh to show information In-context to the item and the 'to' (or destination) location corresponding to the row highlighted.
The Allocated to Plan/Forecast report is to be used primarily for pre-season allocation decision-making, before there is stock available at the stores. It shows the relationship between the need at a location, displayed as the sales forecast or sales plan for the next 4 weeks, and the allocations that are scheduled for delivery in those weeks. The forecasted item need is used if the NEED CALCULATION TYPE = Forecast and the plan need is used if NEED CALCULATION TYPE = Plan.
As a user moves between rows in the 'Results' table in the Allocation Maintenance window, the report will refresh to show information contextual to the item and the 'to' (or destination) location corresponding to the row highlighted.
The following are In-context BI reports displayed on the What If Allocation window:
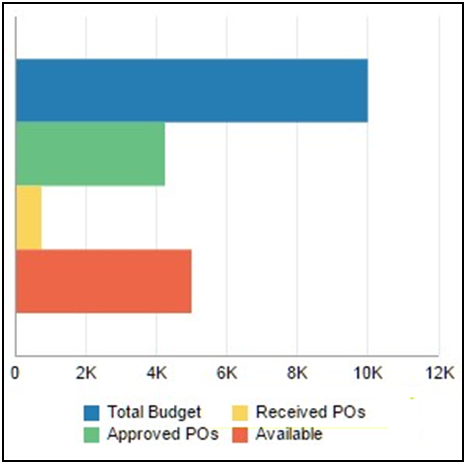
OTB Report
What-if allocations allow an allocator to look at options for creating a PO in Allocation. If the PO is created and approved in RMS, it would impact the OTB budget for the subclass or subclasses of the items present on the PO.
The OTB report provides an early visibility to the allocator on whether there is budget available to create a purchase order for the given item.
It lists the total budget, budget taken up by Approved POs, budget taken up by Received POs and the total remaining (available) budget.
As a user moves between rows in the 'Review' table in the Allocation Maintenance UI, the OTB report will refresh to show information contextual to the subclass of the item corresponding to the row highlighted.
ReIM Operational Insights reports can be divided into the Dashboard Reports and In-context BI Reports. There reports are embedded within the ReIM ADF application.
The dashboard surfaces information in a manner that will help users (Finance Manager and Accounts Payable specialist) understand invoice match workload, view supplier performance, manage employee workload and provide quick visibility into cost, quantity and tax discrepancies. The dashboard allows you to contextually launch into the Summary Match, Detail Match and Discrepancy Review list to take quick action on the insights presented.
ReIM Dashboard Reports:
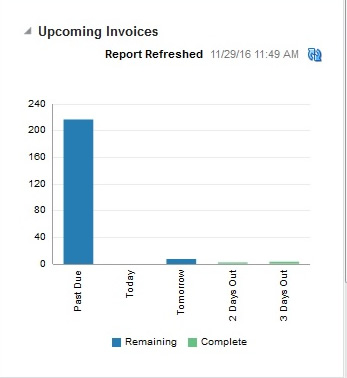
Upcoming Invoices
Automatch Rate
Supplier Site Performance
Employee Workload
Invoices
The Upcoming Invoices Report provides visibility into the upcoming workload for either the Accounts Payable Specialist or a group of employees for the Finance Manager.
The report shows the number of Completed and Remaining Invoices with the invoice due date equal to:
Today
Tomorrow
2 days out
3 days out
The report also shows the number of Remaining Invoices with the invoice due date in the past:
Past Due
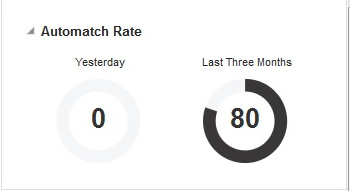
The AutoMatch Rate report will allow you to quickly see the total percent of invoices in matched status that were matched by the automatch batch in comparison with the total number of invoices that were manually matched by the ReIM user. This metric is shown by using a gauge report.
The number shown and represented by the black bar is the percent that is Automatched.
The remaining percentage represented by the light gray bar is the percent that was manually matched.
The report is calculated for you and can be viewed 2 different ways.
Yesterday
Last 3 months
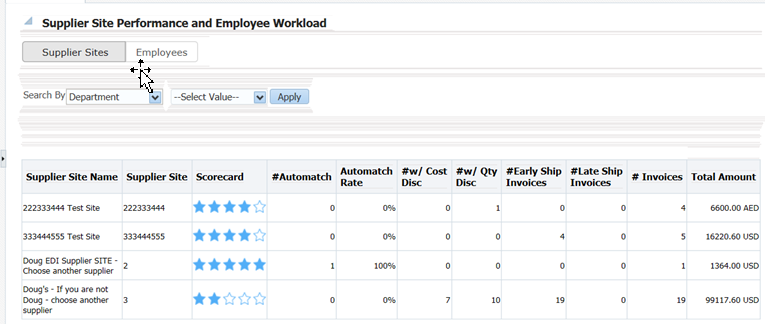
The Supplier site report lists each individual supplier that the employee is responsible for. This is only available on the Finance Manager dashboard. This report serves as a quick glance to see how the supplier site is performing and all the data that is shown is for the past 12 weeks (84 days).
Supplier site
Supplier site ID
Scorecard* (See below for more details)
# Automatch
Auto Match Rate
# w cost discrepancy
# w unit discrepancy
# early ship invoices
# late ship invoices
# invoices
Total amount
You are able to sort and filter based off of Supplier site ID.
The Finance Manager will see a list of the supplier sites of the employees that roll up to that role.
*Scorecard: The supplier site rating based on certain parameters such as discrepancy occurrence rate, exact matches vs matches within tolerance and shipping performance.
Weightage assigned to each of the criteria is stored in a configuration table. See Compliance Metric for more details.
Search By: You will be able to search by the levels below in order to do a quick look up of supplier site performance:
Dept
Supplier Site
When the down arrow of the Search By box is clicked; you are given the option to select either department or supplier site. Then you must enter in the ID of the corresponding level you want to search. When you click the Apply box, any supplier site that has items in the level that was searched is returned for review of your performance. This search gives the Finance Manager a way to search at the department or supplier site for ease of use.
If you enter an incorrect ID for any of the levels, an error message is provided letting you know that the ID entered is inaccurate.
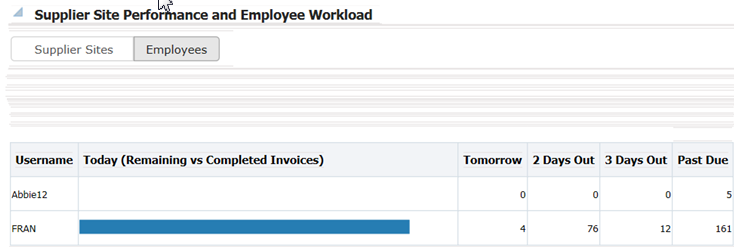
On the Finance Manager dashboard, this user has the option to toggle between the supplier site performance report and the employee workload report. The employee workload report provides a way for the finance manager to track their employee's performance. This report is not available on the Accounts Payable Specialist Dashboard.
The Finance Manager will see a list of employees that report to them and date for 5 data ranges associated with manual matching of invoices.
Invoices due needing manual matching will be shown for the following time ranges, and in this order:
Today (Remaining vs Completed)
Tomorrow
2 days out
3 days out
Past due
For the Today (Remaining vs Completed) column, there is a horizontal bar graph that shows the Completed vs. Remaining workload for each employee.
Completed Invoices: The blue horizontal bar represents the number invoices that have already been completed by manual matching.
Remaining Invoices: The light gray horizontal shaded bar represents the remaining workload that the employee needs to match.
For the Remaining time frame, ie: Tomorrow, 2 Days out, 3 Days out and Past Due columns, the data is represented as a number that is the remaining invoices that each employee is responsible for.
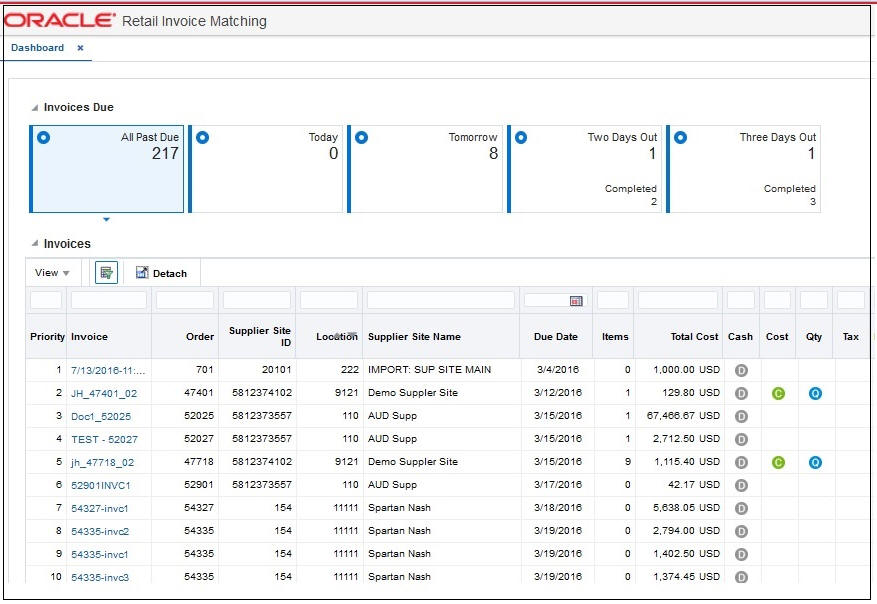
The main purpose of the Invoices report is to allow the Accounts Payable team to manage their work-load. The list of invoices can be sorted and filtered to allow you to resolve and match the highest priority invoices first.
The report will be initially sorted based on a pre-determined set of criteria that is listed below but you can use the sort and filter capability to change the way the invoices are sorted.
The columns that are displayed to you and available for viewing are as follows and are further detailed in the Metrics section of this document.
Priority (detailed below)
Invoice
Order
Supplier site Name
Location
Due Date
Items
Total Cost
Cash Discount
Cost
Qty
Tax
Five pre-defined tiles are used to filter the report. The five tiles are:
Past Due
Due Today
Due Tomorrow
2 Days Out
3 Days Out
In addition, within the filters applied by the tiles, you can also use standard ADF QBE filtering on each column of the report.
On the Invoices report there are 3 opportunities for you to contextual launch directly into the ReIM application for discrepancy resolution or invoice matching. In all 3 instances, we need to pass certain parameters to ReIM for ease of navigation.
TAX Discrepancy: When you click the TAX icon (T) on the Invoices Report, they will be launched into the Tax Discrepancy Review List in the ReIM application. If the RMS system setting has a tax type= sales, then the Tax Discrepancy filter or the Tax column will not be visible on the report.
|
Note: When there is a Tax Discrepancy, the contextual launch for Invoice ID will be disabled as you will not be able to match an invoice that has a tax discrepancy. |
Parameters: None
When user launches to the Tax Review list, they will see all invoices associated with their ID that have tax discrepancies.
Cost and Qty Discrepancy: When you click either the Cost (C) Or Qty (Q) discrepancy on the Invoices Report, they will be launched into the Discrepancy Review List in the ReIM application. From this window they will be able to resolve discrepancies for items on the invoice. If discrepancies are resolved for all items on an invoice, the invoice goes to a matched status.
Parameters: Document ID
Summary Match Window: When user clicks on the invoice number in the Invoices report, they will be launched into the Summary Match window in the ReIM application. On the Summary Match window, you will be able to match invoices.
Parameters: PO number, Location, Document ID Supplier ID, Supplier Site ID
The priority metric that will be used to sort invoices is based on pre defined criteria. By using the priority invoice sorting, invoices having the highest priority are brought to the users' attention first thus helping them prioritize their work for the day and pick the most important invoices first for manual matching and for discrepancy resolution. The following metrics are considered for deriving the priority of the invoice:
Due Date (in order of: Past due, Due today, Due tomorrow 2 days out, 3 days out)
Cash Discount= Y
Total Cost amount (Descending order)
Cost Discrepancy= Y
Unit Discrepancy= Y
Group by date in this order: Past Due, Today, Tomorrow, 2 days out, 3 days out.
Within each group, show invoices with a cash discount first. Within the cash discount invoices show highest Total cost invoices first then descending order.
For invoices not having cash discount, prioritize the ones having cost discrepancy and unit discrepancy first, the ones with only cost discrepancy next and then the ones with only unit discrepancy last. Within each group prioritize by the Total Cost of the invoice in descending order.
The next group will be Invoices due today, use the same logic to prioritize these next.
In-context BI Reports are displayed in the contextual pane of some ReIM windows. In-context BI reports provide additional In-context insights to the data being viewed in the ReIM window.
The following ReIM windows have In-context BI reports displayed in the right pane:
Detail Match
Summary Match
Discrepancy Review List
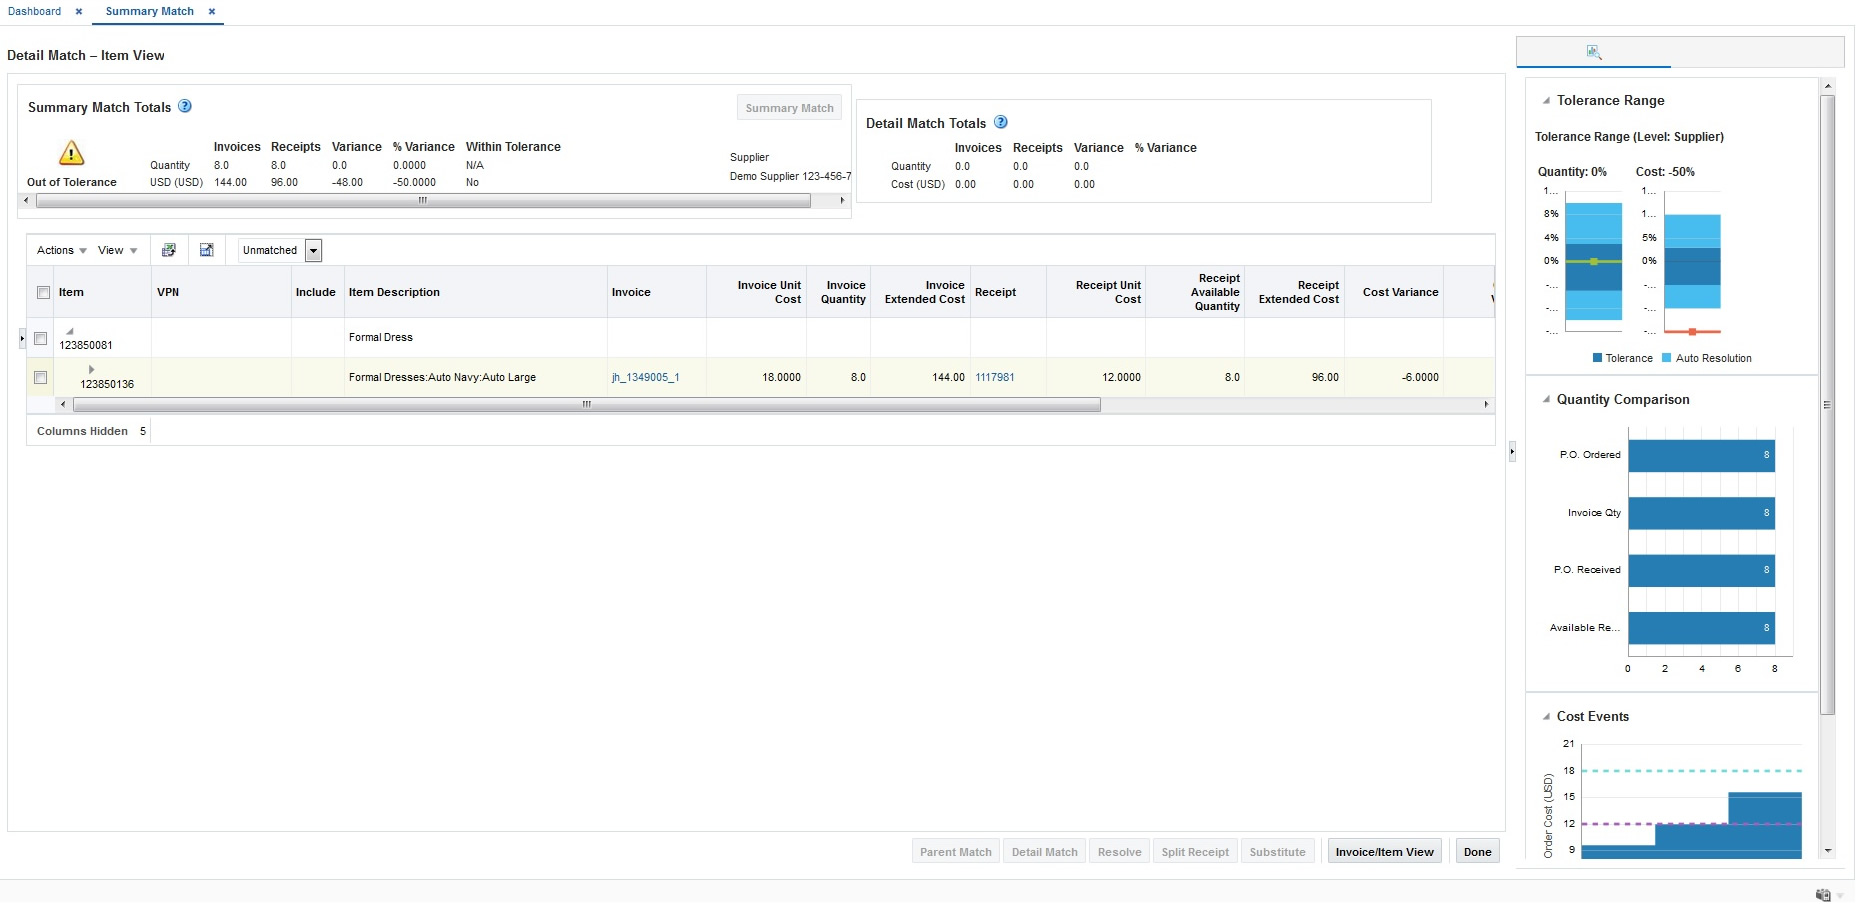
The following are In-context BI reports displayed on the Detail Match window:
Quantity Comparison
Cost Events
Tolerance Range
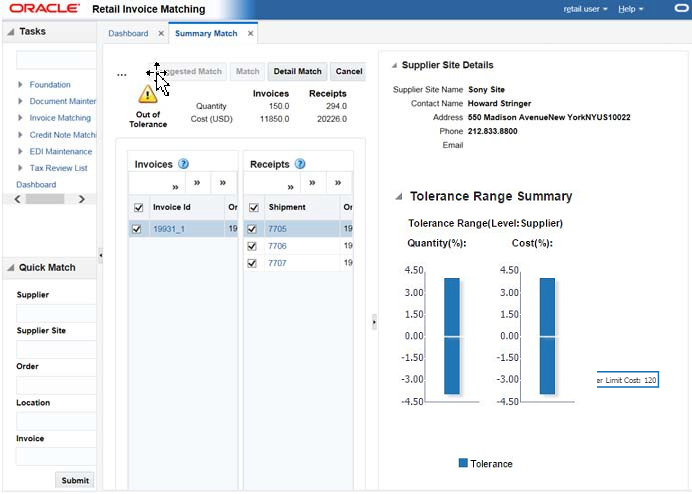
The following are In-context BI reports displayed on the Summary Match window:
Supplier Site Details
Tolerance Range
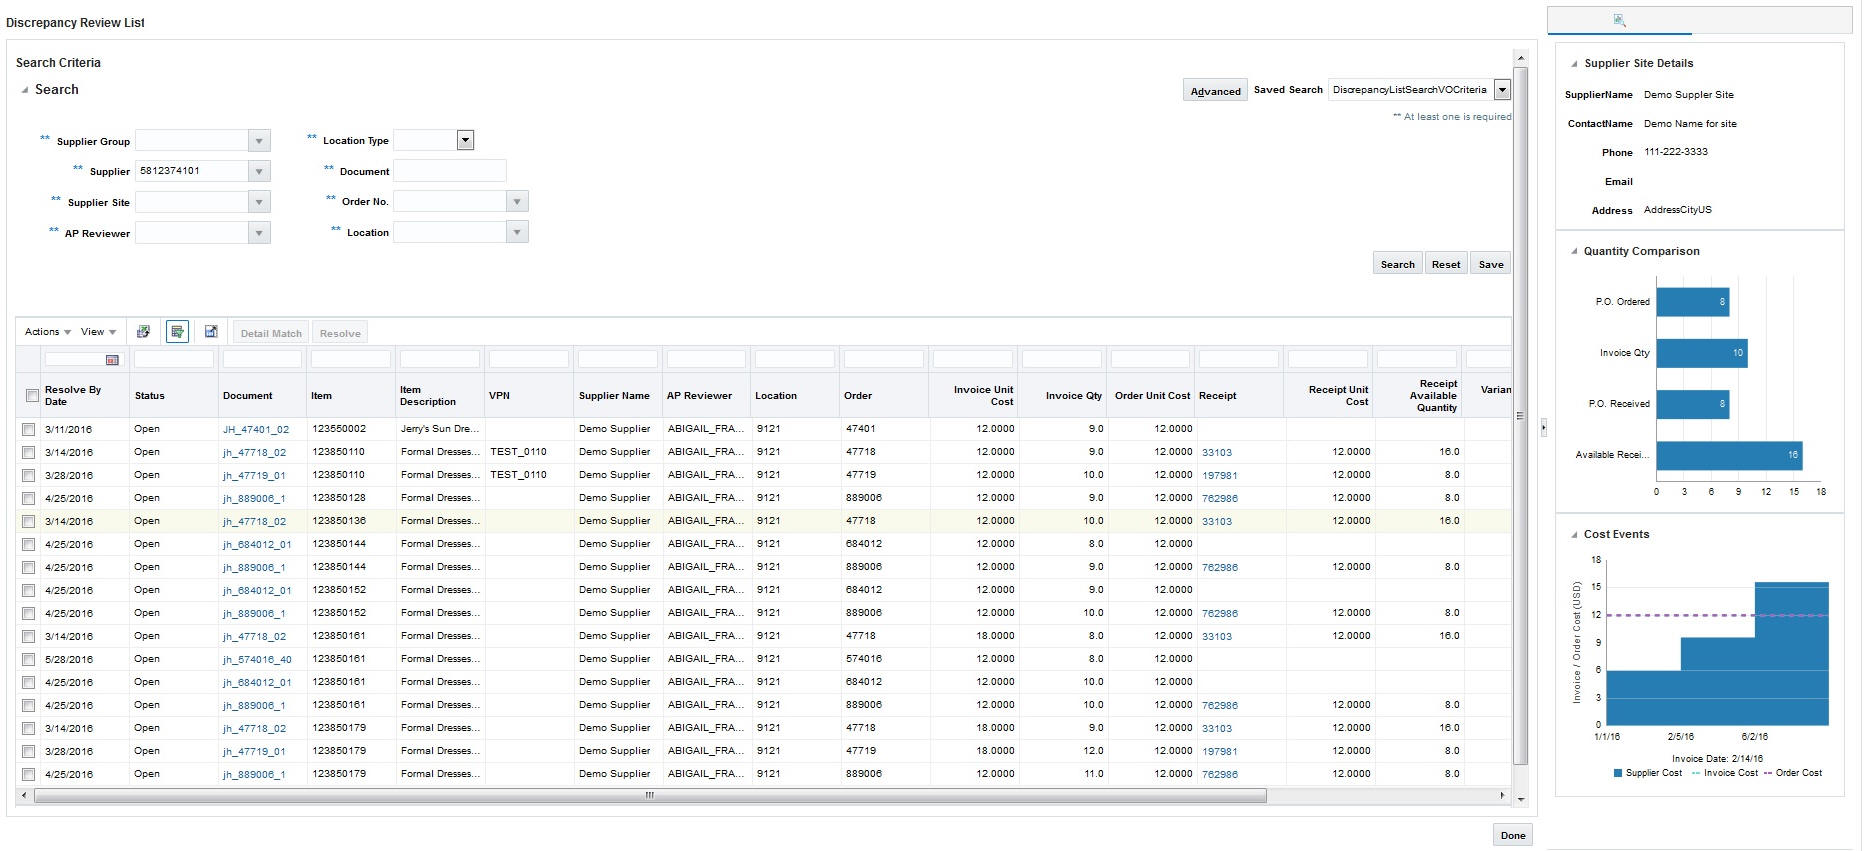
The following are In-context BI reports displayed on the discrepancy review list window:
Supplier Site Details
Cost Events
Quantity Comparison
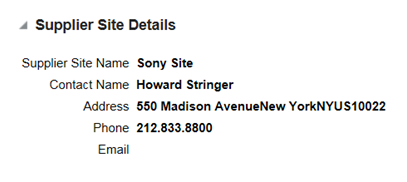
The Supplier Site Details report will provide you the necessary information to get in contact with the supplier site they are working with. This report will be visible in the BI pane when you are in the Discrepancy Review List window as well as the Summary Match window.
The details provided in the report are as follows:
Supplier Name
Contact Name
Address
Phone number
E-mail address
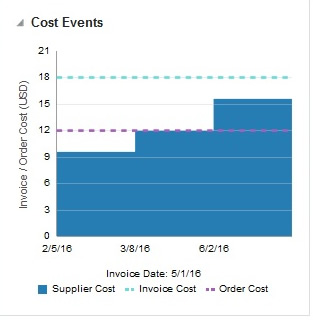
This report will provide you the visibility into the last two cost changes and one in the future using the invoice date as a reference. This may help explain why an invoice has a cost variance in the ReIM application. This report is visible when user is on the Discrepancy Review List window and when user is on the Detail match window.
The X axis of the report shows the dates that the cost changes either occurred or will occur and the Y axis shows the price points of the cost events. There are 2 lines that represent both the P.O. Cost and the Invoice cost of the invoice that is selected so you can see where the variance is.
There are three cost events displayed; using the Invoice Date as the reference. There are two past cost changes and one future cost event.
The Detail Match window is a three-tiered table, If a parent row is in focus, the report is refreshed but will not show any data. If the SKU row is in focus, the report is refreshed and PO Cost and Invoice cost will update based on the SKU. If the focus is on a row below the SKU level, the report is not refreshed. The Discrepancy Review List is a single hierarchy table sowing the sku row, so the report will always be based on the row in focus.
Invoice Date: The Invoice date is listed and plotted on the graph using a tic mark. If the invoice date is outside of the cost changes listed (before first or after last), the tic mark will be right outside of the graph so it will not impact the scale of the graph.
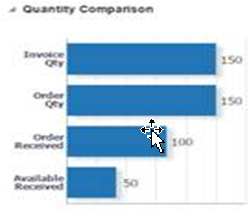
This Report gives you a quick glance at where the discrepancy lies in terms of Quantity.
The report is visible when user is on the Discrepancy window in ReIM and when user is on the Detail Match window.
The report is made up of 4 horizontal bars:
Invoice Qty
P.O. Ordered Qty
P.O. Received Qty
Available Received Qty
On the bar graph, show the numerical value for each metric, all bar graphs are the same color but the size of the bar will reflect the variances.
When you are on the Detail Match window and focus is on a sku row, the report will populate with data associated with the highlighted sku. If a parent row is in focus, the report will be populated with totals selected for the parent. The Discrepancy Review List is a single hierarchy table showing the sku row, so the report will always be based on the row in focus.
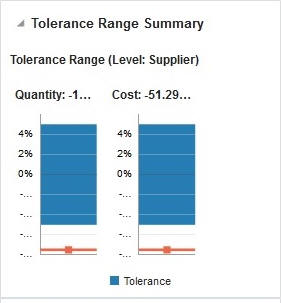
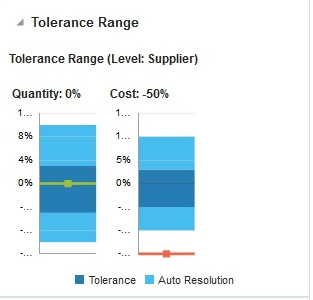
The Tolerance Range report shows you what the current tolerance ranges (both Qty and Cost) are for the invoice that they are reviewing in the application. This could be at the supplier site level or higher. This report is visible on the Summary Match window as well as the Detail Match window.
The Tolerance Range report is triggered when ever an invoice or receipt is selected. The variance shown in the report is a visual representation of the variance shown in the Summary Match totals table in the top left quadrant of the window.
The report consists of two bars, one for the quantity tolerance range, and the other for the cost $ tolerance range. The cost (or quantity) variance is shown on the graph as a red line if it is out of tolerance or a green line if it is within tolerance.
The Tolerance Range Level shows the level that is currently being used for the invoice that is selected in the application. Available options for the Tolerance Range Level are: Supplier Site, Supplier, Supplier Group, Department or System.
The Tolerance Range report should be triggered when a parent row or a sku row is highlighted. The tolerance range is based on the tolerance setting for the selected group of documents, and does not change as various sku rows are selected. When a parent row is highlighted, the tolerance report uses parent level tolerances instead of line level tolerances. The variance however reflects the specific value from the highlighted row.
If an Auto Resolution threshold has been defined (for line item level tolerance setting), in the Detail Match window, the inner-bounds of that tolerance are displayed in a different color shade with the levels displayed. These levels show the split-out by tolerance and auto resolution tolerance. The Auto Resolution threshold is not shown in the report for the Summary match window, as this does not apply to this level. Move the cursor over the tolerance range bar to view the actual tolerance and auto resolution levels.
RMS has two types of OI reports, Dashboard and In-context.
RMS OI dashboard reports are role-based and usually the first screen displayed to you upon opening the application; intended to highlight actionable or frequently monitored activity. Actions taken from dashboard reports generally launch into a solution's screen passing parameters in a specific format. The dashboards are specific to various roles such as Buyer, Inventory Analyst, Inventory Control Analyst, Finance Analyst, and Data Steward and contain role specific reports. These Dashboards highlight the areas of focus for a user and help to prioritize work for the day.
In-context reports are displayed in the selected RMS window and allows for an extension of information available in the associated screen to provide further details about a transaction or entity that is not present on the screen. It dynamically refresh when certain actions (called contextual events) are performed on the task flow.
System administrators can customize the reports and dashboards by switching the reports on or off, re-aligning the reports in the same dashboard or move the reports to different dashboard. New reports can also be built by customization. In-context reports can be created by using predefined In-context parameters.
Users can configure dashboard reports by defining various parameters such as threshold values, default options, department level exceptions and so on. These values are defined during installation and can be modified later.
The RMS OI reports are as follows:
Buyer Dashboard
Sales Report
Early/Late Shipments Report
Open to Buy Report
Orders Pending Approval Report
Data Steward Dashboard
Incomplete Items Report
Finance Analyst Dashboard
WAC Variance Report
Cumulative Markon Variance Report
Stock Count Value Variance Report
Shrinkage Variance Report
Late Posted Transactions Report
Inventory Analyst Dashboard
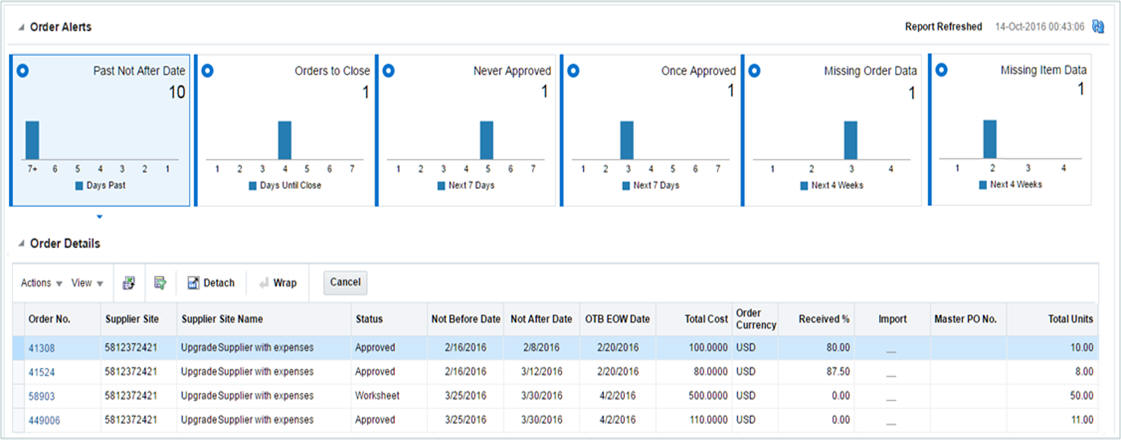
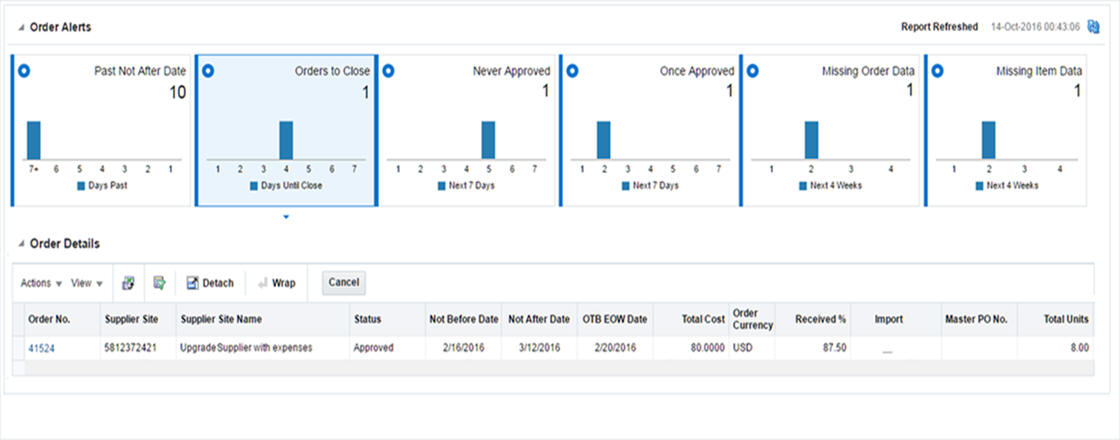
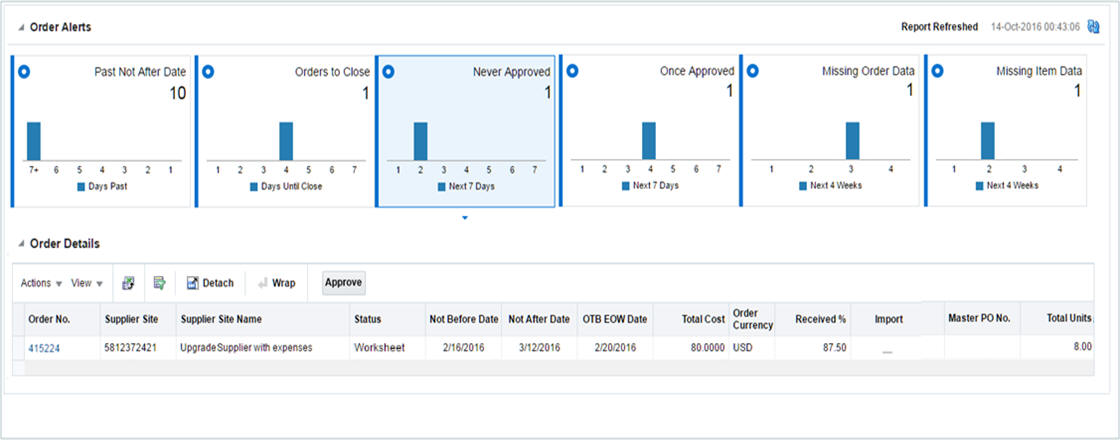
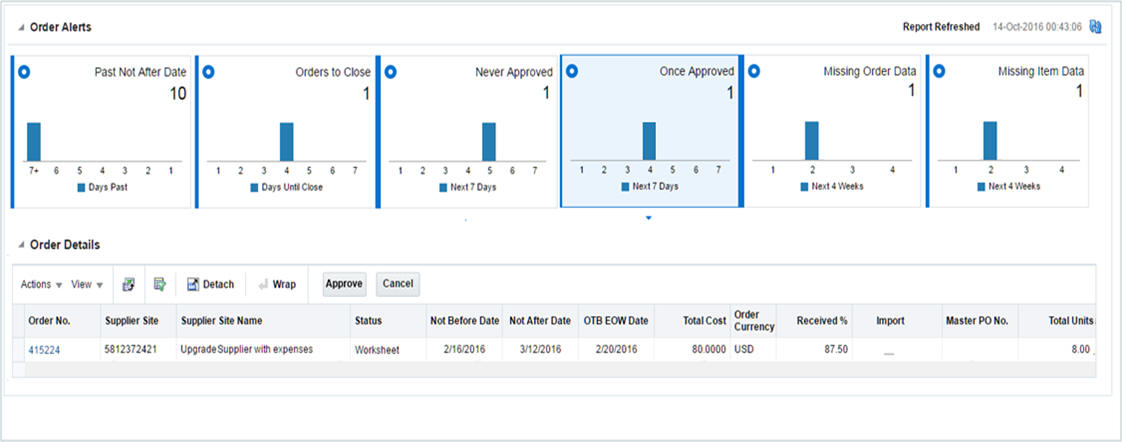
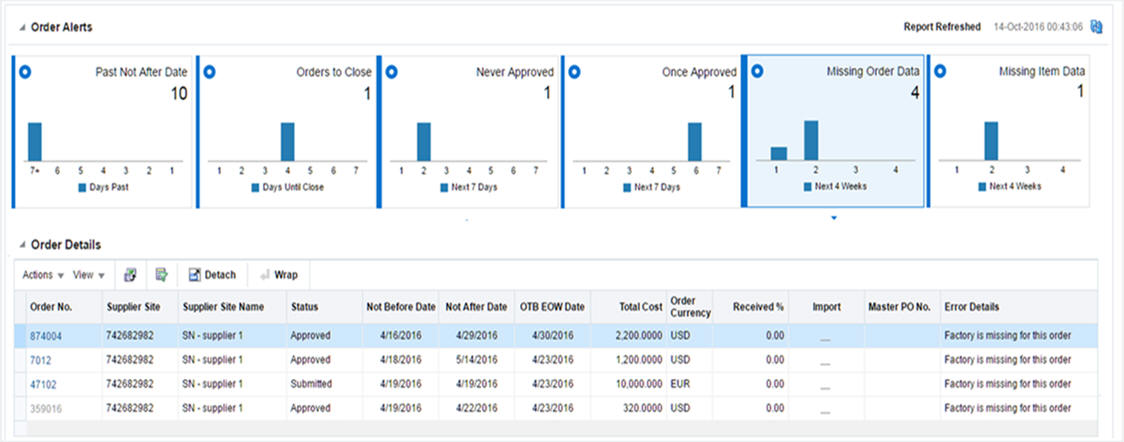
Order Alerts
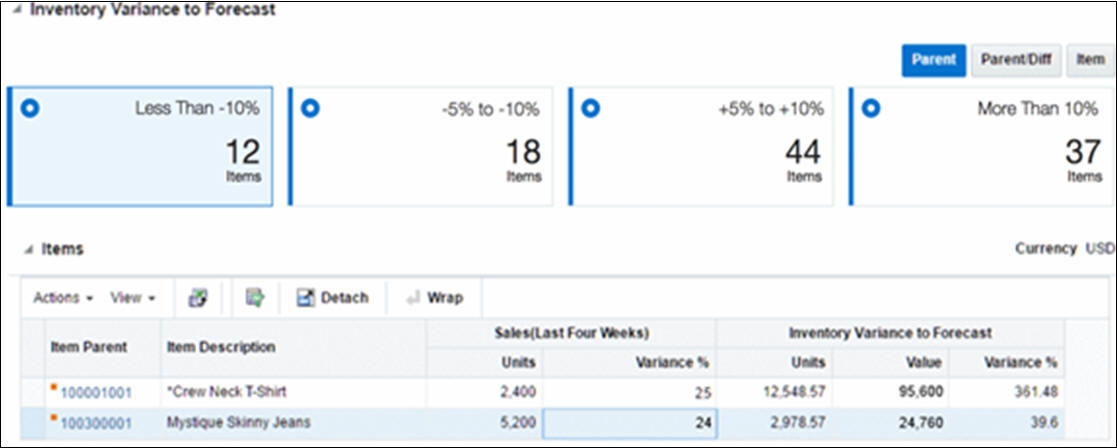
Inventory Variance to Forecast Report
Inventory by Store Report
Inventory by Warehouse Report
Lead Times Report
Open Orders Report
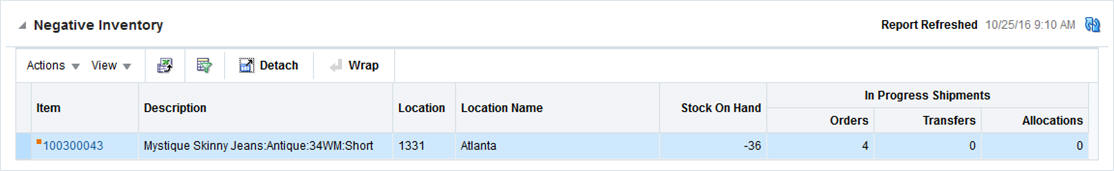
Negative Inventory Report
Inventory Control Dashboard
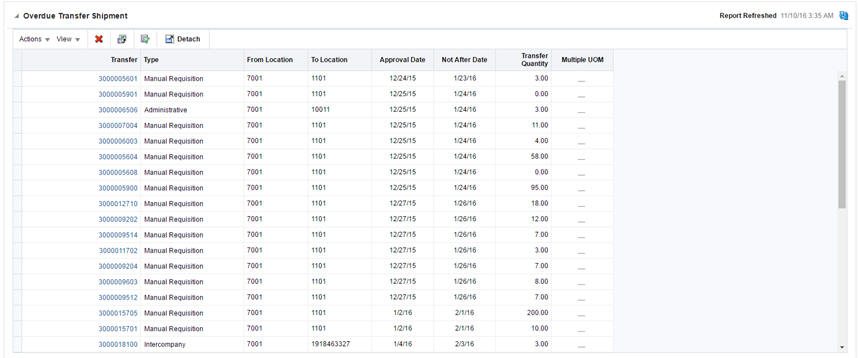
Overdue Transfers Report
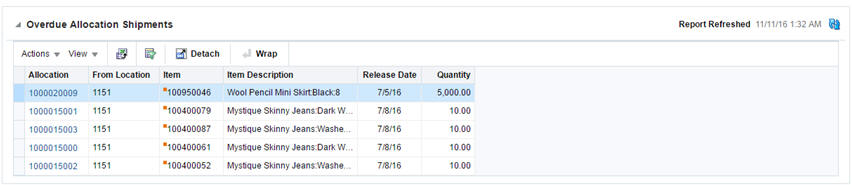
Overdue Allocations Report
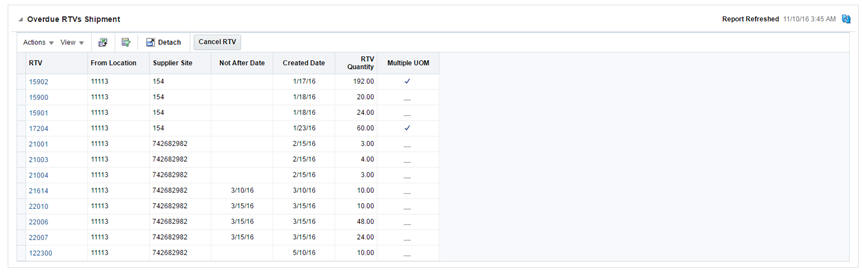
Overdue RTVs Report
Stock Count Missing Report
Stock Count Unit Variance Report
Stock Orders Pending Close Report
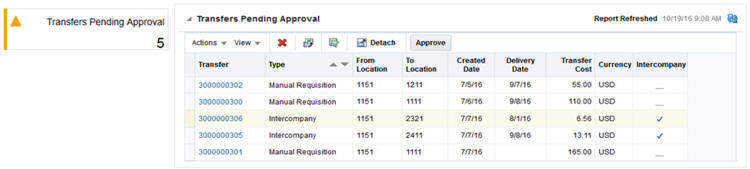
Transfers Pending Approval Report
Unexpected Inventory Report
In-context Reports
Item Details Report
Margin Impact Report
Open to Buy Report
Order Shipments Report
Order Summary Report
Parent/Diff Summary Report
You can use the dashboard level filter criteria to filter the reports by entering, selecting, or searching the criteria present in the RMS application. For example, to filter Buyer Dashboard:
To filter buyer dashboard:
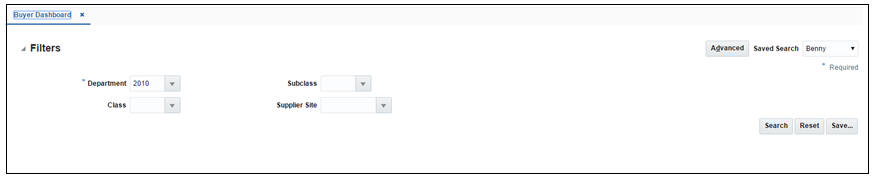
From the Tasks menu, select Reports > Buyer Dashboard. The Buyer Dashboard window appears.
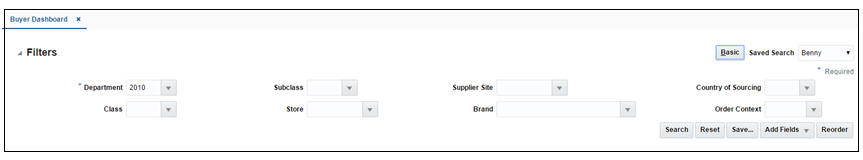
You can filter the buyer dashboard reports by providing specific values in the Filters section. The criteria can be provided either in Basic or Advanced mode, depending on the requirement. Basic is the default mode when the dashboard is entered. Click Advanced to access the filters panel in advanced mode. You can return to Basic mode by clicking Basic.
|
Note: Few filter criteria are available in Basic mode and few are in Advanced mode. On some dashboards few filter criteria are mandatory as well. |
To filter the dashboard reports through the basic search criteria:
Enter, select or search the default filters through the basic search criteria.
You can also click on the Saved Search drop down to select one of the saved sets of filter criteria. Selecting a saved search will populate the filter criteria section with saved filter criteria. If the saved search is selected to run automatically then the search will be executed too. You can also choose to manage and personalize the saved searches by clicking Personalize in the list. The Personalize Saved Searches window appears. For more information on the Personalize Saved Searches, see the section Personalize Saved Search.
Click Search. The data that match the filter criteria are displayed in the Sales, Early/Late Shipments, Open to Buy, Orders Pending Approval reports.
Click Reset to remove the specified filter criteria.
Click the Save.. button to save the current set of filter criteria as a Saved Search. The Create Saved Search window appears. For information on the Create Saved Search window, see the section Create Saved Search.
To filter the dashboard reports through the advanced search criteria:
Enter, select or search the filter criteria in the advanced filter pane.
You can also click on the Saved Search drop down to select one of the saved sets of filter criteria. Selecting a saved search will populate the filter criteria section with saved filter criteria. If the saved search is selected to run automatically then the search will be executed too. You can also choose to manage and personalize the saved searches by clicking Personalize in the list. The Personalize Saved Searches window appears. For more information on the Personalize Saved Searches, see the section Personalize Saved Search.
Click Search. The data that match the filter criteria are displayed in the Sales, Early/Late Shipments, Open to Buy, Orders Pending Approval reports.
Click Reset to remove the specified filter criteria.
Click the Save.. button to save the current set of search filter criteria as a Saved Search. The Create Saved Search window appears. For information on the Create Saved Search window, see the section Create Saved Search.
Select Personalize from the Saved Search list to view the personalized saved search. The Personalize Saved Searches pop up allows you to edit, copy, or delete saved search criteria set.
You can create a Saved Search by clicking the Save.. button in the Search Criteria panel after you have entered the criteria for your search. The Save button will call up the Create Saved Search window where the search is given a name and the user determines whether it should be the default search as well as whether it should be run automatically.
To view the created saved search:
Click the Save.. button. The Create Saved Search window appears.
Enter the name of the search.
You can also choose to save the combination of the search criteria by selecting the following check boxes:
Set as default
Run automatically
This dashboard is intended to be used by buyers in a retail organization. A Buyer generally focuses on managing sales and margin.
This dashboard has following filters:
Basic
Department*
Class
Subclass
Supplier Site
Advanced
Store
Brand
Country of Sourcing
Order Context
|
Note:
|
To view the buyer dashboard:
From the Tasks menu select Reports > Buyer Dashboard. The Buyer Dashboard window appears.
The following sections includes the Buyer Dashboard reports.
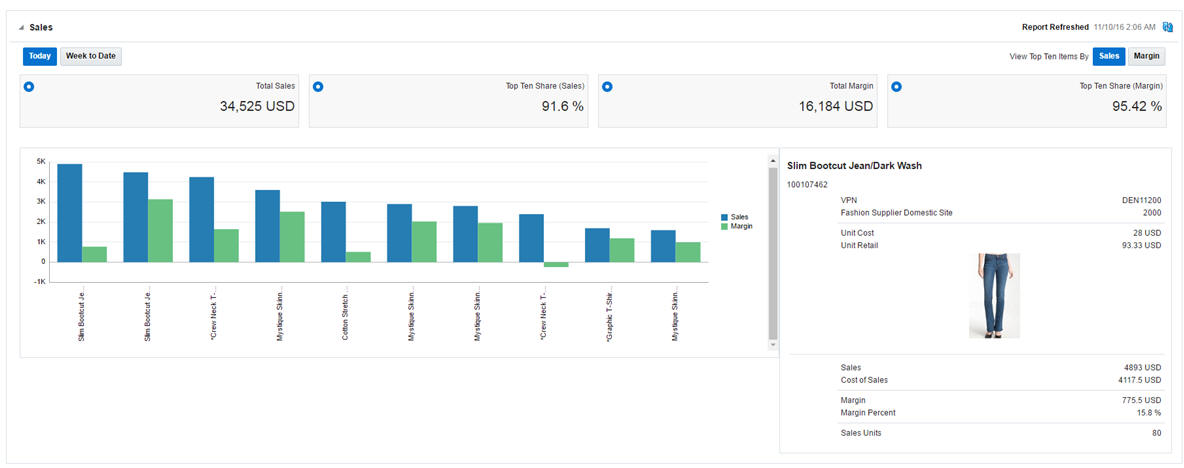
This report shows the sales and margin information of the top ten items by sales or margin for the user specified filter criteria. You can choose to see this information for today or week to date days. It gives you the visibility to value and unit sales of items, proportion of top ten items, proportion of top ten items' sales and margin to total sales and margin of chosen filter criteria. For every item it shows various other information such as VPN, Cost and Retail and image in the information pane contextually. To determine top ten items by sales/margin, the level of item considered is item parent/diff aggregate wherever applicable otherwise level 1 (transaction item). For a parent item with diff aggregation defined, sales/margin data of applicable diffs would be summed up accordingly and displayed. All monetary values shown in the report are in the primary currency of the retailer. There are no direct actions from the report.
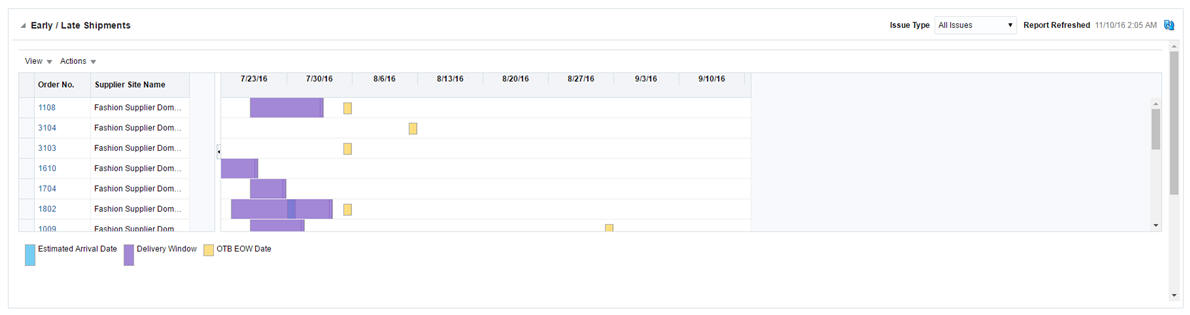
This report shows the orders with shipments that have potential issues, such as ASN not received, Late/Early Shipments, OTB Date breach window for a particular department, class, and subclass over the next 8 weeks. OTB Date Breach happens on orders where the shipment Estimated Arrival Date is either too close to OTB date or either beginning or end of week or already breached the OTB date. It can have two scenarios - one for when the date needs to move back (OTB Shift In) and one where it needs to move out (OTB Shift Out). Orders where Estimated Arrival Date is before ’Not Before Date' are classified as Early Shipment and if the Estimated Arrival Date of an order is after ’Not After Date', it is classified as Late Shipment.
With the help of this report, the buyer can make a preemptive and informed decision to update the Not After Date, Not Before Date, and OTB EOW dates for the order.
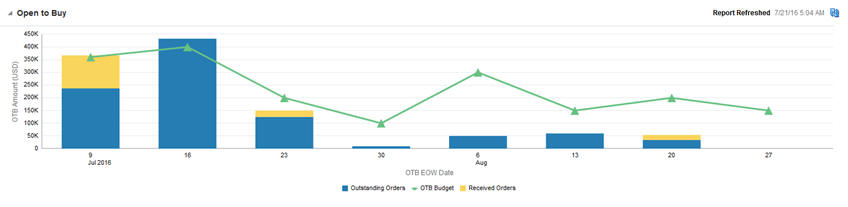
This report summarizes the open to buy position for a particular department, class, or subclass over the next 8 weeks. It is intended to give a buyer visibility to where they are over and under bought for their area, and will work in conjunction with the Early/Late Shipments report to help a buyer understand how late or early shipments may impact their OTB. The bars in the chart give visibility to the value of orders for the department, class, subclass, and date that have been received and approved. The line in the Gantt chart represents the budget.
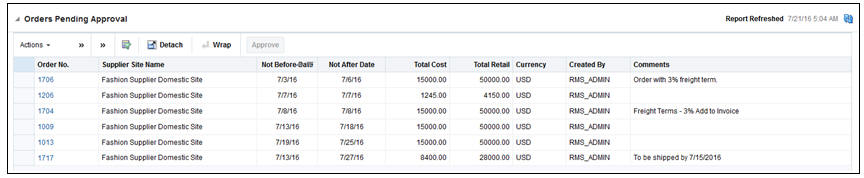
This report shows the orders in 'Submitted' or 'Submitted and 'Worksheet' status, based on the system level parameters that need to be reviewed by the buyer for approval or rejection. The orders shown in the table are limited by total cost or retail values that are inside the configurable user's threshold, as defined in RMS.
You can approve or reject one or more orders from the dashboard or launch In-context to see the details in the order. Rejecting an order will bring the order back to 'Worksheet' status. You have the option to add/edit comments while rejecting orders in the 'Reject Order' popup. This popup appears only when rejecting a single order. In case multiple orders are being rejected together, that will be done without a popup. Worksheet orders can be approved using the Approve action on the report.
The orders are listed as a tabular report with information related to the order. This includes order number, supplier, NBD, NAD, Total Order Cost/Retail, Created by, and order comments (optional column).
Only users with the 'Approve Purchase Orders' privilege are able to approve an order. For rejecting an order, the 'Maintain Purchase Orders' privilege is required. The Order Number is hyperlinked to navigate to the Order Details window in edit mode if the user has the maintain privilege, else view mode.
This dashboard is intended to be used by user who is responsible to maintain data standards and accuracy of foundation and item data. This dashboard focuses on timeliness and completeness of data setup.
This dashboard has following filters:
Basic
Department*
Class
Subclass
Supplier Site
Country of Sourcing
Created Date
Advanced
Location
Brand
Item Type
Item Level
Transaction Level
UDA/Value
To view the data steward dashboard:
From the Tasks menu select Reports > Data Steward Dashboard. The Data Steward Dashboard window appears.
The following section includes the Data Steward Dashboard reports.
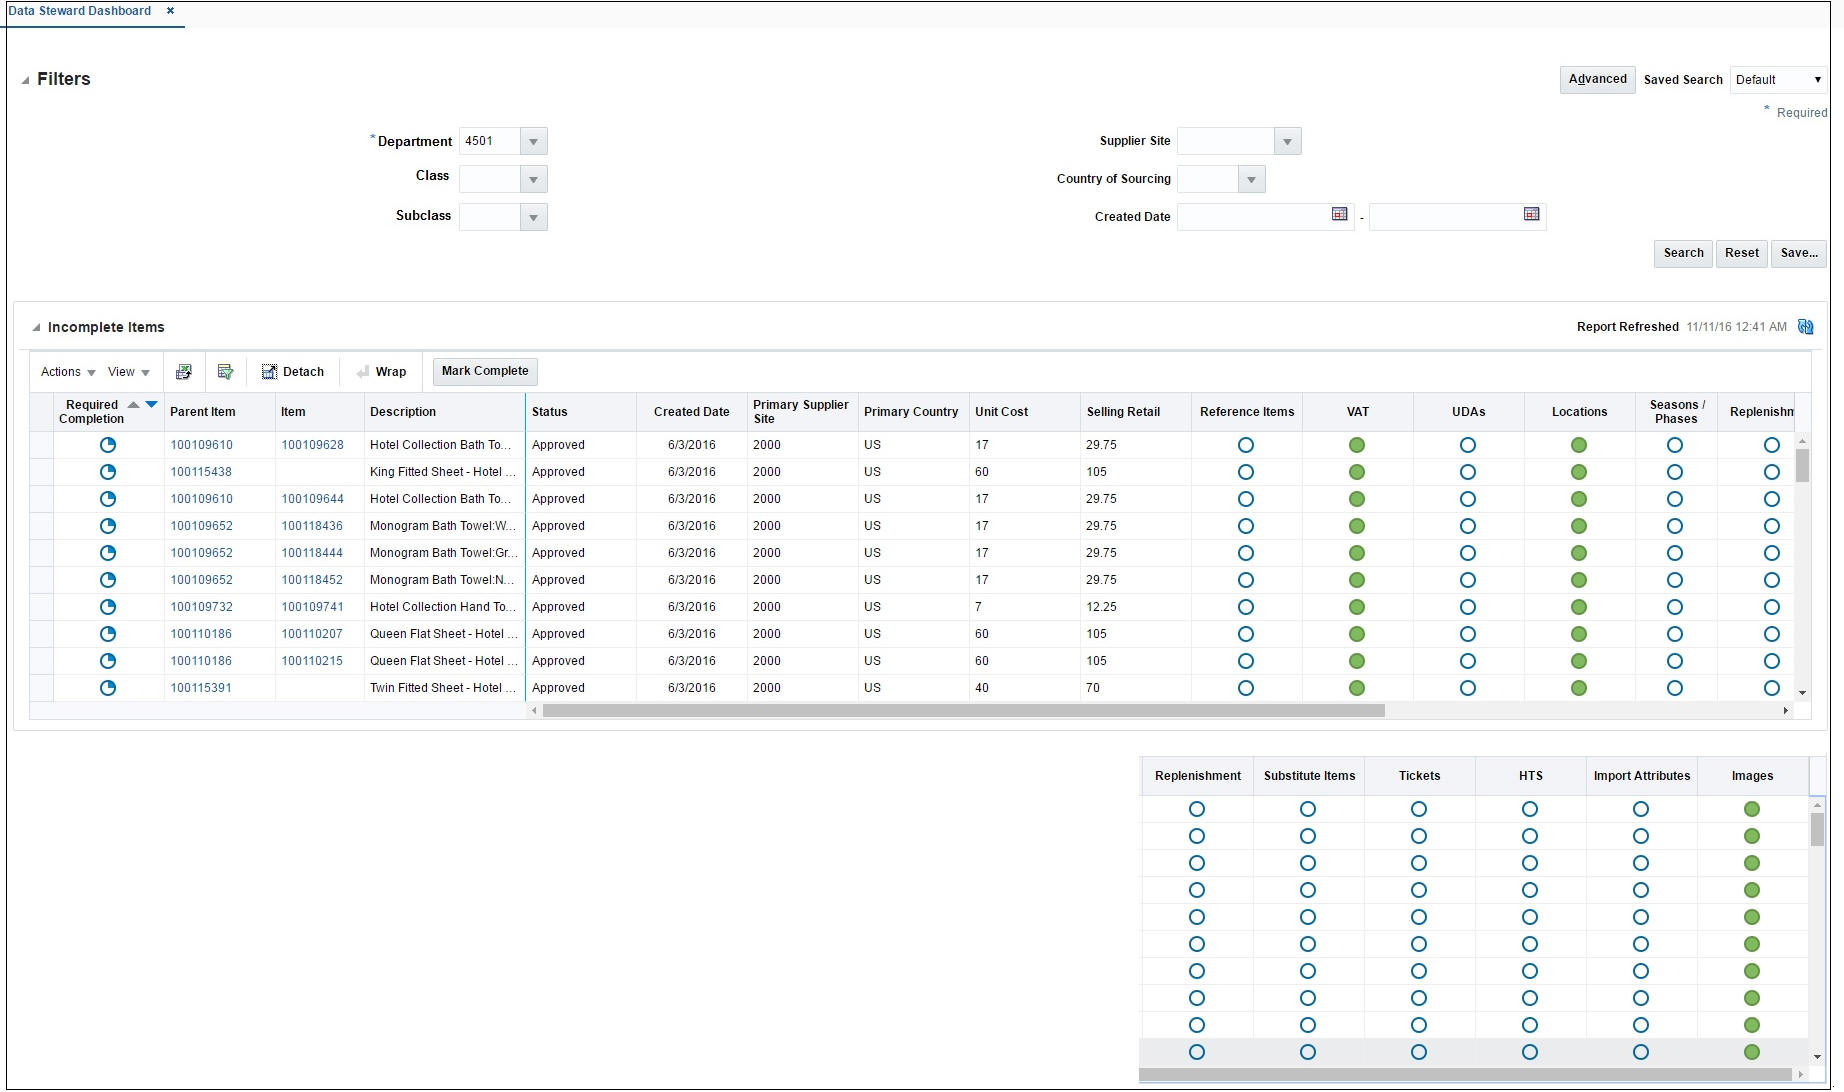
The purpose of the Incomplete Items report is to introduce work flow into the item creation process by providing visibility to what item-related data has been set up for new items and what still requires setup. This report displays all items that satisfy the defined filter criteria and are created within a configurable number of days.
The attributes to be tracked in the report can be configured by department. Each attribute can be either designated as required, optional, or not applicable.
Clicking the harvey ball icon which shows the completion status, contextually launches into the appropriate screen. Users will access the screens in either Edit or View, depending on their privileges. Users can also click on the item hyperlink to open Item screen for access to all attributes.
Finance Analyst will use this dashboard for evaluating inventory valuation and stock ledger accuracy. The report contains WAC and Cumulative Markon variances reports which will highlight to the users the item locations or subclass locations which have WAC and Cumulative Markon percentage which is outside the configured threshold values. The analyst can review and approve the valuation of physical inventory at each location for the business and resolve discrepancies if there are any. You can also evaluate late posted transactions, transactions that are posted to a month after the month is closed so that these transactions are accounted correctly in General Ledger.
This dashboard has the following fields:
Basic
Set of Books**
Org Unit**
Location**
Department
Advanced
Class
Subclass
To view the financial analyst dashboard:
From the Tasks menu select Reports > Financial Analyst Dashboard. The Financial Analyst Dashboard window appears.
The following sections include the Financial Analyst Dashboard reports.
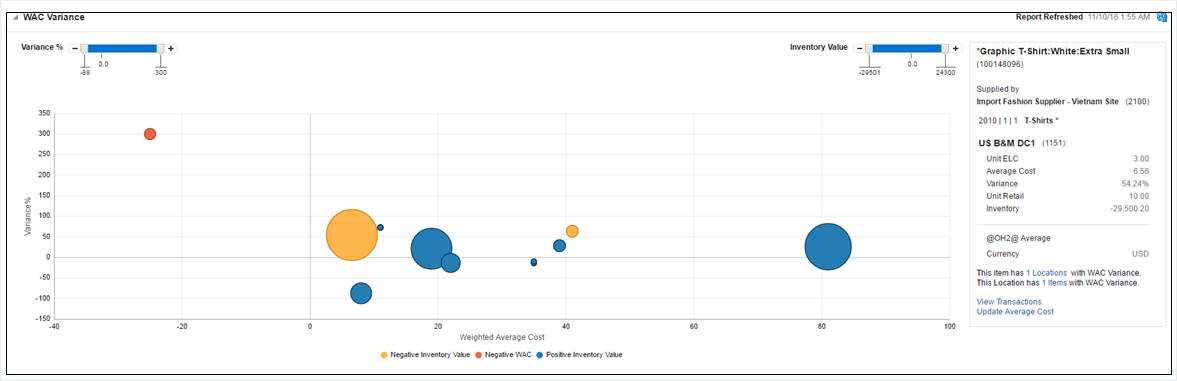
This report displays the item/locations having a variance between the unit cost and weighted average cost (WAC) that falls outside of a defined tolerance.
You can view the item/locations with WAC variance. In normal scenarios RMS does not allow WAC to become negative. This report highlights an item/location if the WAC falls to a negative value, regardless of tolerances, because this is of critical significance to business. In the chart, users are be able to restrict the data shown by variance percentage and inventory value.
You can launch the Stock Ledger screen to view transactions to further inquire about the potential transactions causing WAC variance. Also, users can launch the Average Cost Adjustment screen to correct average cost if they wish. The report will be refreshed after average cost is corrected.
There is a provision to see all the locations with WAC variance outside tolerance for the selected item or all the items with WAC variance outside tolerance for the selected location in separate popups.
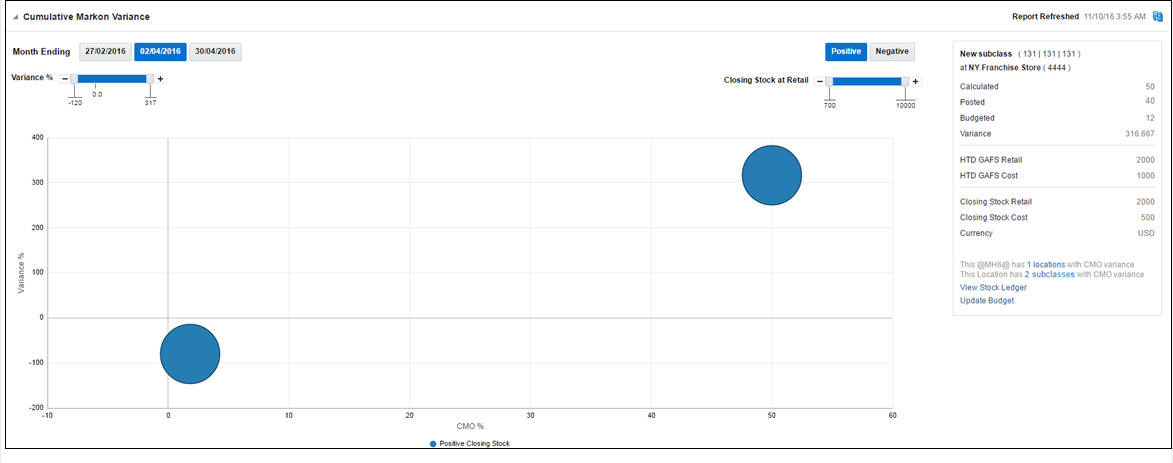
This report shows the subclass/location combinations having a cumulative markon variance (variance between calculated CMO of displayed month and the department budgeted intake percentage) that falls outside of a user defined tolerance and all negative cumulative markon percentages. The report displays the CMO Percentage variance for any one of the last three months based on the month the user selects.
You can launch into the Stock Ledger screen to analyze the reason for the cumulative markon variances. You can update the budgeted intake value for the department from this report. There are provisions to see all the locations with cumulative markon variances (outside tolerance or negative) for a specific subclass or all subclasses for a specific location in separate popups.
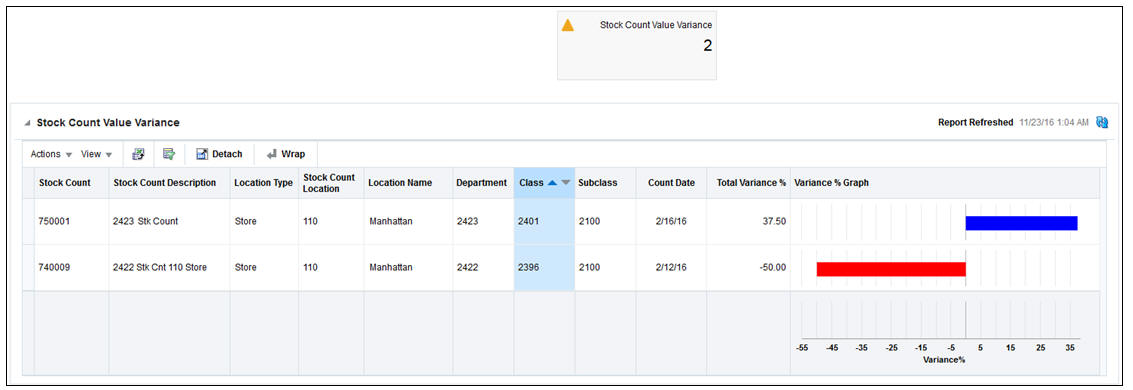
This report is used by the Finance Analyst to have visibility into 'Unit & Value' Stock Counts that have a value variance that is greater than a system defined tolerance. The number of stock counts with variances exceeding the threshold will be displayed on the report tile. The color will be set to green, yellow or red reflecting different levels of criticality based on the number of stock counts exceeding the tolerance and the existence of counts with variances are unresolved for more than a week after the count date Clicking on the tile will display the details of these stock counts in a tabular format. The table menu provides the Finance Analyst options to view the value variances and accept the count results.
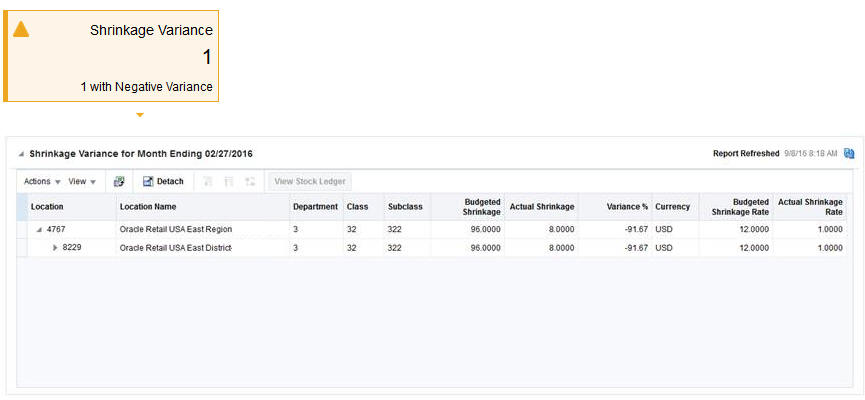
This report displays the actual shrinkage for subclass/location in the last month and compares it to the budgeted shrinkage rate, summarized to the region level. Values outside of a tolerance specified by the user are displayed to the analyst for research, and these values can be drilled down to the location level.
You can navigate to the Stock Ledger screen from this report UI in order to view the transactions corresponding to the subclass/location combination to further understand the potential transactions that could be causing the shrinkage variance.
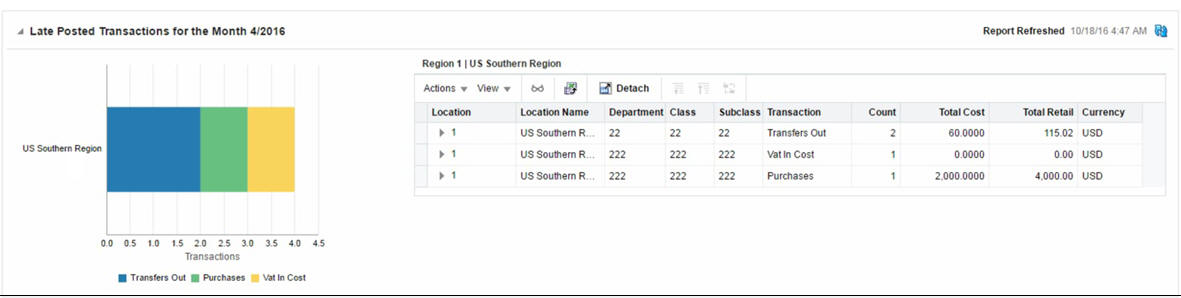
This report provides visibility to the Finance Analyst of any late posted transactions that have occurred since the last month close for the entire company and by location. Users can configure the organizational hierarchy level on which they want to see the late posted transactions. The table allows drill down feature for drilling down to late transactions at a store level.
This dashboard is intended to be used for managing inventory levels across the set of locations linked with the retailer. It helps in monitoring stock variance to plan for the assigned merchandise hierarchies and creating adjustments to open orders or replenishment settings.
This dashboard has the following filters:
Basic
Department*
Store Grade/Area**
Store**
Supplier Site
Advanced
Class
Subclass
Brand
Order Context
To view the inventory analyst dashboard:
From the Tasks menu select Reports > Inventory Analyst Dashboard. The Inventory Analyst Dashboard window appears.
The following sections include the Inventory Analyst Dashboard reports.
This report is focused on monitoring potential issues with purchase orders and providing a series of suggested actions. The following examples are a few of the conditions to be monitored:
Orders that are not fully received but more than x days past cancel date
Import orders that are missing lading ports, discharge ports, or have items missing HTS classifications
Orders that have never been approved
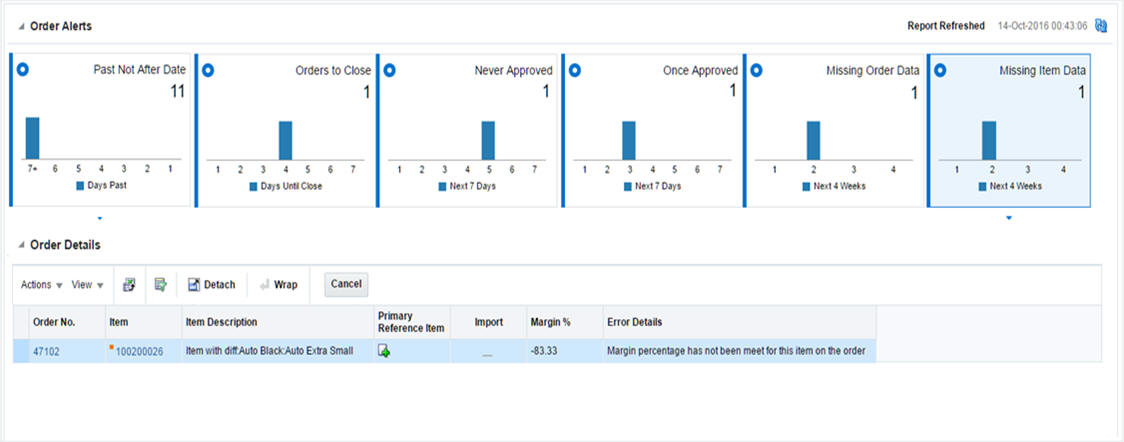
This report provides the Inventory Analyst a count of approved or previously approved orders that are due to arrive in the next 4 weeks, and are missing any of the following for one or more of the items on the order:
HTS Classification missing or in Worksheet status (for import orders only)
Reference Item not defined or not associated
Zero or negative margin
The tile will include a chart that visually shows the number of these orders spread across the next 4 weeks, based on their Not Before Date. Clicking on the tile displays the details of these orders in a tabular format. The table menu provides the following set of Actions:
Edit/ View Order
Edit/ View Order Details
Edit/ View Item
Edit/ View Item Parent
Add HTS
Add Reference
In case a reference item has not been defined any of these item in RMS, then for such items the results table will provide an in line icon based launch into the item children screen to allow for definition of a new reference item.
This report on the Inventory Analyst dashboard provides the Inventory Analyst with a view of the total number of orders that are past their Not After Date. The count of such orders is displayed on the report tile. The tile also includes a bar chart that visually depicts the number of orders that are past their Not After Date by durations between 1- 6 days and beyond. Clicking on the tile displays the details of these orders in a tabular format.
The table menu provides the Inventory Analyst the following set of Actions for orders selected in the table:
Edit/ View Order
Edit/ View Order Details
Cancel Order
Update Dates
Update Comments
This report provides the Inventory Analyst visibility into orders that are within a week of their Not After Date and have no open shipments against them. The number of orders meeting these criteria is displayed on the tile. The tile also includes a bar chart that displays by day, the number of orders with Not After Dates falling in the next seven days. Clicking on the tile displays the details of these orders in a tabular format.
The table menu provides the Inventory Analyst the following set of Actions for orders selected in the table:
Edit/ View Order
Edit/ View Order Details
Cancel Order
Update Dates
Update Comments
This report displays a count of orders that have never been approved and which need to be approved within seven days from the current date. The report tile includes a bar chart that visually depicts the number of orders that need to be approved (at the latest) on the current day and on each of the next six days. Clicking on the tile displays details of these orders in a tabular format. The table menu allows the Inventory Analyst to Edit, View, Approve or Delete the Order and if required make updates to the Order Dates for orders selected in the table.
This report displays a count of orders that have been approved in the past, but are in now in Worksheet or Submitted Status and which need to be approved within seven days from the current date. The report tile includes a bar chart that visually depicts the number of orders that need to be approved (at the latest) on the current day and on each of the next six days. Clicking on the tile displays the details of these orders in a tabular format. The table menu allows the Inventory Analyst to Edit, View, and Approve or Cancel the Order and if required make updates to the Order Dates for orders selected in the table.
This report provides the Inventory Analyst a count of approved or previously approved orders that are due to arrive in the next 4 weeks, and are missing one of the following:
Lading Port (for import orders only)
Discharge Port (for import orders only)
Factory
The report tile also includes a bar chart that shows the spread of these orders across each of the next 4 weeks, based on their Not Before Date. Clicking on the tile displays the details of these orders in a tabular format. The table menu provides Actions to View or Edit the Order details to complete the Order.
This report provides the Inventory Analyst a count of approved or previously approved orders that are due to arrive in the next 4 weeks, and are missing any the following for one or more of the items on the order:
HTS Classification missing or in Worksheet status (for import orders only)
Reference Item not defined or not associated
Zero or negative margin
The tile will include a chart that visually shows the number of these orders spread across the next 4 weeks, based on their Not Before Date. Clicking on the tile displays the details of these orders in a tabular format. The table menu provides the below set of Actions:
Edit/View Order
Edit/View Order Details
Edit/View Item
Edit/View Item Parent
Add HTS
Add Reference
In case a reference item has not been defined any of these item in RMS, then for such items the results table will provide an inline icon based launch into the item children screen to allow for definition of a new reference item.
This report shows item/location combinations with negative inventory balances in order to alert the retailer to take necessary action. Only those item/locations with inventory values less than their configured 'inventory variance' number of units (from zero) are shown.
This report is used by an Inventory Analyst to provide a weekly review of their business by highlighting items that have a significant inventory variance to forecasted sales over the next four weeks. It contains related reports that are used to provide more context and assist in decision making, as well as a number of actions that can be taken from the dashboard to resolve issues. Only forecasted, inventoried items will appear in this report.
You can filter the set of items based on their variance percentage from the set of inventory variance ranges that are present in the form of tiles as shown in the report layout, and view only the items matching the desired inventory variance range. You can choose to view the items at Parent, Parent/Diff or Item level. These items are displayed in the form of a table.
This report also allows you to defer or postpone a line item, as in some cases, there may not be anything that the Inventory Analyst can do to resolve this issue at this point of time. This allows you to clear the issue from the list for a defined period of time.
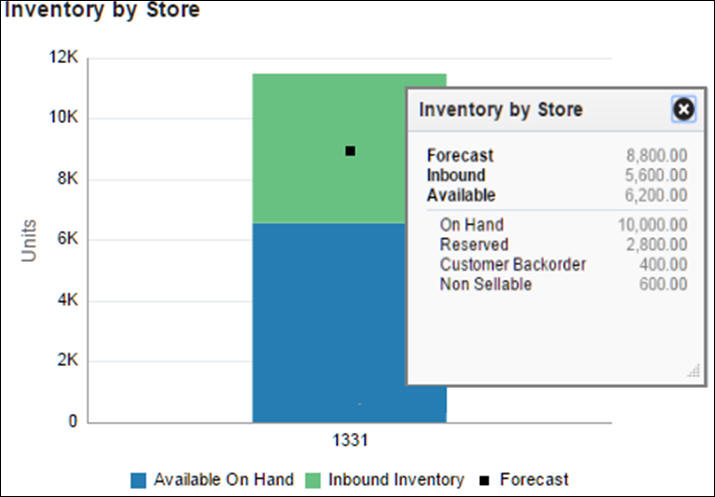
This report shows the inventory figures by active, ranged, store, store grade, or region for a particular item. It provides visibility to sales forecast data for the items in the same time period. This is shown in context of the main Inventory Variance to Forecast report on the Inventory Analyst dashboard based on a Parent item, Parent Item/Diff Aggregate or Transaction Item, depending on the level of the report. For each location, the report will display the Available on Hand, Inbound units and Forecasted Sales values. The location with the highest inventory will be shown first.
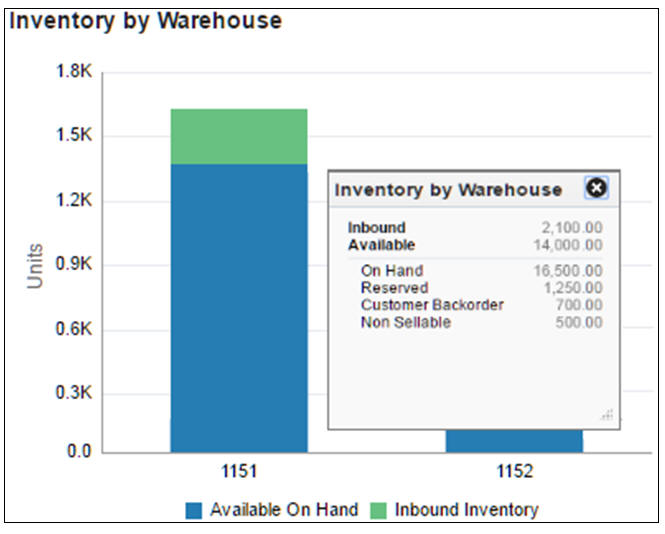
This report shows the inventory figures by active, ranged, or virtual warehouse for a particular item. It is shown in context of the main Inventory Variance to Forecast report on the Inventory Analyst dashboard based on a parent item, parent item/diff aggregate, or transaction item, depending on the level of the report. For each warehouse, the available stock and inbound inventory will be displayed.
This report is contextual to Inventory Variance to Forecast report.
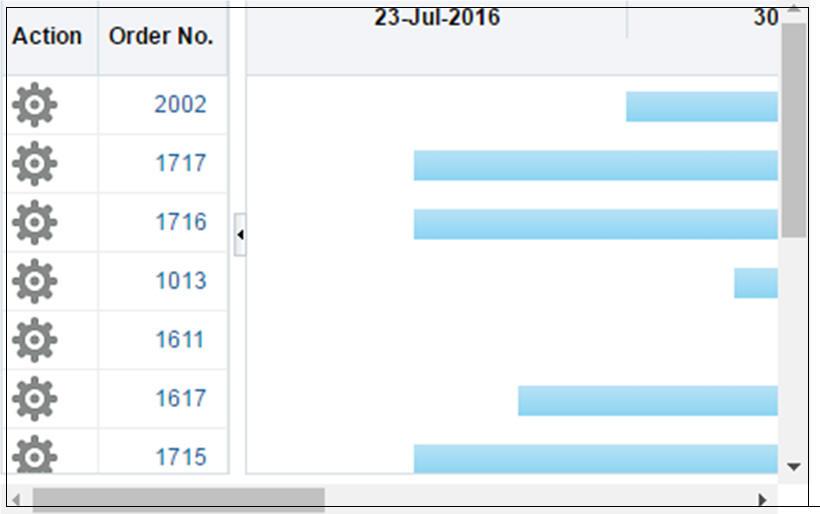
This report allows you to see open orders due in the next four weeks for the parent item, or parent item/diff aggregate, or transaction item selected to help determine whether there are any open orders that could be cancelled. It is shown in the context of the Inventory Variance to Forecast item table.
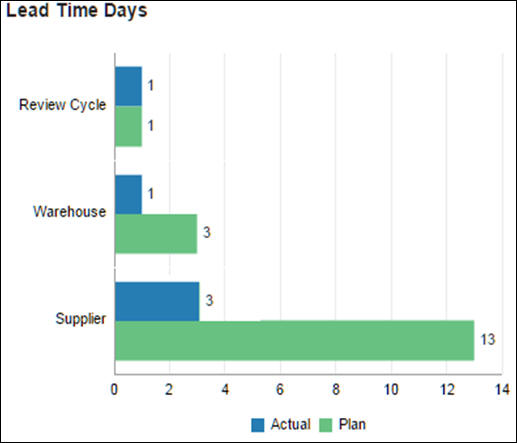
This report compares the "order to" levels set in the system, which drive the 'days of supply' calculations used in replenishment for replenished items, and the actual values based on recent order history. For items not on replenishment, only the Supplier Lead Time will be displayed.
This dashboard is intended to be used by a Corporate Inventory Control Analyst. The purposed of this dashboard to help in resolve inventory discrepancies and manage stock counts at the corporate level. By using this dashboard the user can ensure that the stock orders and RTVs are reconciled and closed in a timely manner and also the stock counts are reported, reconciled and processed within an acceptable processing window. Each report can be viewed by clicking on the respective tile on the left side of the dashboard. Filters for this dashboard are:
Chain**
Area**
Location**
Supplier Site
Department
Class
Subclass
|
Note: ** One of the filters are mandatory. |
To view the inventory control dashboard:
From the Tasks menu select Reports > Inventory Control Dashboard. The Inventory Control Dashboard window appears.
The following sections include the Inventory Control Dashboard reports.
This report shows the transfers in 'Submitted' status that have passed a certain configurable number of days after creation without being approved or deleted and will need to be reviewed before approval or deletion.
You can approve or delete one or more transfers from the dashboard or launch Transfer Window in context to see the details in the transfer. Deleting a transfer will move the transfer to 'Deleted' status.
This report provides visibility to approved transfers that have passed their Not After Date plus a configurable number of days and not shipped. If Not After Date is not available for transfers then the report will consider Delivery Date. This report will exclude franchise order transfers and franchise return transfers. In case OMS_IND = 'Y', customer order transfers will be excluded too. This report will show only intra-company transfers if the user doesn't have inter-company privileges otherwise all. Overdue Transfer Shipment report will be accessible through tile in the dashboard.
This report will provide visibility to approved allocations that have passed their Release Date plus a configurable number of days and not shipped. Overdue Allocation Shipment report will be accessible through tile in the dashboard.
This report will provide visibility to approved RTVs that have passed their Not After Date plus a configurable number of days and not shipped. If Not After Date is not available for RTVs then the report will consider Created Date. Overdue RTV Shipment report will be accessible through tile in the dashboard.
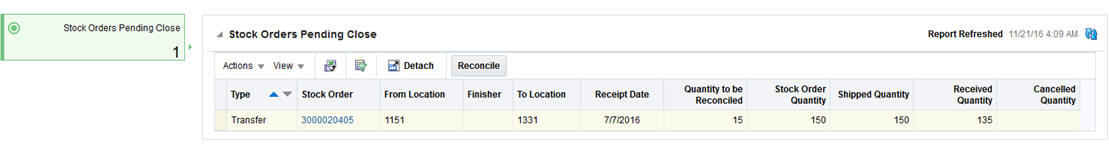
This report is used by the Corporate Inventory Control Analyst to have visibility into stock orders that are either
Past their receipt date and have not been closed due to mismatches between the shipped and received quantities or
Shipped but not yet received despite being past their date of delivery
The number of such stock orders will be summarized on the report tile. The tile will be flagged green, yellow or red as an indicator of criticality. The criteria governing tile criticality takes account of two parameters; an acceptable processing delay in days and a threshold number of stock orders, both of which can be defined through configuration. Clicking on the tile will display the details of these stock orders in a tabular format. The table menu provides the Inventory Control Analyst with the Actions to View the Stock Order shipments and Reconcile them.
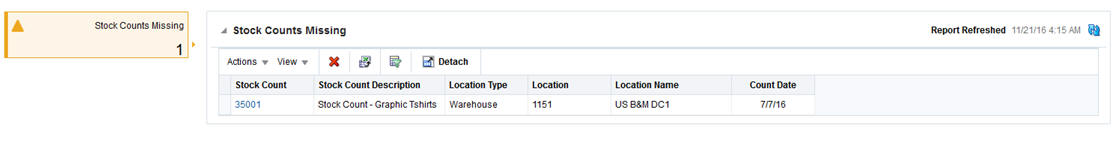
This report is used by the Corporate Inventory Control user for visibility to stock count locations from which physical count reports are pending/missing for both 'unit' and 'unit and value' type counts. Users have the option to view such counts based on relative aging and also edit or delete locations for which counts are pending. Users can also enter physical count data manually for select count locations that are missing count data.
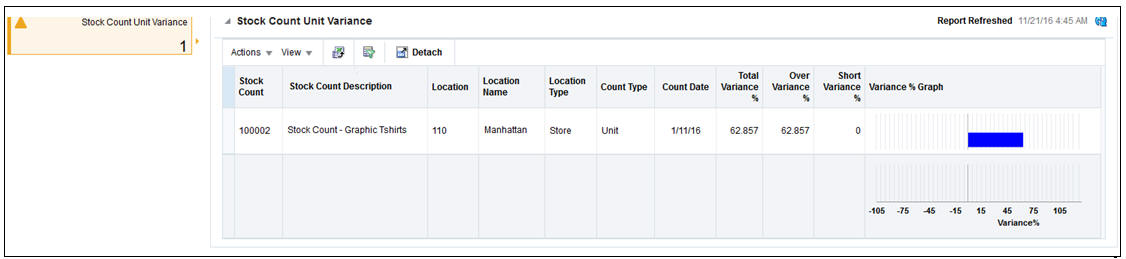
This report is used by the Corporate Inventory Control Analyst to have visibility into Stock Counts (both 'Unit' and 'Unit & Value') that have an unit variance that is greater than a system defined tolerance. The number of stock counts with exceeding variances will be displayed on the report tile. The color will be set to green, yellow or red reflecting different levels of criticality based on the number of stock counts exceeding the tolerance and the existence of counts with variances are unresolved for more than a week after the count date. Clicking on the tile will display the details of these stock counts in a tabular format. The table menu provides the Inventory Controller options to view the unit variances and to accept or update the count results.
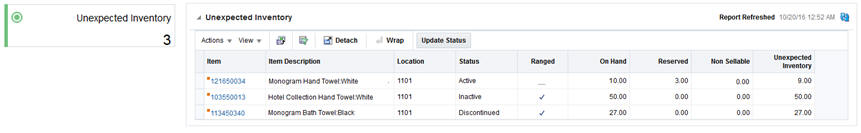
This report is used to provide visibility to items that were incidentally ranged to a location through transaction processing such as a customer return to a store. This report also shows user ranged item locations which have available inventory but is in a status other than "Active". This report is accessible via the tile "Unexpected Inventory" where the number on the tile will represent the count of item/locations that are present in the report. Users are able to make a decision on what action should be taken for these item/locations, such as updating the item/location status to "Active", changing them to "Ranged" locations or initiating transfers or RTVs. Users are able to launch the transaction data screen by which they are able to track the past transactions for the item location.
In-context reports are shown in selected RMS screens in collapsible panels and containers. These reports allow for an extension of information available in the associated screens to provide further details about a transaction or entity that is not present on the screen and dynamically refresh when certain actions (called contextual events) are performed on the task flow.
The RMS In-context BI reports are as follows:
Item Details Report
Margin Impact Report
Open to Buy Report
Order Shipments Report
Order Summary Report
Parent/Diff Summary Report
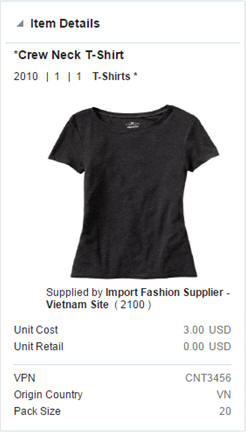
This report displays item details including a description of the item, item image, supplier site name, and hierarchical information. The unit cost, unit retail, VPN, Origin Country, and Pack Size are also included in this report.
It shows in the contextual pane of following RMS window:
Item Search
Item
Item Children
Item Children by Diff
Simple Pack
Related Items
Order Distribution
Order Details
Return to Vendor
Transfer Details
Mass Return Transfers
Stock Count Results
Contract
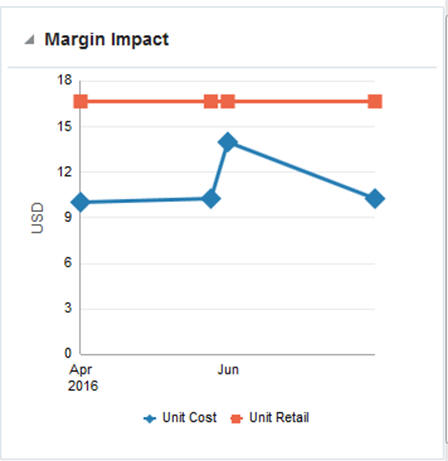
This report displays in the contextual pane of Cost Change by Item or Cost Change by Location in RMS to provide additional information about the item margins. The report displays the impact that the given cost change will have on the margin as well as the margin trend in the near future.
The report will show the Cost, Retail, and Margin values for cost change events two months in the past before the Effective Date of the given cost change and two months in future just after the Effective Date of the given cost change.
The report is contextual to the item, supplier, origin country, and effective date in the cost change by item screen and to the Item, location, and effective date in the cost change by location window.
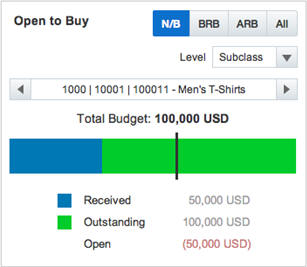
This report shows OTB information for the subclasses for the items on an order. The user can choose to view this information either by a particular order type or all order types together by subclass, class or department. It provides deeper insight to take decision regarding PO approval or date changes. The report displays a stacked horizontal bar graph showing the Received and Outstanding order values and vertical line showing the OTB budget. This can be accessed in the Order Header screen for order types in ARB, N/B or BRB.
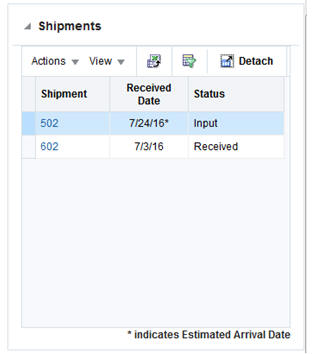
This report summarizes the shipments associated with a given order on Order Search window. It provides greater insight into the order by showing all associated shipments, ASN, Received Date/EAD, and Status. You can launch Shipment window by clicking on Shipment No.
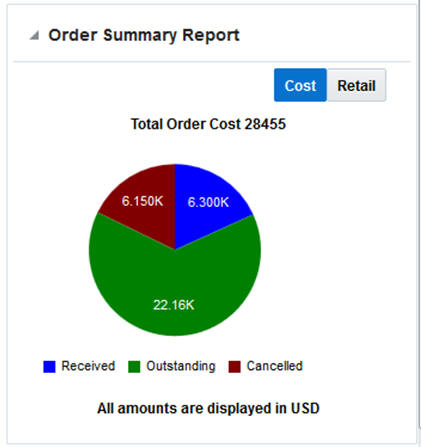
This report shows the total order cost and its breakup by received, outstanding and cancelled values. It displays the order summary information, either in terms of the associated cost or retail, based on the tab selected (cost/retail). This report can be seen on the Order Search screen and Can be used for taking decision regarding cancellation or date change of order when seen along with Order Shipments report.
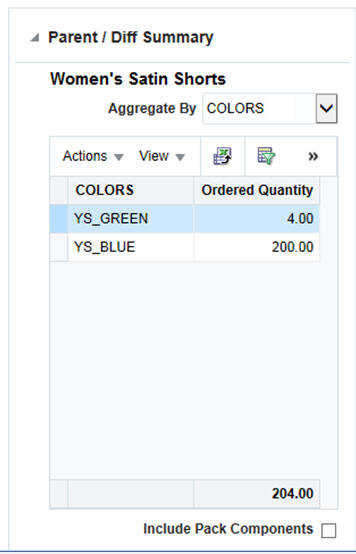
This report shows the summary of order or transfer quantity by parent/diff contextually. Users can choose which diffs to use for aggregating. For pack items, if it contains items from different parent items, you can toggle through different parent items. This report is available on Order Details and Transfer Details window.