| Oracle® Retail Warehouse Management System UI User Guide Release 15.0 E66766-01 |
|


 Previous |
 Next |
| Oracle® Retail Warehouse Management System UI User Guide Release 15.0 E66766-01 |
|
Previous |
Next |
Database administrators can use the options available on the DBA Administration menu to monitor a variety of database activities. Database administrators can view information regarding indexes, tables, table locks, rollbacks, sequences, and the error log.
Business Process
There is no business process pertaining to database administration.
This chapter contains the following topics:
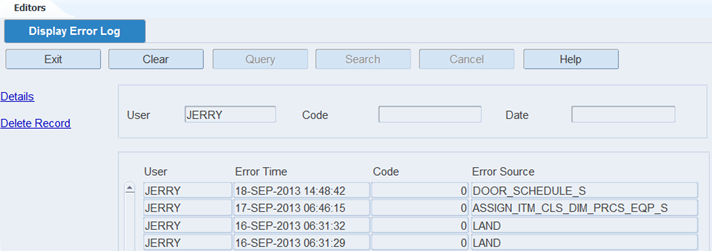
The Error Log allows you to view and delete logged errors. These are unanticipated errors or errors occurring in background processes.
You can generate the Error Log report. The report provides the following information for each error: user ID, error time, code, source, location, and message.
From the main menu, select DBA Administration > Display Error Log. The Error Log window opens.
Click Search
Display Errors by User, Error Code, or Date
If any errors are currently displayed, click Clear.
Click Query.
To restrict the list of errors to a specific user, error code, or date, enter the criteria in the appropriate text fields.
Click Search. The errors that match the criteria appear.
View Additional Details of an Error
On the Error Log window, select the error that you want to view.
Click Details. The details of the selected error appear in the Detail window.
Click Exit to close the Error Detail window.
Delete an Error Record
On the Error Log window, select the error that you want to delete.
Click Delete Record.
When prompted to delete the record, click Yes.
Exit the Error Log Window
Click Exit to close the window.
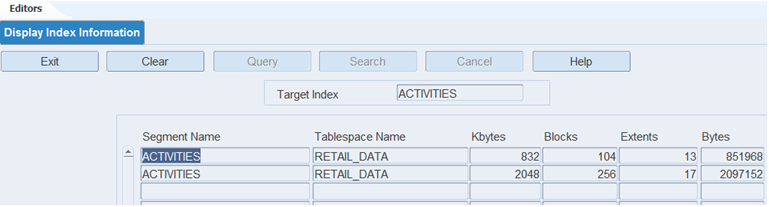
The Display Index Information allows you to view sizing information for the database indexes. You can use this information to analyze the growth of the database indexes, which can indicate table growth.
From the main menu, select DBA Administration > Display Index Information. The Display Index Information window opens.
Display Details for All Indexes
Click Search.
Display Details for One Index
If any index details are currently displayed, click Clear.
Click Query.
In the Target Index field, enter the name of an index, or click the LOV button and select the index.
Click Search. The details for the selected index appear.
Exit the Display Index Information Window
Click Exit to close the window.
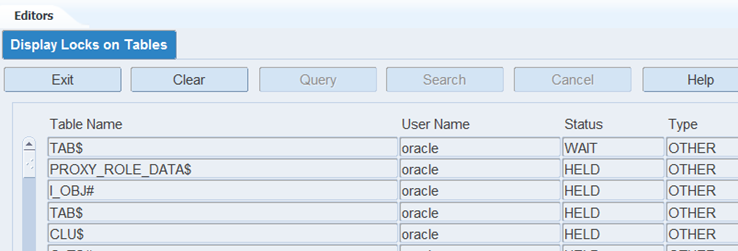
The Display Locks on Table window allows you to view the database tables which are locked.
From the main menu, select DBA Administration > Display Locks on Tables. The currently locked tables appear in the Display Locks on Tables window.
Exit the Display Locks on Tables Window
Click Exit to close the window.
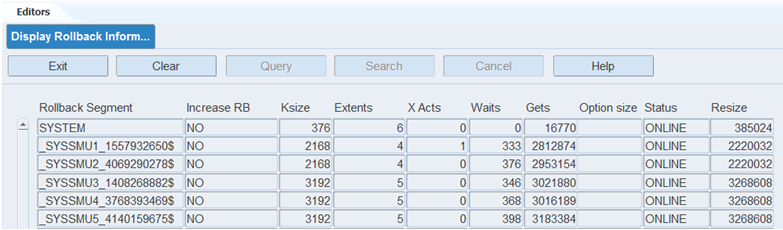
The Display Rollback Information allows you to view information about rollbacks. You can use this information to determine whether the rollback segments need to be enlarged for a specific installation.
From the main menu, select DBA Administration > Display Rollback Information. The current rollback segments appear in the Display Rollback Information window.
Exit the Display Rollback Information Window
Click Exit to close the window.
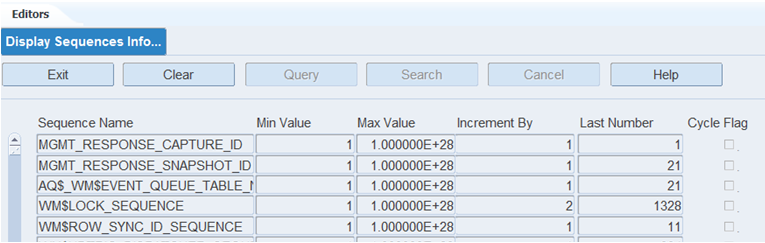
The Display Sequences Information allows you to view sizing information specific to the sequences used by RWMS. You can use this information to determine whether a sequence is being called as many times as originally planned.
From the main menu, select DBA Administration > Display Sequences Information. The current sequence details appear in the Display Sequences Information window.
Exit the Display Sequences Information Window
Click Exit to close the window.
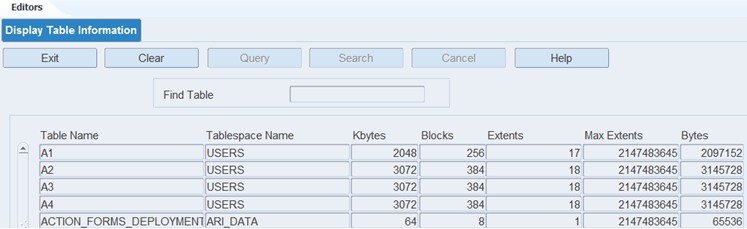
The Display Table Information allows you to view sizing information for database tables. You can monitor the number of extents in order to detect table growth. A large extent value indicates possible table fragmentation. If the number of extents becomes too large, the table should be rebuilt.
From the main menu, select DBA Administration > Display Table Information. The current tables appear in the Display Table Information window.
Display Details for One Table
If any table details are currently displayed, click Clear
Click Query.
In the Find Table field, enter the name of a table, or click the LOV button and select the table.
Click Search. The details for the selected table appear.
Exit the Display Table Information Window
Click Exit to close the window.
The Manual Script Launch Editor allows you to submit a batch job with its required parameters from the GUI window that in previous versions had to be launched using SQL in the background. The scripts that can be launched include: Automate Wave, Inventory Balance Upload, Process Diverts, Purge RWMS Tables, Run Distribution, Run Task Priority, Schedule Cycle Count, Schedule ROP Distribution, Unreconciled Appointment Monitor, Maintain Wave Statistics, and Insert Distribution Queue.
From the Main Menu select DBA Administration > Manual Script Launch Editor.
Running a Script
Select the Program Name of the script you want to run.
Based on the Program Name selected set your Program Parameters and then click Run Now.
Enter the date range (Start Date and End Date) to view Program Execution History. These are the jobs that have run successfully in this time frame.
View batch results in the Program Execution Details section.
Exit Manual Script Launch Editor
Click Exit to close the window.