| Oracle® Retail Predictive Application Server User Guide for the Fusion Client Release 16.0 E81120-03 |
|


 Previous |
 Next |
| Oracle® Retail Predictive Application Server User Guide for the Fusion Client Release 16.0 E81120-03 |
|
Previous |
Next |
Drag and drop is enabled in workbook wizards, where it is used to add or remove products, time periods, and other entities from a workbook. It is used in the Show/Hide measure dialog box to add or remove measures from a worksheet or to re-order them. It is also enabled in the planning workspace via a worksheet type called a "tiled view."
The tiled view is ideal for adding or removing one or more styles or style-colors from a cluster's assortment, a promotion, and so on. More generally, it can be used in any situation where dragging a tile from one worksheet to another represents a business operation. This capability is fully configurable.
The results of the drag and drop action are stored by RPAS, and these results can be used to filter which tiles are visible in the tiled view.
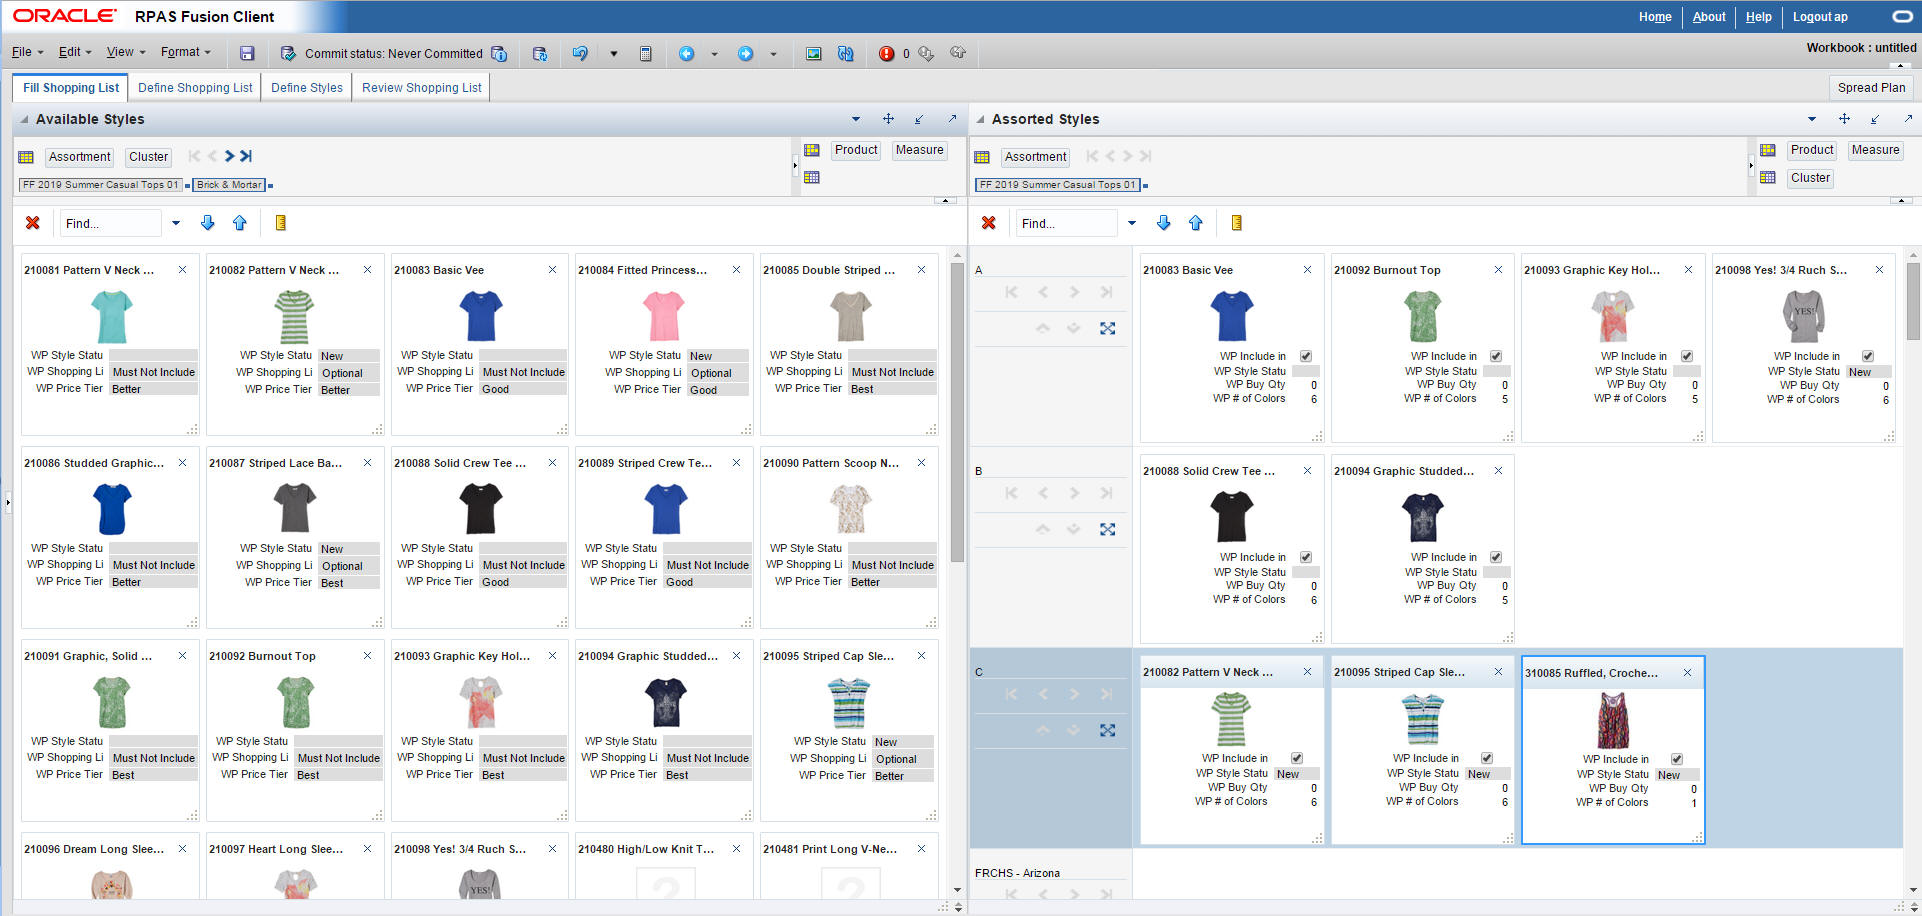
Figure 15-1 illustrates how the tiled view can be used. The business operation in the example shows how a planner can graphically build an assortment by dragging styles from a pool into the assortment.
The Available Styles view (left) contains the pool of all available styles. The Assorted Styles view (right) contains the assortment of styles that are to be offered in specific store clusters. In order to modify the assortment, the planner selects one or more styles from Available Styles, then drags and drops them onto Assorted Styles. The items are added to the appropriate row in the Assorted Styles, updating that assortment or cluster. Similarly, the planner can drag and drop a style from Assorted Styles back to the Available Styles in order to remove that style from that assortment. The results can be saved, committed, and further operated on as usual.
The tiled view is a worksheet type that can be configured in ConfigTools. The tiled view has both similarities and differences from the Pivot Table/Chart worksheet.
Like the Pivot Table/Chart worksheet, the tiled view can have multiple dimensions on the page or z-axis. The dimensions in the Page Edge can be used for the driving positions in a Position Query Definition (PQD). The dimensions in the Page Edge can be synchronized as usual. The dimension tiles can be used to bring up the Dimension pop-up as usual, for access to that dimension's levels, Show Attributes and Sort, as well as the Show and Hide tabs.
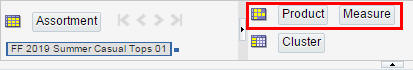
Unlike the Pivot Table/Chart worksheet, the tiled view can have at most one dimension on the row or y-axis. Also, the column or x-axis is fixed and cannot be changed. In terms of the tiled view, this axis is also called the "tile axis." In Figure 15-2, the tile (column) axis is shown in the red box. No other dimension tile can be moved to or away from the tile axis.
The single dimension in the row axis of the tiled view is also called the "tiled dimension."
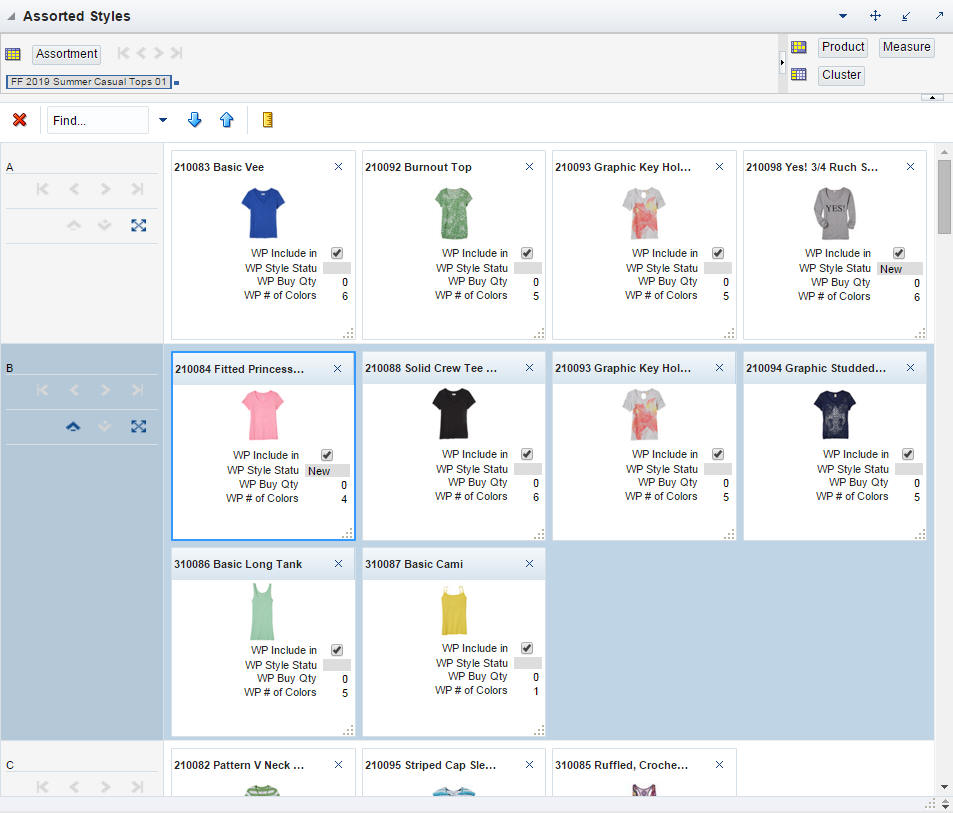
Each tile represents a tiled dimension position combined with the page and row positions. Each tile displays the values for visible attributes for the tiled dimension position. If measures are visible, each measure's label and value are shown in the tile. Figure 15-3 shows an example of a tiled view. The product and measure dimensions are in the tile axis, and each tile shows the product name as a tile title (for example, 210083 Basic Vee and 210092 Burnout Top). Several measures are displayed for each tile (WP Include in Shopping List, WP Style Status, WP Buy Qty, and WP # of Colors). The row dimension (Cluster) shows the clusters vertically along the page.
On the tiled view, every row contains a number of tiles. If there are more tiles in a row than can fit on a single line, the extra tiles are wrapped onto lines below the first. This can be seen for the items in Cluster B in Figure 15-3. There is no set limit to how many tiles can be shown in a row.
The actual tiles shown in a row are controlled by the following:
The settings in the Show and Hide tab in the Dimension pop-up
Any position filtering in effect
A Position Query Definition (PQD) in effect for that worksheet
The underlying Boolean measure that filters which tiles are shown on the tiled view. This Boolean measure is part of the definition of the tiled view and is what is updated when tiles are dragged and dropped from one worksheet onto another.
Dragging and dropping a tile updates the underlying Boolean measure directly, and changes are reflected immediately on the tiled view.
In addition, there are a number of ways to affect which tiles are shown via edits to the underlying Boolean measure (either directly or indirectly), including:
Removing a tile (by clicking the x in the tile's upper right hand corner)
Changing a value using a check box in a tile
Changing a value using an edit in a pivot table or chart
Fill, clear, cut, and paste
Refreshing the workbook
These edits also cause the tiled view to be updated immediately. This occurs regardless of the user operation causing the edit or the view that was edited.
The effects of each of the above factors are cumulative. For example, a tile hidden via position filtering will not show up even if it is visible per the Show and Hide tab in the Dimension pop-up. In addition, because some of the filtering listed above can apply to individual rows on the worksheet, the filtering can vary between rows.
The order in which the tiles are displayed is controlled by two factors. The first factor is the underlying ordering of the dimension itself. This does not change from row to row in a tiled view, and if the tiled view is represented as a pivot table, this ordering will be the same as the order of the items in the column. This ordering is the same for all rows in a tiled view. As with the pivot table, this ordering can be modified by using the Show Attributes and Sort tab of the Dimension pop-up.
However, the ordering of the tiles can be temporarily changed by just dragging and dropping. A dropped tile appears in the row of tiles where it is dropped. This is temporary. The dropped tiles are sorted into their regular place whenever the worksheet is calculated, saved, or the row is scrolled off screen by a new fetch.
The rows shown in the tiled view are determined by the dimension in the row edge. The rows can be scrolled vertically as usual. The dimension can also be formatted as usual. Multiple levels of this dimension can be displayed in either block or outline mode. When multiple levels are shown, the page and row positions for the aggregated levels will use aggregated values for both filtering and displaying measure values within the tile.
If no dimension is shown in the row edge, then all positions are displayed in a single large row, as shown in the Available Styles worksheet in Figure 15-1. Figure 15-4 shows this situation in detail.
In general, there are more tiles (positions) in a row than space available for display. This is addressed in several ways in the tiled view.
The first way is that each row can be adjusted to show more than one row of tiles.This can be seen in Figure 15-3, where the Cluster B position shows two rows of tiles within a single row of the worksheet.
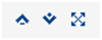
Figure 15-5 shows the View Port Controls that can be used to control the number of tile rows.This mini-toolbar is displayed for each row on the worksheet.
Remove Row: Removes a display row. Disabled if only one display row is visible.
Add Row: Displays another display row for a given logical row. If the screen width is such that it displays five tiles in a single row, clicking this button will display another row, creating a worksheet row that now displays two rows of five tiles. The number of rows that can be added is limited by the Maximum Display Rows setting (for example, 10). This button is disabled if the last tile in the row is already visible.
Expand Row: Displays all rows in a vertically scrolling View Port. Other rows in the view are not visible when a row is expanded in this way.
Back to Multi-Row View: This control is only accessible when a row has been expanded.
In conjunction with the number of tile rows that are displayed per worksheet row, each worksheet row can be scrolled individually. If the worksheet row is in multi-row mode, then a horizontal scrollbar is used. Otherwise, a vertical scrollbar is used.
The ordering and filtering of tiles within a tile row need not be the same from one row to the next. Each worksheet row has its own scrolling and paging controls that apply only to that individual row. Figure 15-6 shows the scrolling and paging controls.
Show First: Displays the first chunk of tiles and puts the first tile in the first position of the first display row. Disabled if the first tile is currently visible.
Show Previous: Displays the previous chunk of tiles x display rows. Disabled if the first tile is currently visible.
Show Next: Displays the next chunk of tiles x display rows. Disabled if the last tile is currently visible.
Show Last: Displays last chunk of tiles and puts the last tile in the last position of the last display row. Disabled if the last tile is currently visible.
If the worksheet row contains more than about two dozen tiles, or if there are more than a half dozen rows displayed, seeing all of the contents of a row or the contents of adjacent rows becomes difficult. In either case, the per-row scrolling and paging controls are less useful.
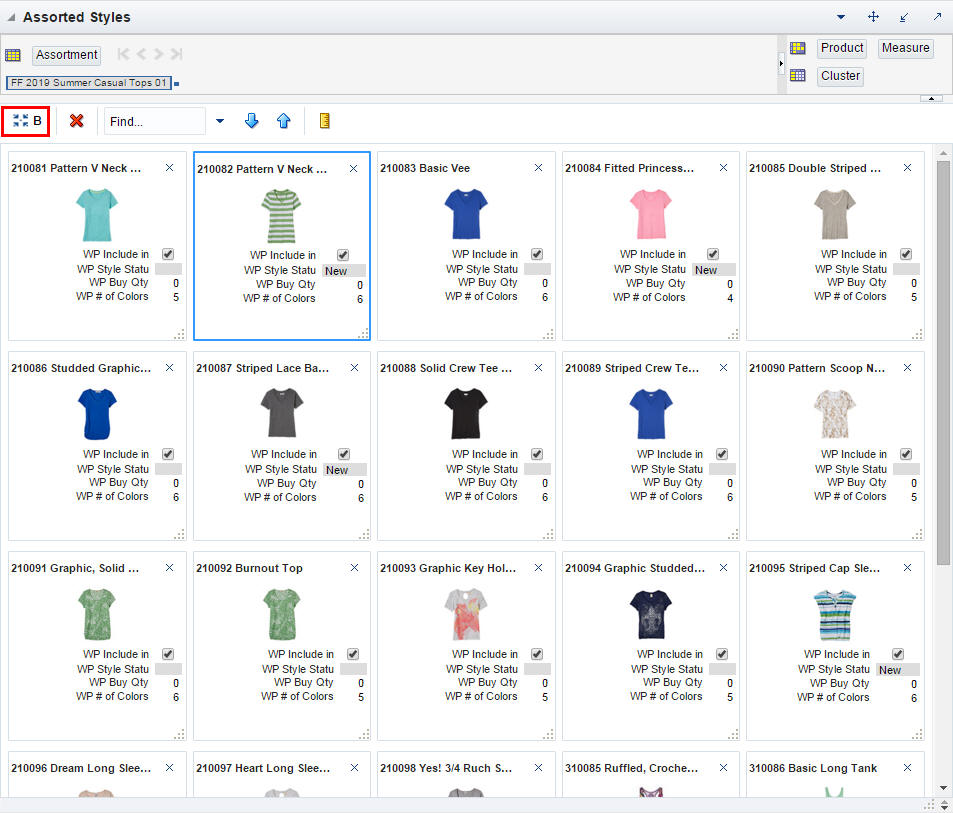
In this case, there is another option. A special Expanded Row user interface allows users to focus on a single worksheet row that is laid out in tile rows. A more typical vertical scrollbar is available for continuous scrolling of tile rows. Figure 15-7 shows this feature. In this example, the row Cluster B has been expanded. The other rows are no longer visible.
The Collapse Expanded Row button (boxed in red) restores the original multi-row view.
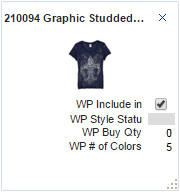
The content of each tile is based on the visible attributes followed by the visible measures. There is no requirement that images be displayed. Figure 15-8 and Figure 15-9 provides some examples of tiles.
A tile displays the values of the visible attributes for the level of the tile dimension position, one per line, in order.
The visible attributes and their order may be specified in ConfigTools via the Window Formatting tab in the Worksheet tool, and they may be altered by the Show Attributes tab of the Dimension pop-up. At least one attribute is included here. If all attributes are hidden, the label is shown. There is no requirement that images be included.
If the label attribute is shown, it is displayed in the header of the tile. Attribute labels are not displayed in the tile (but may be available via hover). The attribute values are formatted and styled as they would be in a pivot table header.
The tile displays the label and value of each visible measure, one per line, in order below the attributes. There is no requirement that any measures be displayed.
Visible measures are configured via Measure Profiles in the ConfigTools Worksheet tool, just like they are for pivot tables. The user may use the Dimension pop-up on the Measure dimension to switch between measure profiles, show or hide individual measures, create new measure profiles, and so on.
The measure labels are styled as they are in pivot table headers (Measure Styles/Headers). The measure cells are formatted and styled as they are in pivot table cells. This includes Measure Styles/Cells, Number, Date/Time, Exception Format, and Real Time Alerts.
If the cell is read-only or locked, that will be indicated here. If the cell is editable in a pivot table, it will be editable here as well.
Tiles are meant to be compact, summary objects that can be dragged and dropped. A tile has limited space, and the physical size of the screen and its resolution set a practical limit on how large a given tile can be. The attribute and measure display tries to make effective use of the available space, but compromises are made and the end user cannot control the sizing of individual cells. In some cases, values or labels may be clipped or all the attributes and measures in a tile of reasonable size may not be visible.
A tile can be resized by dragging the lower right hand corner of the tile. This changes the size of all tiles for this level of a worksheet row. There is a limit to how large you can make a tile; this can be controlled by the administrator. Figure 15-10 shows the location of the resize control boxed in red.
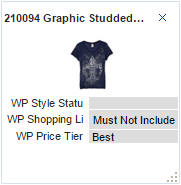
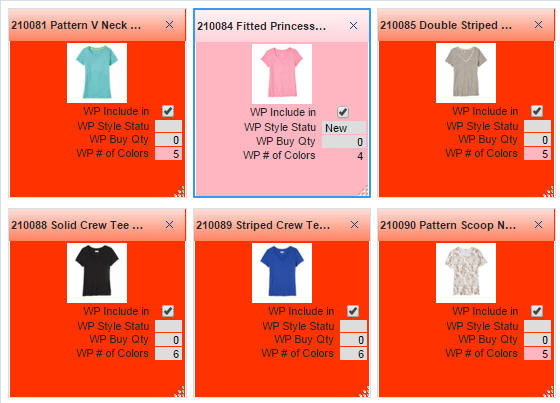
In addition to formatting the attribute and measure content of the tile, formatting can be applied to the tile itself. This is done by using the formatting of the tile measure's cell as styles for the tile. The tile's background color is taken from the cell's background color. If possible, the tile's border color is taken from the cell's text color. As an example, Figure 15-11 shows formatting applied to a specific tile and a specific measure. The tile formatting is based on the WP Style Status measure being New, and the measure is when WP # of Colors is less than 6.
The tile measure does not have to be one of the visible measures shown in the tile content for this to work. It just has to be designated as the tile measure in a tiled view. If the tile measure is the target measure of a Real Time Alert, the alert measure is evaluated and used to determine the styles and hover information.
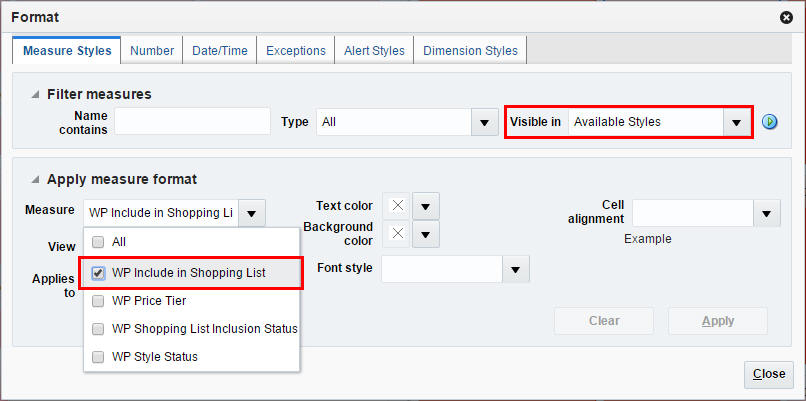
The Format Dialog filters measures by what is visible in the selected view(s). For this purposes the tile measure for the tiled view must always be included so that the formatting can be set. Figure 15-12 shows the Format Dialog.
In the above example, the WP Include in Shopping List measure is available for the Available Styles even though it is not a visible measure in that view. It is included because it is the tile measure for that worksheet.
In order to drag an item, you just click at the top of a tile and start dragging. You can make a multi-tile selection by clicking on the first tile, then ctrl-clicking to add others. Once you have a multi-tile selection, you can drag the whole selection.
Dragged items can be dropped onto a tile row or on a row on the row edge. Fusion Client adds the dropped tiles to the worksheet rows, provided it makes sense. That is, the ability to drag and drop must be enabled in the configuration. The initial setup includes specifying a source worksheet and a destination worksheet, as well as what information moves from the source to the destination as part of the drag and drop action. Dropped items are not automatically added. Fusion Client checks to make sure that the information dragged from the source makes sense in the context of the destination, that protection processing and locks are respected, base and aggregated states are editable, and so on.
If the drop is permitted, several things can occur. The underlying Boolean measure gets updated. This has the usual effect of an edited cell value. The new value is shown in any views in which it is visible, it can trigger an exception format formatting change, have protection processing effects, and so on. If the destination tile is already present, the drop will have no effect.
Note that it is possible that some dropped tiles may be hidden due to Show/Hide, Position Filtering, or PQD filtering. The dropped tile may also not be visible because of the layout of the screen and the limited number of tiles that can be shown at one time. This does not cause the drop to be rejected. If the drop is rejected, an error message will be displayed.
In a tiled view, you can drag items in the destination worksheet at will. All this does is temporarily adjust the ordering of the tiles (see The Ordering of Tiles in a Row).
The Pivot Table/Chart worksheet supports a wide variety of operations on both the view and the workbook. In many cases, the tiled view supports the same operations, adjusted for the different selection model. Some features do not translate well to the tiled view, and are not included. Table 15-1 lists support for various features found in the Pivot Table/Chart worksheet.
Table 15-1 Features Supported by the Tiled View
| Feature | Supported | Comments |
|---|---|---|
|
Copy/Rename View |
Yes |
|
|
Insert Measures |
Yes |
|
|
Page Edge Synchronization |
Yes |
|
|
PQDs and Auto PQDs |
Yes |
|
|
View/Manage Images |
Yes |
|
|
Clear and Fill |
Partial |
Selected items must be visible. No Quick Fill. |
|
Cut, Copy, and Paste |
Partial |
Selected items must be visible. |
|
Detail Pop-ups |
Partial |
The context menu for launching a detail pop-up is available on either a position or a cell (only). |
|
Lock Cell and Lock Measure |
Partial |
The measure or cell to be locked must be visible on one of the tiles. |
|
Position Filtering |
Partial |
Filtering using a selection of tiles represents only the positions used in any of the intersections of the underlying selected tiles. |
|
Simple Sort |
Partial |
|
|
Workbook Transitions |
Partial |
Tiled views are supported as a target for Master/Detail transitions. They are supported as a source for Master Detail transitions if the tiles are visible and selected. They are supported as a source for Detail Pop-up transitions via the context menu. |
|
Batch Alerts |
No |
|
|
Level Splitting |
No |
|
|
Print & Export |
No |
|
|
Real Time Alerts |
No |
Tiles and tile content may be formatted by Real Time Alerts, including hover information. Filtering and Alert Navigation are not supported. |