31 Monitoring Oracle B2B
This chapter describes how to monitor Oracle B2B using Oracle Enterprise Manager Fusion Middleware Control.
This chapter includes the following topics:
31.1 Monitoring the B2B Infrastructure
To monitor the B2B infrastructure, EM metrics must be enabled (which is the default setting) on the B2B Server Properties page. Use the B2B Server Properties link under Related Links to change the setting. See Section 30.1, "Configuring B2B Server Properties," for more information on enabling EM metrics.
You can monitor the following:
-
B2B infrastructure (SOA binding)
To monitor the B2B infrastructure using Oracle Enterprise Manager Fusion Middleware Control:
-
Expand the SOA node.
-
Select the SOA infrastructure, for example, soa-infra (soa_server1).
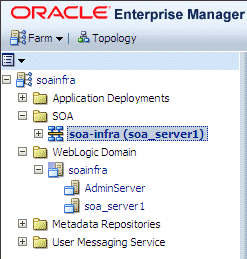
Description of the illustration b2b_mon_binding1.gif
-
From the SOA Infrastructure menu, select Bindings > B2B.
-
View the following:
-
Top 5 Recently Active Document Types
This section shows the active document types with the maximum number of messages exchanged (inbound and outbound combined) during the current session of the server.
The document types listed in this section are from Oracle DMS metrics, triggered by run-time sensors. This data is not persisted. Therefore, if Oracle B2B is restarted, then new data based on Oracle B2B activity appears here.
The section displays the following information:
-
Number of Messages Processed: Shows the number of document messages exchanged between the host and trading partners. Outbound indicates messages sent from the host to the trading partner and Inbound indicates messages sent from the trading partner to the host.
-
Average Message Processing Time (sec): Shows the average document processing time, in seconds, for both outbound and inbound messages.
-
Average Message Size (kb): Shows the average document size, in kilobytes, for both outbound and inbound messages.
-
Errors: Shows the document error count.
-
-
Top 5 Recently Active Trading Partners
This section shows the active trading partners with the maximum number of messages exchanged (from and to combined) during the current session of the server.
The trading partners listed here are from Oracle DMS metrics, triggered by run-time sensors. This data is not persisted. Therefore, if Oracle B2B is restarted, then new data based on Oracle B2B activity appears here.
The section displays the following information:
-
Number of Messages Processed: Shows the number of messages sent and received between the host and trading partners. From indicates messages sent from this party to its trading partner. To indicates messages received by the party from the trading partner.
-
Average Message Processing Time (sec): Shows the average document processing time, in seconds, for exchanged messages.
-
Average Message Size (kb): Shows the average document size, in kilobytes, for exchanged messages.
-
Errors: Shows the document error count.
-
-
Inbound Endpoints
Endpoint metrics show the status of the listening endpoints at the time the connection was attempted (not for a later point in time). For example, in an EDI transaction using Generic File transport, when Oracle B2B reads from a directory, that directory is the inbound endpoint.
The section displays the following information:
-
Protocol: Indicates the type of transport protocol used in the exchange, for example, File, AQ, and FTP, among others.
-
Endpoint: Indicates the location from which messages are received. The endpoint can be a URL, folders, or path, among others.
-
Status: Indicates the status (up or down) of the endpoint (protocol) the last time a connection was attempted.
-
-
Outbound Endpoints
Endpoint metrics show the status of the delivery endpoints at the time the delivery was attempted (not for a later point in time). For example, in an EDI transaction using Generic File transport, when Oracle B2B writes to a directory, that directory is the outbound endpoint.
The section displays the following information:
-
Protocol: Indicates the type of transport protocol used in the exchange, for example, File, AQ, and FTP, among others.
-
Endpoint: Indicates the location to which messages are sent. The endpoint can be a URL, folders, or path, among others.
-
Status: Indicates the status (up or down) of the endpoint (protocol) the last time a delivery was attempted.
Note that information displayed in Oracle Enterprise Manager is based on DMS metrics, including inbound and outbound endpoints. Therefore, changes to Oracle B2B run-time data are not necessarily or immediately reflected in the Oracle Enterprise Manager console.
For example, if you purge run-time data or make B2B configuration changes in the Oracle B2B interface, the changes do not affect DMS metrics. To view current run-time data, use the Oracle B2B interface. Enterprise Manager Console data shows B2B message traffic from the time the B2B (SOA) server starts.
-
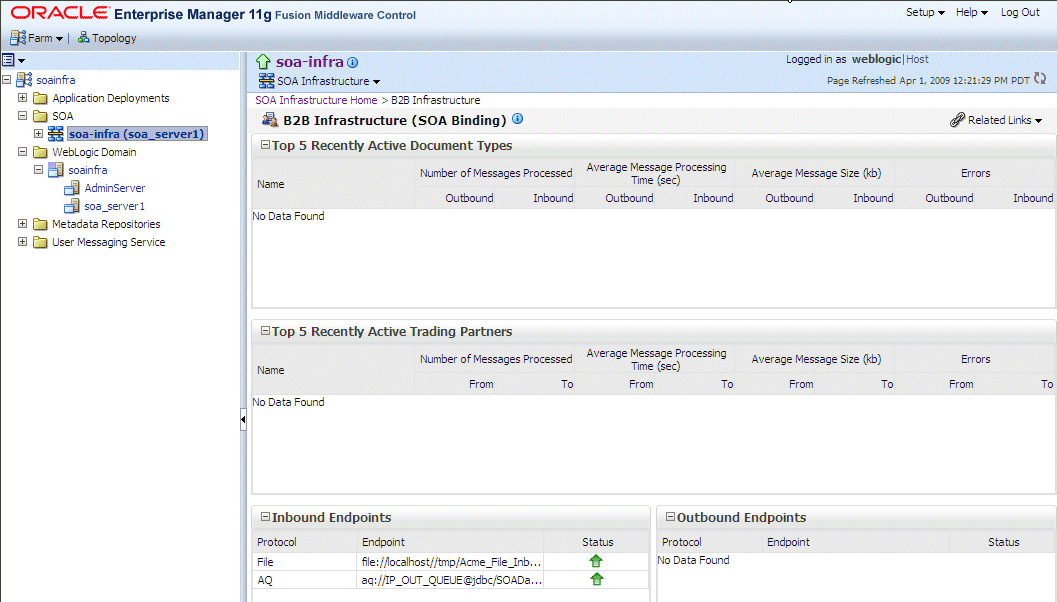
Description of the illustration b2b_mon1.gif
-
31.2 Accessing Oracle B2B from the B2B Infrastructure Page
Use the B2B Console link under Related Links, as shown in Figure 31-1, to log in to Oracle B2B.
Figure 31-1 Accessing Oracle B2B from Oracle Enterprise Manager Fusion Middleware Control

Description of "Figure 31-1 Accessing Oracle B2B from Oracle Enterprise Manager Fusion Middleware Control"
See Oracle Fusion Middleware User's Guide for Oracle B2B for information on using the Oracle B2B interface.
31.3 Viewing the Message Flow of a B2B Binding Component
To view the message flow of a B2B binding component in a SOA composite application instance:
-
Select a SOA composite application with a B2B binding component.
A list of the recent instances is displayed in the Dashboard tab.
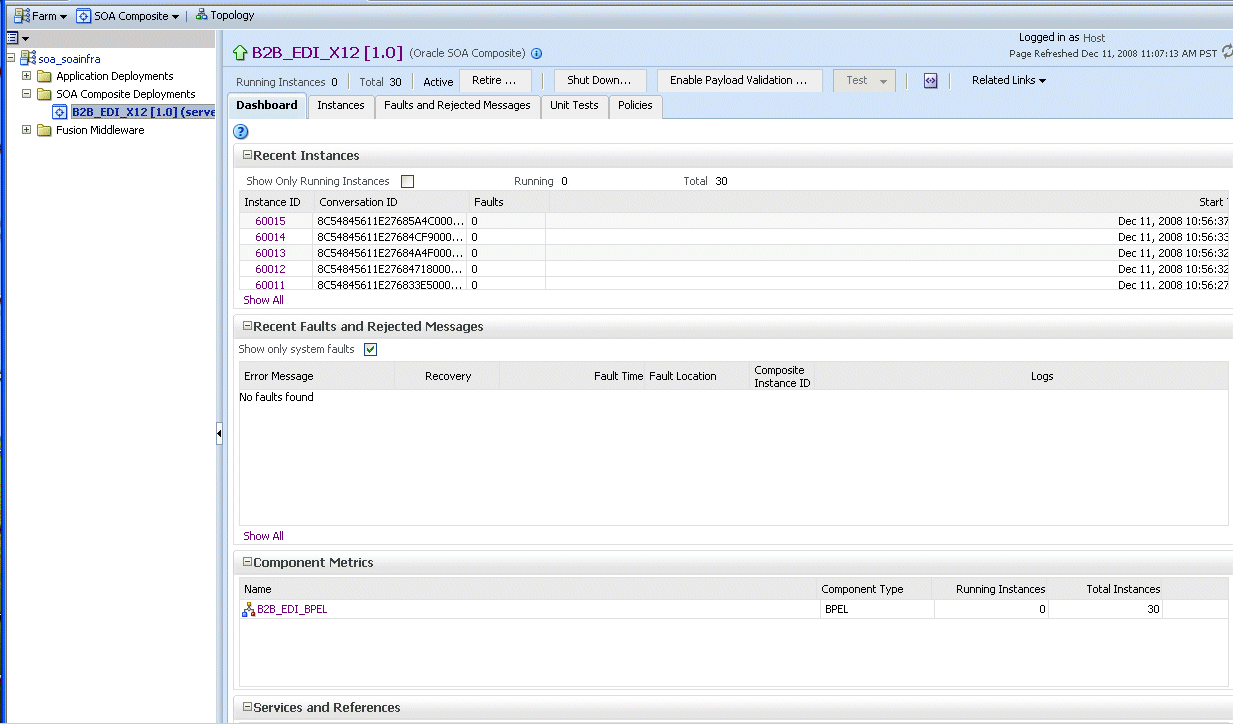
Description of the illustration b2b_composite1.gif
-
To see all instances of this composite application, click the Instances tab.
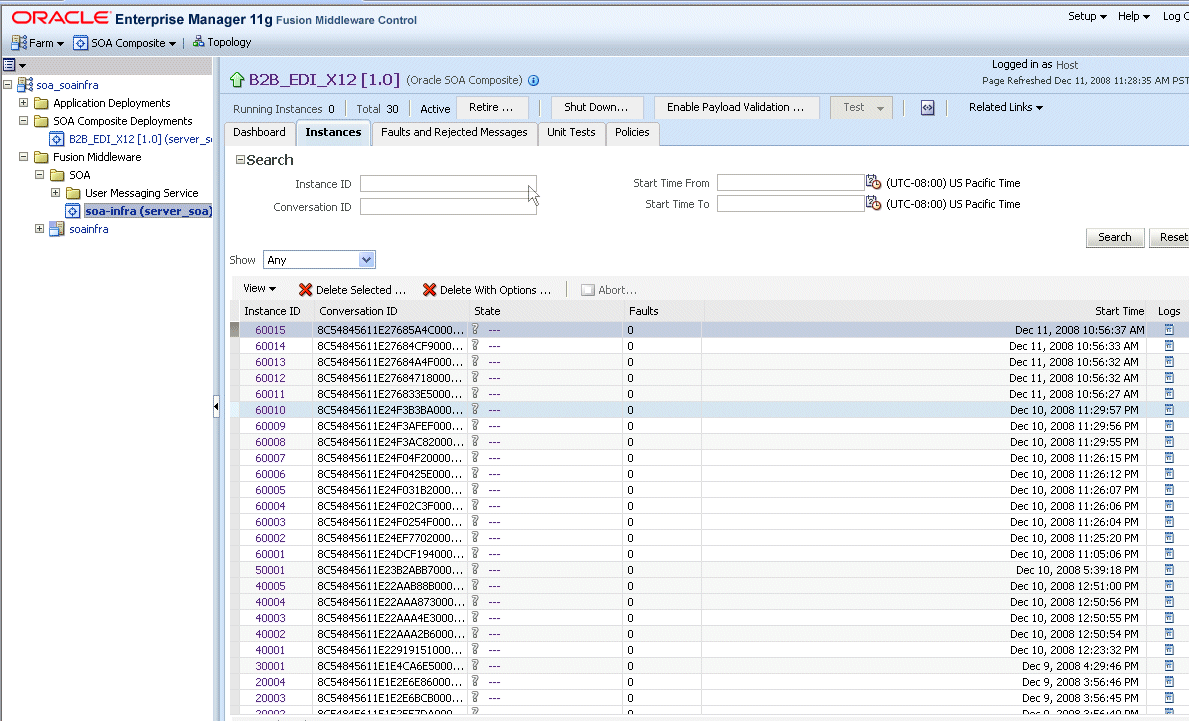
Description of the illustration b2b_composite2.gif
Note:
You can see details of a specific message by searching on the instance ID on the Reports tab of Oracle B2B. -
Click a specific instance in the Instance ID list to see faults and the flow trace.
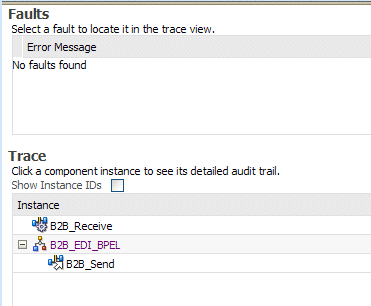
Description of the illustration b2b_trace1.gif
The Trace displays the following details:
-
The Faults section shows the faults occurring and sensor information collected in the services, service components, and references that comprise the SOA composite application.
-
The Trace section shows the sequence of the message flow through the services, service components, and references that comprise the SOA composite application.
-
See Part XIV, "Administering Binding Components" for more information about monitoring services and references.