

|
The Oracle JRockit Mission Control 2.0 tools suite includes tools to monitor, manage, profile, and eliminate memory leaks in your Java application without introducing the performance overhead normally associated with these types of tools.
This section contains information on the following subjects:
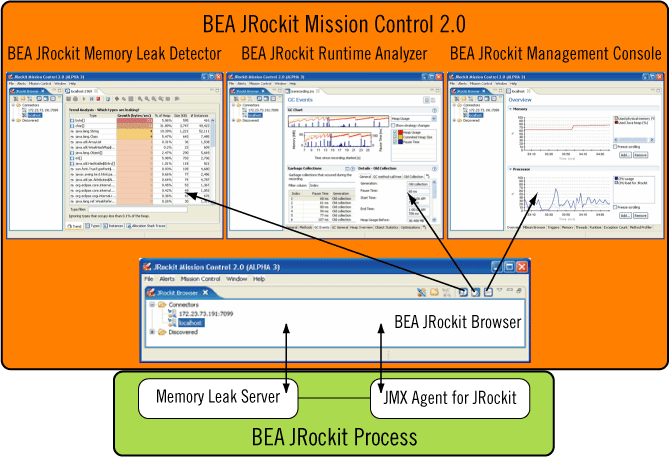
With the new Rich Client Platform (RCP) based JRockit Mission Control, you can launch the Memory Leak Detector, the JRockit Runtime Analyzer, and the JRockit Management Console from within the JRockit Mission Control (see Figure 6-1).

With the JMX Agent you have access to all MBeans deployed in the platform MBean server. From these MBeans, you can read attributes information, such as garbage collection pauses.
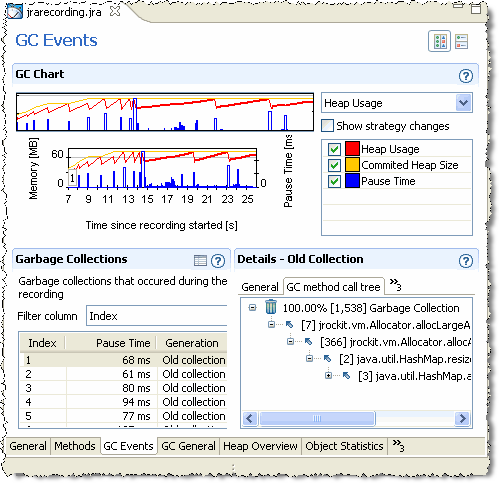
When a JRA recording is started from within JRockit Mission Control, it records the status of the JRockit JVM process for the time that you have specified and creates an XML file. This file is automatically opened in the JRockit Runtime Analyzer. Typical information that is recorded during a JRA recording is Java heap distribution, garbage collections, method optimizations, and method profiling information.
To find memory leaks in your Java application, you connect the JRockit Memory Leak Detector to the running JRockit JVM process. The Memory Leak Detector connects to the JMX (RMP) Agent that instructs to start a Memory Leak server where all further communication takes place.
The JRockit Mission Control executable is located in JROCKIT_HOME/bin. If this directory is on your system path, you can start JRockit Mission Control by simply typing jrmc in a command (shell) prompt.
Otherwise, you have to type the full path to the executable file, as shown below:
JROCKIT_HOME/bin/jrmc.exe (Windows)JROCKIT_HOME\bin\jrmc (Linux)
On Windows installations, you can start JRockit Mission Control from the Start menu.
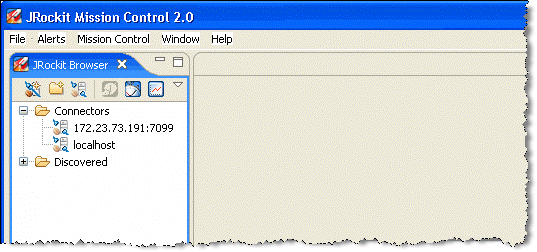
The JRockit Browser (see Figure 6-2) is new for the JRockit Mission Control 2.0 release. This tool allows you to set up and manage all running instances of JRockit JVM on your system. From the JRockit Browser you activate recordings, set up a tree view of different JRockit JVM instances to monitor, start other JRockit Mission Control tools, etc. Each JRockit JVM instance is referred to as a Connector.

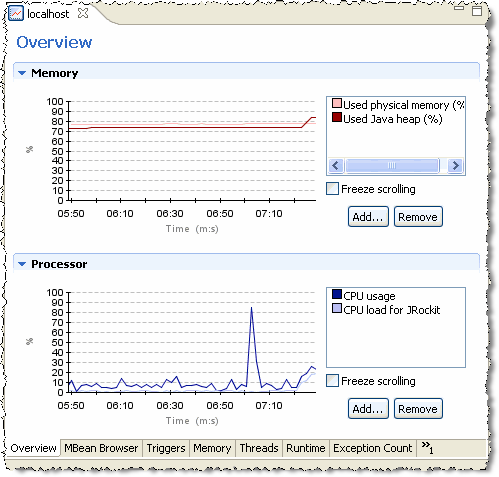
The JRockit Management Console (see Figure 6-3) is used to monitor a JRockit JVM instance. Several Management Consoles can be running concurrently side by side. The tool captures and presents live data about memory, CPU usage, and other runtime metrics. For the Management Console that is connected to Oracle JRockit JDK 5.0, information from any JMX MBean deployed in the JRockit JVM internal MBean server can be displayed as well. For a Console connected to Oracle JRockit JDK 1.4, RMP capabilities are exposed by a JMX proxy. JVM management includes dynamic control over CPU affinity, garbage collection strategy, memory pool sizes, and more.

The JRockit Runtime Analyzer (see Figure 6-4) is an on-demand “flight recorder” that produces detailed recordings about the JVM and the application it is running. The recorded profile can later be analyzed off line, using the JRA tool. Recorded data includes profiling of methods and locks, as well as garbage collection statistics, optimization decisions, and object statistics.

The JRockit Memory Leak Detector (see Figure 6-5) is a tool for discovering, and finding the cause for memory leaks in a Java application. The JRockit Memory Leak Detector’s trend analyzer discovers slow leaks, it shows detailed heap statistics (including referring types and instances to leaking objects), allocation sites, and it provides a quick drill down to the cause of the memory leak. The Memory Leak Detector uses advanced graphical presentation techniques to make it easier to navigate and understand the sometimes complex information.


|