User Guide
|
|
Tracing
BEA AquaLogic Service Bus provides the capability to trace messages without having to shut down the server. This feature is useful in both a development and production environment. Tracing allows administrators, support engineers, and systems engineers to troubleshoot and diagnose a message flow in one or more proxy services.
For example, if one of your proxy services is failing and you want to find out at which stage the problem exists, you can enable tracing for that proxy service. After tracing is enabled, the system logs various details extracted from the message flow such as stage name, name of the pipeline, and route node name. The entire message context is also printed including headers and message body. In case of a fault in the message flow, additional details such as error code and reason are logged. Tracing occurs at the beginning and end of each component in the message flow, which includes stages, pipelines, and nodes (actions are not traced individually).
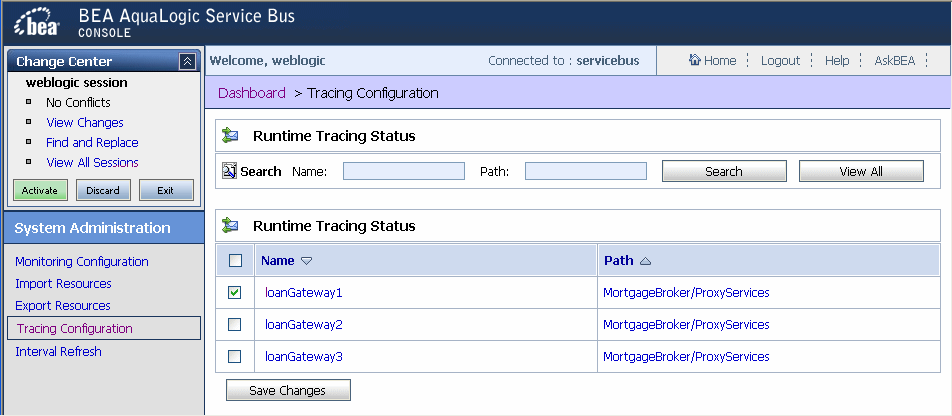
You enable tracing in the System Administration module of the AquaLogic Service Bus Console, as shown in the following figure.
Figure 7-1 Tracing Configuration
As shown in the preceding figure, the Tracing Configuration page displays the tracing status of the proxy services. If the check box adjacent to the name of the proxy service is selected, tracing is enabled for that service. The Runtime Tracing Status table displays the following information:
- Name—the name of the proxy service. The name is a link to the View Proxy Service Details page.
- Path—the project name and the name of the folder in which the proxy service resides. It is a link to the Project Details or Folder Details page.
Information about the pages referenced from the Runtime Tracing Status table is available in the AquaLogic Service Bus Console Online Help, as follows:
- View Proxy Service Details page—"Viewing and Changing Proxy Services" in Proxy Services
- Project Details—"Viewing Project Details" in Project Explorer
- Folder Details—"Viewing Folder Details" in Project Explorer
For information on how to use the AquaLogic Service Bus Console to enable tracing, see "Enabling Runtime Tracing Status of Proxy Services" in System Administration in the AquaLogic Service Bus Console Online Help.
Note: Remember to activate the session to start logging. Once the session has been activated, the trace setting is persisted along with the other details of the proxy service configuration.
The tracing information is placed in the server directory logs. For example, in the AquaLogic Service Bus Examples, the tracing information is logged in the following directory.
BEA_HOME\weblogic90\samples\domains\servicebus\servers\xbusServer\logs\xbusServer.log
In the preceding paragraph, BEA_HOME is the directory in which you installed your BEA products.
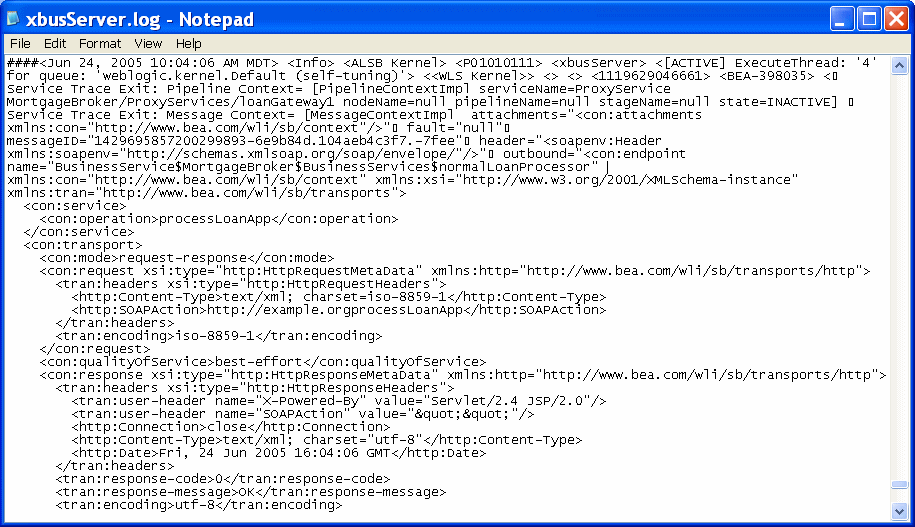
The following figure shows a sample of the tracing log.
Figure 7-2 Tracing Log Example

